“You have a pair of pants. In the left pocket, you have $100. You take $1 out of the left pocket and put in the right pocket. You now have $101. There is no diminution of dollars in your left pocket. That is one magic pair of pants.”

Category: Uncategorized

Q3 2021 Earnings Calendar-Intro

Posted by JM on October 4, 2021 

Benjamin Graham once remarked that earnings are the principal factor driving stock prices.

Each quarter we will provide readers with weekly earnings updates of stocks on ‘The List’ during the calendar earnings season. Q3 has just ended, and companies are now beginning to report.

Earnings growth and dividend growth tend to go hand in hand so this information can tell us a lot about future dividend growth of our quality companies. Monitoring our dividend growers periodically is part of the process and reading the quarterly earnings releases is a good place to start.

Some of our dividend growers from ‘The List’ have reported quarterly earnings already, based on their fiscal year, with the majority of Q3 earnings scheduled to report in October.

The complete chart can be found below the updated List by selecting ‘The List’ menu item at the top of the page.

Q3 Estimates and Results:

SYMBOL COMPANY DATE ESTIMATE RESULT
BNS-T Bank of Nova Scotia 24-Aug $1.90 $2.01
RY-T Royal Bank of Canada 25-Aug $2.71 $3.00
TD-T TD Bank 26-Aug $1.92 $1.96
ATD-B-T Alimentation Couche-Tard Inc. 31-Aug $0.65 $0.71
DOL-T Dollarama Inc. 9-Sep $0.49 $0.48
ENGH-T Enghouse Systems Limited 9-Sep $0.39 $0.38

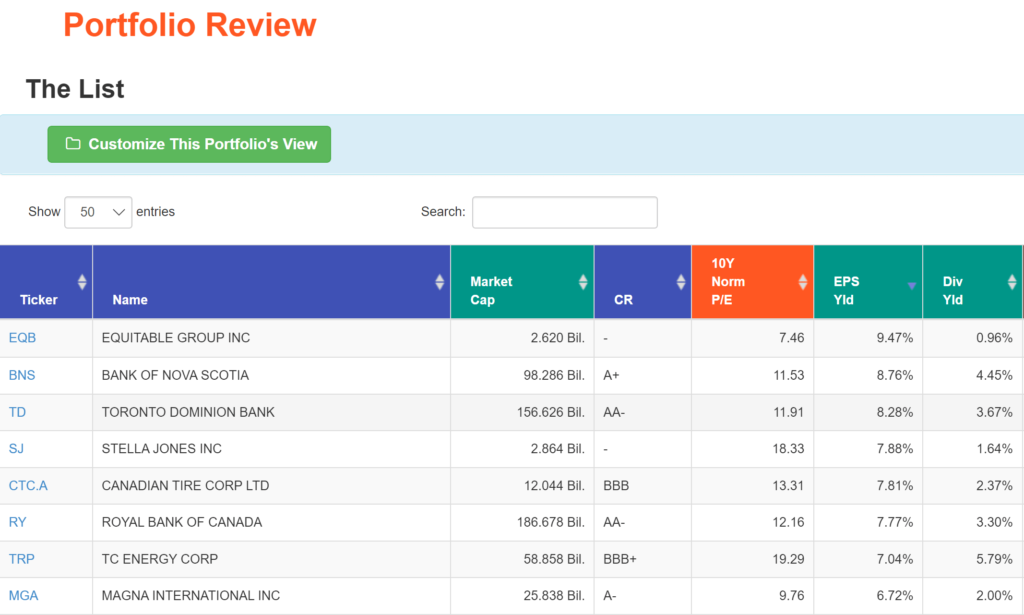
‘The List’ – Portfolio Review (September 2021)

Posted by BM on September 17, 2021 

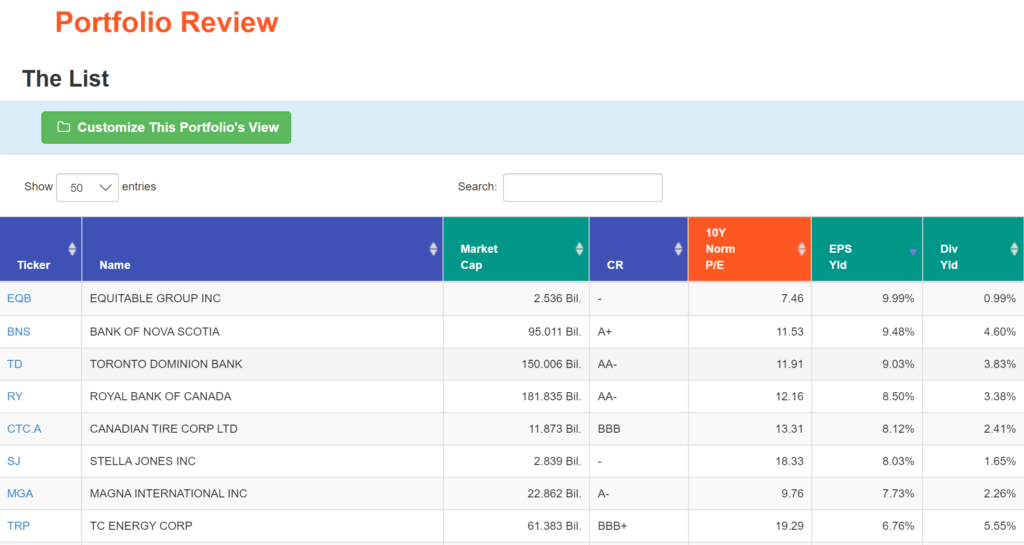
Each month I will walk through our valuation process using a stock on ‘The List’ that meets our minimum screen of 6.5% EPS Yld. This month it is Canadian Tire Corp. (CTC-A-T).

Valuation is the second step in our three-step process. Buying when our quality stocks are sensibly priced will help ensure our future investment returns meet our expectations. We rely heavily on the fundamental analyzer software tool (FASTgraphs) to help us understand the fundamentals of the stocks we invest in and then read the company’s website for investor presentations and recent earnings reports to learn more.

Intro:

Canadian Tire Corp. operates a network of 1,741 retail and gas outlets in Canada under the Canadian Tire, FGL Sports, Mark’s, and Petroleum banners. The stores offer living, fixing, automobile, sports, seasonal, gardening, and apparel products. The Retail segment (92% of 2020 revenues) is supported by the Financial Services division, which provides credit cards, retail deposits, and insurance products. It has three segments: Retail, CT REIT, and Financial Services.

CTC stores offer everything from automotive tools, apparel, and hardware to sporting goods and home essentials. The company has the advantage of being a one-stop shop for many Canadians. Through its diversified offerings, the company targets several customer segments at once.

Historical Graph:

Source: FASTgraphs

Comments:

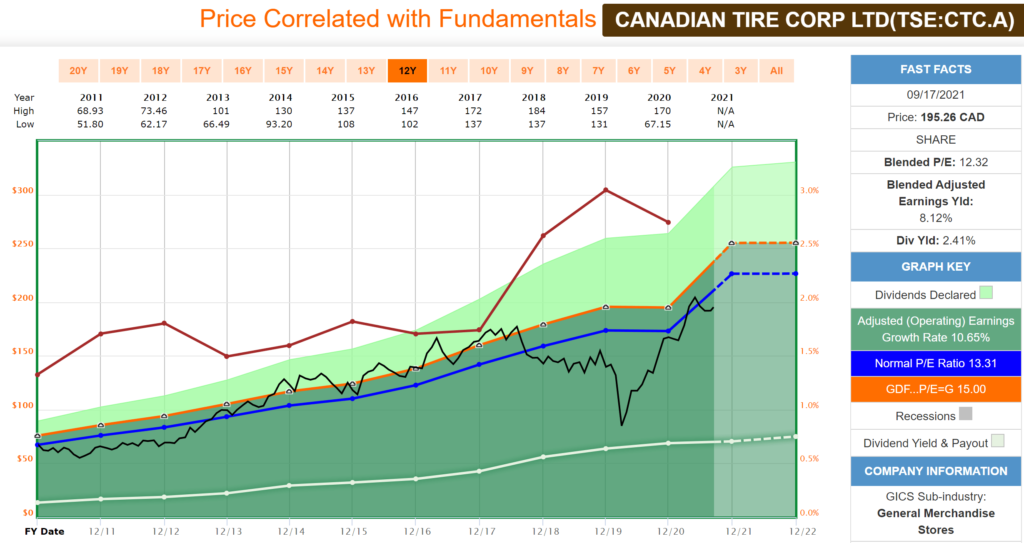
Canadian Tire is another of our good dividend growers that trades within a narrow valuation corridor. As you can see from the Blue Line on the graph (Average P/E) and the Black Line (Price), there is typically very little variance (except for the large dip in 2020 due to COVID). Investment opportunities occur when the Black Line falls below the Blue Line with this quality dividend grower. With a lower-than-average P/E, a relatively low payout ratio (White Line), higher than average yield (Red Line) and near-term double-digit growth, this company’s fundamentals look quite appealing at first glance.

Performance Graph:

Performance-CTC-A
Source: FASTgraphs

Comments:

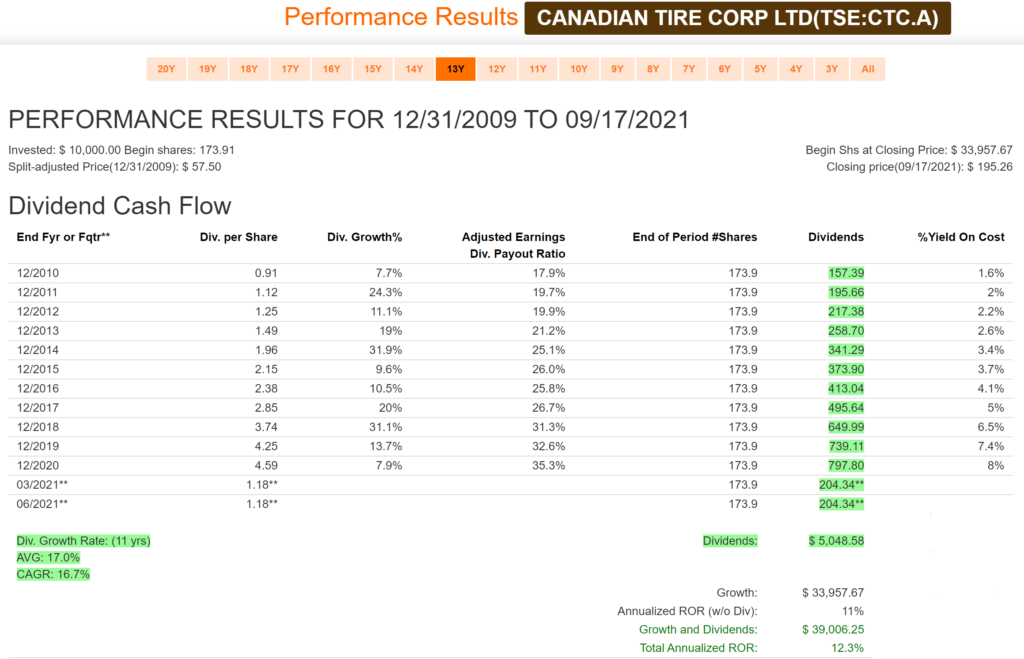
Canadian Tire has an excellent dividend growth rate (16.7%/year) over the last decade. An above average starting yield with a good dividend growth rate means it doesn’t take long for your income to compound and grow. With a starting yield of only 1.6% ten years ago, you would now be receiving a return of 8% on your original investment from the income alone.

Note: Dividend growth in 2021 to date is only 3.3%. A slowing dividend growth rate can mean that management isn’t as optimistic on future growth and wants to be cautious before raising the dividend too much. We will be paying close attention to this metric going forward with CTC.A.

Estimated Earnings:

Earnings-CTC-A
Source: FASTgraphs

Comments:

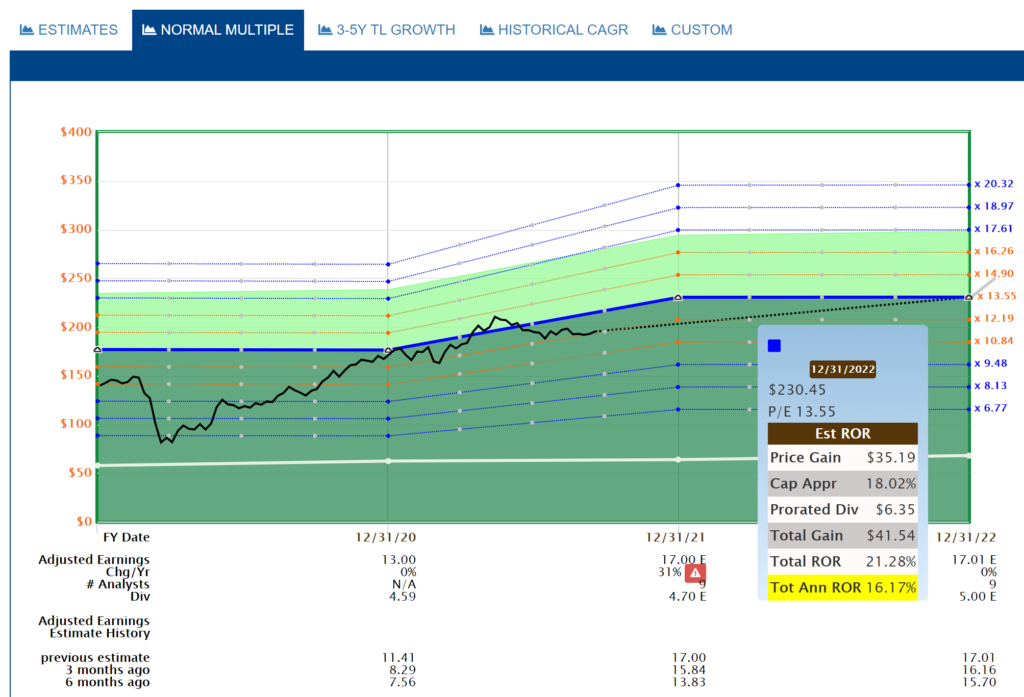
There are nine analysts covering Canadian Tire in 2021/2022. Earnings in 2021 are expected to be up significantly over 2020 so this is a bit of an anomaly (Red Triangle). With most of the good news factored in already, analysts don’t see a lot of price appreciation beyond year end.

Analyst Scorecard:

Scorecard-CTC-A
Source: FASTgraphs

Comments:

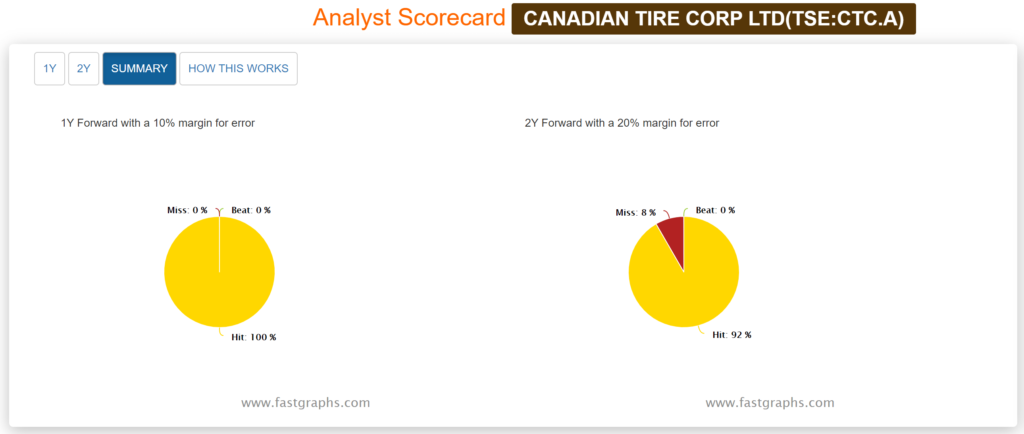
Analyst estimates over the years are quite accurate based on one and two-year earnings projections. Analysts projections have hit 100% of the time on one year estimates and 92% accuracy on two-year estimates.

Recent Earnings Report-Q2 2021:

Record quarterly e-commerce sales at $856.7 million and $2.1 billion over the last 12 months

  • eCommerce contributed to the growth in revenue, with CTR experiencing the largest quarter in its history for eCommerce sales, up 63.2% to more than $600 million
  • 8 million orders were fulfilled, double last quarter and up 38% compared to the second quarter last year.

Consolidated comparable sales (excluding Petroleum) were up 3.2% vs last year, and up 15.1% vs 2019

  • A longer period of restrictions compared to last year at CTR had particular impact in Ontario, which comprises 40% of the CTR store network, with stores closed for 70% of the quarter
  • CTR comparable sales were down 2.0% overall, with gardening, seasonal recreation, camping and automotive categories all growing double digit in the quarter. Compared to 2019, comparable sales were up 18.3%, with growth in over 70% of categories
  • Comparable store sales at SportChek were up 28.6%, and Mark’s up 43.2%, respectively, led by sales of athletic and industrial footwear and apparel. Compared to 2019, comparable sales were up 5.1% at SportChek and up slightly at Mark’s
  • Owned Brands penetration was 38% across the banners, representing close to $1.6 billion of sales in the quarter, with growth coming from Raleigh, Canvas, Diamondback and Denver Hayes

Strengthening engagement with Triangle Rewards members driving solid contributions

  • Members accounted for 57% of retail sales, and average member spend was up 3%
  • 33% of members shopped at more than one retail banner
  • Triangle Rewards members reached 10.4 million, with almost 600,000 new members joining the program in the quarter and strengthened engagement efforts to retain existing members

Our fourth consecutive quarter of strong retail segment earnings drove a significant increase in EPS and exceptional retail ROIC at 14.1%

  • Retail segment normalized income before income taxes increased $275.3 million, reflecting:
    • Retail revenue (excluding Petroleum) growth of 23.4%, fueled by revenue growth at all banners led by shipment growth at CTR
    • Gross margin rate (excluding Petroleum) increased 425 bps, up across all banners led by CTR
    • Operating leverage improved, with normalized SG&A expenses (excluding Petroleum) as a percentage of revenue improving by over 200 bps
  • Financial Services income before income taxes grew by $74.3 million, or 145.7%, in the quarter, reflecting:
    • Strong portfolio risk and customer metrics
    • A year over year improvement in gross margin due mainly to a $31.2 million reduction in the allowance for loans receivable compared to an incremental allowance in the prior year

Summary:

According to Value Line:

“Canadian Tire will likely continue to enjoy strong e-commerce sales in the near term. The retailer had exceptional first-quarter online sales, rising more than 250% year over year. While the company was fully operating in March, many Canadian provinces mandated strict restrictions and limited in-person activities. Thus, online orders remained high as more people were shopping from home. We expect this positive momentum to continue in the coming months and keep Canadian Tire’s digital sales in solid shape.

Also, 1.4 million additional customers signed up on the mobile application, and another 400,000 new members joined the loyalty program, Triangle Rewards. We like that the company has been offering multiple options for customers to shop, such as buy online, pickup in store or curbside, and home delivery.

Probably grow double digits to about $15.80 before advancing 2%-3% in 2022. The retail business will likely remain healthy in the coming quarters thanks to a pickup in outdoor and lifestyle categories. Furthermore, the Financial Services business is expected to benefit from more customers signing up for credit cards and joining the rewards program. Loyalists are more likely to make repeated purchases and spend more than average customers per trip.

Canadian Tire seems to be well positioned for long-term growth.”

Like so many companies, comparables in the first couple of quarters in 2021 were easily higher due to COVID in the first half of 2020. Many companies are now cautious about expecting large year-over-year increases for Q3/Q4 2021.

Canadian Tire has been an excellent dividend growth stock over the past decade and appears sensibly priced today. A smaller than expected increase in their 2021 dividend and Q3/Q4 earnings estimates that are lower than their comparable in 2020 send signals. We will wait and see on this one.

Dividend Growth Investing in Today’s Market

Posted by BM on September 13, 2021 

“While dividend investing is a timeless strategy, investors should consider several key attributes combined with today’s market dynamics.”

If you get a chance this week read the article published by nuveen, a global investment management firm.

– Available at: https://documents.nuveen.com/Documents/nuveen/Default.aspx?uniqueId=5d8a964c-cbcf-4a07-b181-eb6ace0eb3b4

The article reiterates a lot of the same attributes the dividend growth investors know and love. What caught my eye though was some of the other advantages that are specific to the market we are in today.

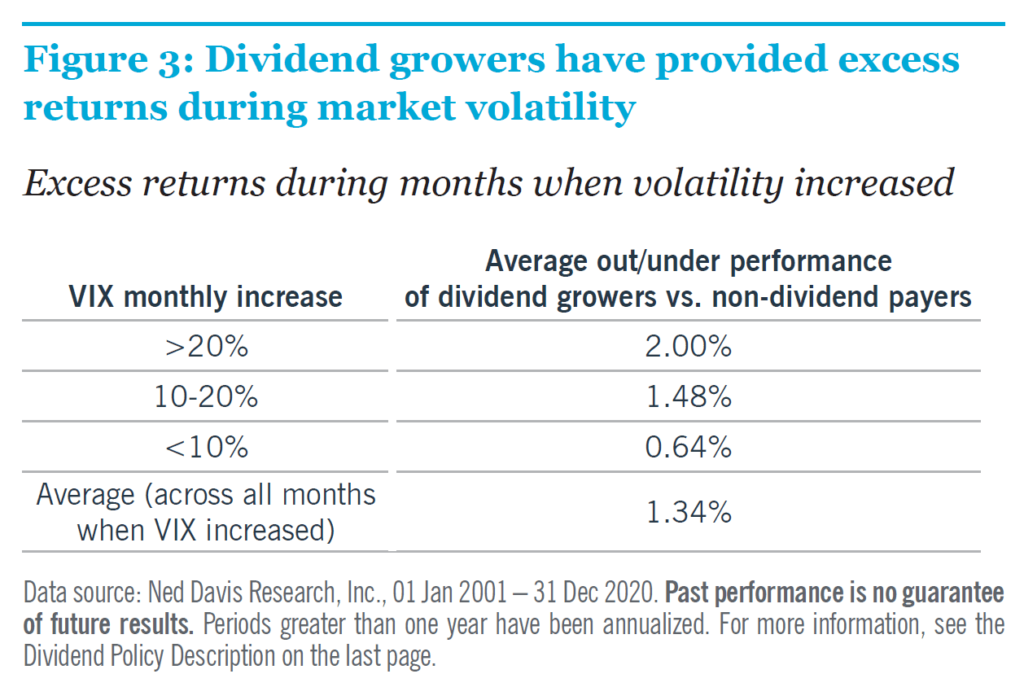
The first attribute that stood out for me was the research behind dividend growth companies and market volatility.

Comforting to know that during periods of market volatility, dividend growth stocks had provided excess returns. In today’s overvalued market of non-dividend payers, the probability that there will be an increase in volatility is on the rise.

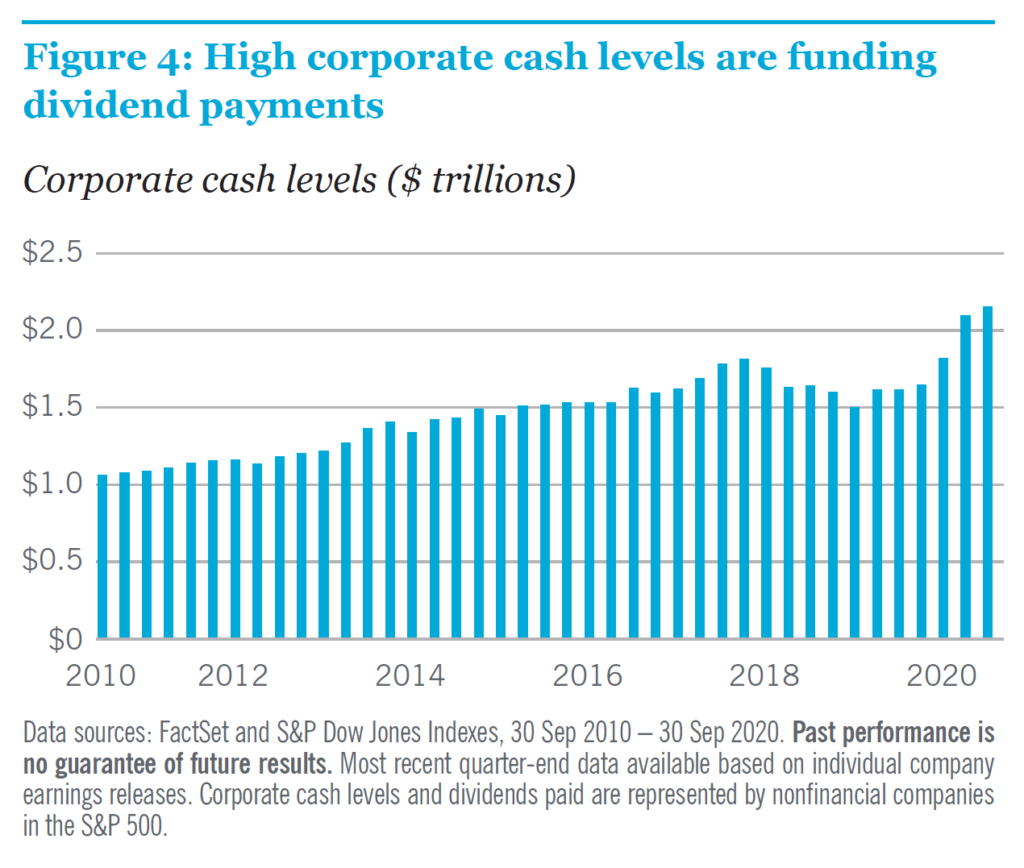
High levels of cash on corporate balance sheets in markets that are overvalued is good for dividend growth stocks.

According to this article, cash on corporate balance sheets are near their highest levels in two decades.

The good news for dividend growth investors is that corporate management teams are more likely to focus on raising dividends as opposed to stock buybacks given the price-to-earnings multiple expansions in 2019 and 2020 (the excitement factor). Buying overvalued stock would not be a good use of excess cash.

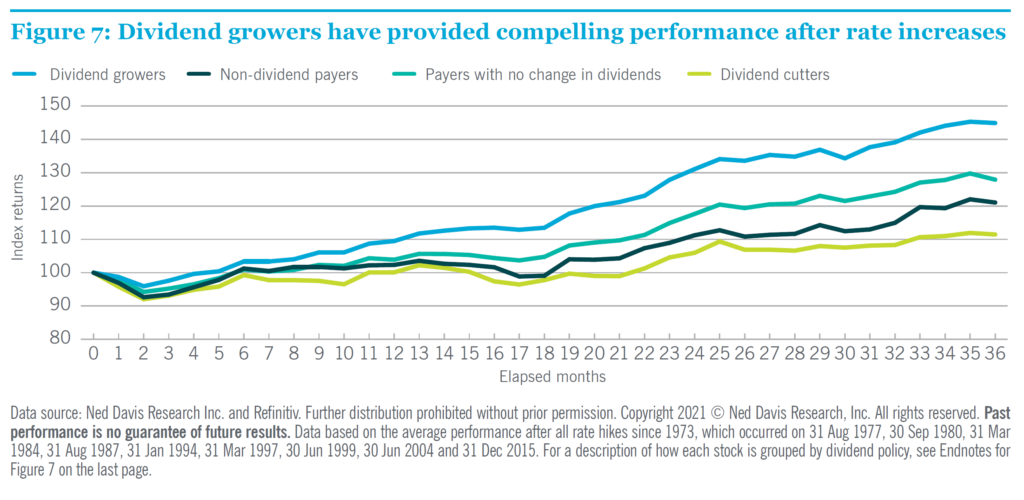
Dividend growers and initiators have outperformed after the Fed has increased interest rates.

Extraordinary levels of monetary and fiscal stimulus have boosted the economy, but inflation fears are on everyone’s mind. Although rates are currently near zero, a shift in policy with respect to interest rates may happen if inflation is more than transitory as the Fed will have us believe.

Today’s market dynamics are certainly cause for concern, but it helps to know that our dividend growers have attributes that will help mitigate the short term price return swings when market volatility eventually arrives.

Q2 2021 Earnings Calendar

Posted by JM on August 20, 2021 

Earnings are in! 

As expected, Q2 was a good quarter for the stocks on ‘The List’ with twenty two of our twenty-seven stocks exceeding expectations.

BIP-N was the big winner due to strong organic growth, the contribution from new investments and the recognition of gains on the sale of their Canadian district energy business and smart meter portfolio.

TFII-T gets honorable mention with a 50% beat on estimates.

On the losing side Enghouse Systems Limited (ENGH-T) missed analyst expectations by ~18% on reduced revenue. The shortfall can mainly be attributed to a decrease in licensing revenue from their Vidyo product. Video conferencing solutions like Vidyo saw record use during the early stages of COVID and are starting to taper off as business gets back to normal and more in-person communication. Nonetheless, ENGH-T is one company on ‘The List’ we will pay extra attention to in Q3.

DOL-T, CNR-T, FTS-T, MRU-T were all minor misses; some due to negative foreign exchange impacts while others were returning to pre COVID earnings after seeing an increase during COVID due to their business model.

As part of our process, we monitor earnings releases to make sure our good dividend growers are continuing to grow their earnings and that management continues to provide positive guidance going forward.

Here is ‘The List’ sorted by reporting date complete with the market’s consensus estimates and actual reported results.

SYMBOL COMPANY DATE ESTIMATE RESULT
RY-T Royal Bank of Canada 27-May $2.49 $2.79
TD-T TD Bank 27-May $1.76 $2.04
BNS-T Bank of Nova Scotia 1-Jun $1.76 $1.90
DOL-T Dollarama Inc. 9-Jun $0.38 $0.37
ENGH-T Enghouse Systems Limited 10-Jun $0.45 $0.37
ATD-B-T Alimentation Couche-Tard Inc. 29-Jun $0.42 $0.52
CNR-T Canadian National Railway 20-Jul $1.50 $1.49
TFII-T TFI International 26-Jul $0.96 $1.44
IFC-T Intact Financial 27-Jul $2.42 $3.26
TIH-T Toromont Industries 28-Jul $0.98 $1.02
EQB-T Equitable Group Inc 28-Jul $3.81 $4.05
CU-T Canadian Utilities Limited 29-Jul $0.39 $0.43
FTS-T Fortis 29-Jul $0.59 $0.55
TRP-T Trans Canada 29-Jul $0.96 $1.07
T-T Telus 29-Jul $0.26 $0.26
ENB-T Enbridge Inc. 30-Jul $0.57 $0.67
SJ-T Stella-Jones Inc. 3-Aug $1.47 $1.76
WCN-N Waste Connections 4-Aug $0.77 $0.81
CCL-B-T CCL Industries 5-Aug $0.77 $0.89
BIP-N Brookfield Infrastructure Partners 5-Aug $0.11 $0.61
BCE-T Bell Canada 5-Aug $0.78 $0.83
MGA-N Magna 6-Aug $1.39 $1.40
EMA-T Emera 10-Aug $0.54 $0.54
MRU-T Metro 10-Aug $1.13 $1.06
FNV-N Franco Nevada 11-Aug $0.92 $0.96
AQN-N Algonquin Power & Utilities 11-Aug $0.13 $0.15
CTC-A-T Canadian Tire 12-Aug $2.88 $3.72

‘The List’ – Portfolio Review (August 2021)

Posted by BM on August 15, 2021 

Each month I will walk through our valuation process using a stock on ‘The List’ that meets our minimum screen of 6.5% EPS Yld. This month it is Toronto Dominion Bank (TD-T).

Valuation is the second step in our three-step process. Buying when our quality stocks are sensibly priced will help ensure our future investment returns meet our expectations. We rely heavily on the fundamental analyzer software tool (FASTgraphs) to help us understand the fundamentals of the stocks we invest in and then read the company’s website for investor presentations and recent earnings reports to learn more.

Intro:

The Toronto-Dominion Bank (the Bank) operates as a bank in North America. The Company’s segments include Canadian Retail, U.S. Retail, Wholesale Banking and corporate. Canadian Retail segment serves customers in the Canadian personal and commercial banking, wealth, and insurance businesses. Personal Banking provides financial products and advice through its network of automated teller machines (ATM), telephone, digital and mobile banking. U.S. Retail comprises the Bank’s personal and business banking operations under the brand TD Bank and wealth management in the United States. Wholesale Banking offers a range of capital markets and corporate and investment banking services, including underwriting and distribution of new debt and equity issues, providing advice on strategic acquisitions and divestitures, and meeting the daily trading, funding, and investment needs of its clients.

TD is Canada’s second largest bank by market cap. Right behind Royal Bank.

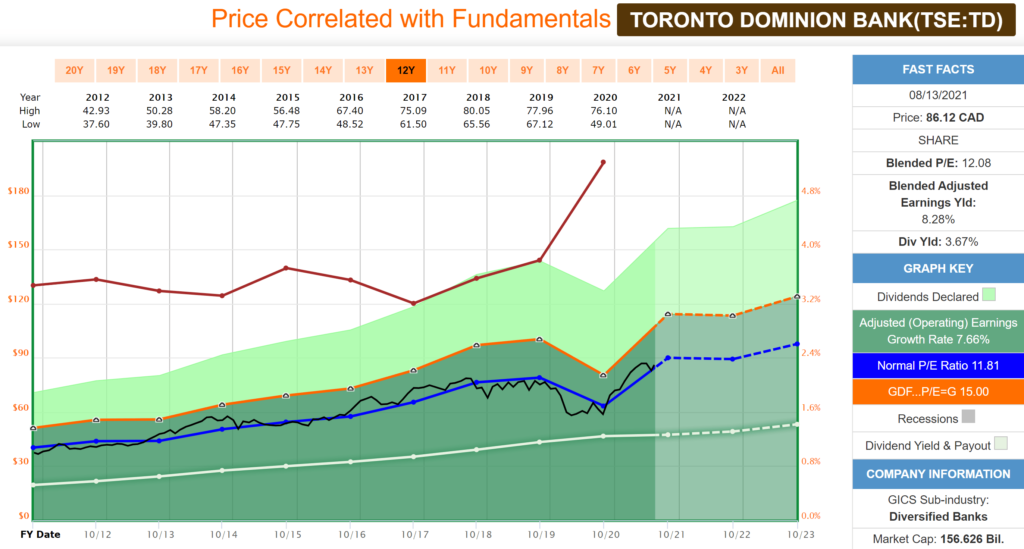
Historical Graph:

Performance Results
Source: FASTgraphs

Comments:

Toronto Dominion tracks its average P/E very closely. As you can see from the Blue Line on the graph (Average P/E) and the Black Line (Price), there is typically very little variance. Investment opportunities occur when the Black Line falls below the Blue Line with this quality dividend grower. It’s dividend yield (~3.7%) and payout ratio (~40%) are both close to their averages over time, which gives us some comfort with the safety of the dividend at the current price.

Performance Graph:

Price Correlated with Fundamentals
Source: FASTgraphs

Comments:

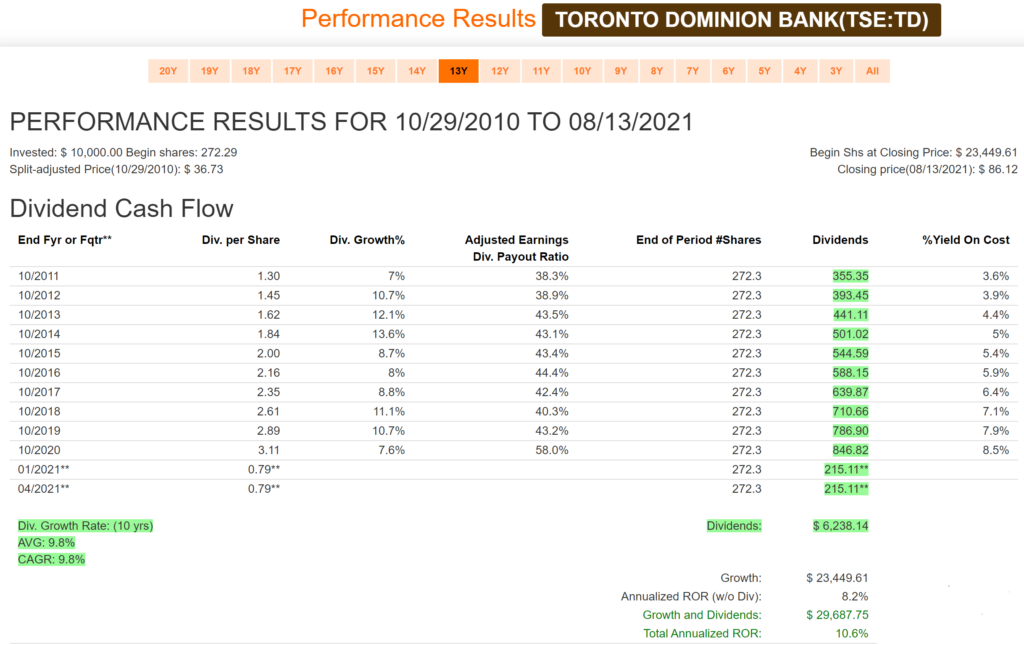
Toronto Dominion has the best dividend growth rate (9.8%/year) of all the big banks in Canada over the last decade. An above average starting yield with a good dividend growth rate means it doesn’t take long for your income to compound and grow. Cash flow is all important in what we do.

It is relevant to note that the dividend was frozen in 2020 by regulators and TD has yet to announce an increase in 2021.

Note:

Regulators in many regions imposed limits or bans on dividends near the onset of the Covid-19 pandemic, anticipating that the sudden drop in economic activity could lead to cascading loan defaults that would diminish banks’ capital. Canadian lenders, like their U.S. peers, took large provisions for potential losses in the early days of the crisis, but have now returned to higher profit levels.

The Office of the Superintendent of Financial Institutions is expected to lift those restrictions in the second half, which would result in significant dividend hikes at most Big Six banks, according to an analysis by Bloomberg Intelligence.

Source: Bloomberg

Estimated Earnings:

Forecast
Source: FASTgraphs

Comments:

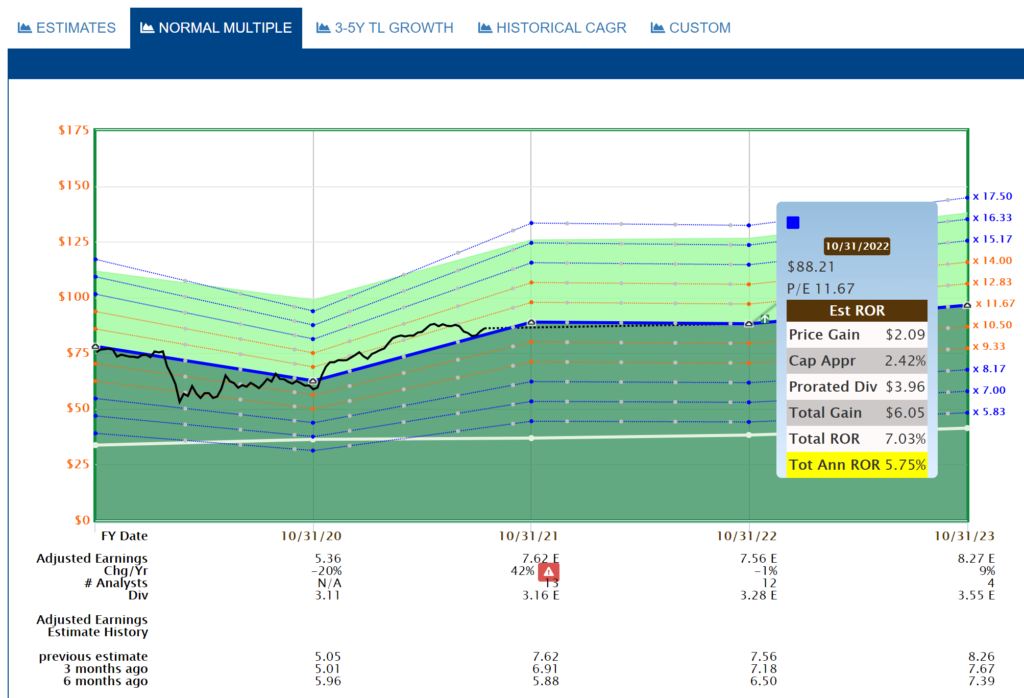
There are ~ twelve analysts covering Toronto Dominion in 2021/2022. Earnings in 2021 are expected to be up significantly over 2020 so this is a bit of an anomaly (Red Triangle). With most of the good news factored in already, analysts don’t see a lot of price appreciation out until the end of 2022.

Analyst Scorecard:

Analyst Scorecard
Source: FASTgraphs

Comments:

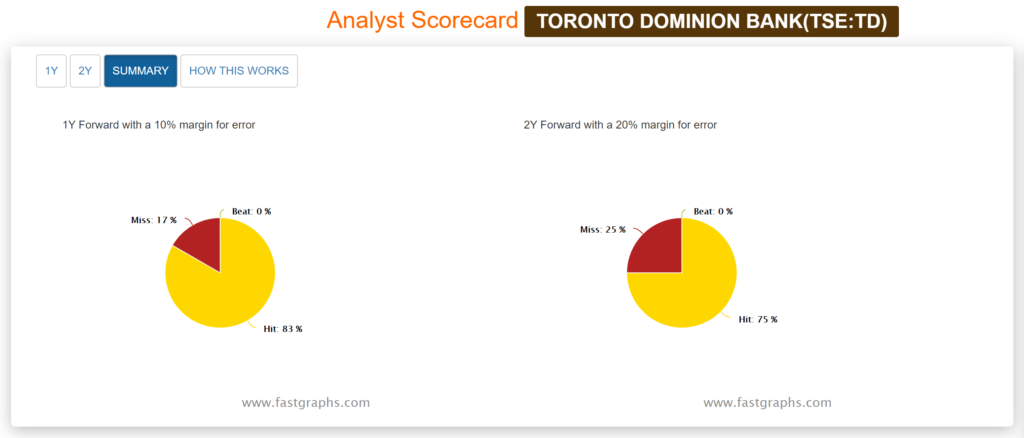
Analyst estimates over the years are quite accurate based on one and two-year earnings projections. Analysts projections have hit 83% of the time on one year estimates and 75% accuracy on two-year estimates.

Recent Earnings Report-Q2 2021:

Second Quarter Financial Highlights, compared with the second quarter last year:

Reported diluted earnings per share were $1.99, compared with $0.80.

Adjusted diluted earnings per share were $2.04, compared with $0.85.

Reported net income was $3,695 million, compared with $1,515 million.

Adjusted net income was $3,775 million, compared with $1,599 million.

Year-To-Date Financial Highlights, six months ended April 30, 2021, compared with the corresponding period last year:

Reported diluted earnings per share were $3.76, compared with $2.42.

Adjusted diluted earnings per share were $3.86, compared with $2.51.

Reported net income was $6,972 million, compared with $4,504 million.

Adjusted net income was $7,155 million, compared with $4,671 million.

“TD reported strong results in the second quarter, reflecting the underlying strength of our diversified businesses, improving economic conditions and our prudent approach to managing risk,” said Bharat Masrani, Group President and CEO, TD Bank Group. “We continued to invest in our people, capabilities and technology to position our business for growth as economies re-open and consumer and business activity recovers.”

“TD is strong and well-capitalized, and we continue to adapt and grow through this time of disruption. Our performance demonstrates the strength of our proven business model, brought to life through the efforts and resilience of our 90,000 colleagues across the globe who live our purpose and demonstrate a deep commitment to the Bank, those we serve, and the communities where we live and work,” concluded Masrani.

Summary:

The banks have been on fire in the last year with the sector up over 50% from their 2020 lows. Valuation is a bit ‘frothy’ compared to historical norms which limits short term upside on price appreciation. With that said, TD is one of the highest quality (Value Line Financial Rating of ‘A’) dividend growers in Canada with a stellar record of consecutive dividend payments.

“Valuations control long-term returns. The higher the price you pay today for each dollar you expect to receive in the future, the lower the long-term return you should expect from your investment.”

-John Hussman

Toronto Dominion reports it’s Q3 results on August 26, 2021 which will give us a better idea of when dividend increases will resume. 

Exchange Rate Hampers Fortis’ Q2 Results

Posted by JM on July 29, 2021 

Here is an excerpt from Fortis Inc.’s (FTS) recent quarterly earnings release July 29, 2021.

Earnings Report:

Q2 2021 Estimate: 0.59
Q2 2021 Actual: 0.55
Q3 2021 Estimate: 0.67

07:20 AM EDT, 07/29/2021 (MT Newswires) — Fortis Inc. (FTS.TO) edged down in U.S. premarket trading as it reported second-quarter adjusted basic EPS of C$0.55, down from C$0.56 in the year-ago period and missing the S&P Capital IQ consensus estimate for normalized EPS of C$0.59.

The electric and gas utility company recorded adjusted net earnings of C$259 million, compared with C$258 million in the second quarter of 2020. The company attributed the change to adjusted net earnings and EPS to strong operating growth, partially offset by negative foreign exchange impacts.

As-reported net earnings came in at C$253 million or C$0.54 per share, a decrease of C$21 million or C$0.05 per share in the same period a year ago, mainly due to a lower U.S.-to-Canadian dollar exchange rate and the lack of significant one-off items unlike the prior-year period.

Excluding the impact of foreign exchange and one-off items, net earnings rose by C$17 million or C$0.04 per share year over year, the company said.

Net earnings for the first half of 2021 reached C$608 million or C$1.30 per share, up from C$586 million or C$1.26 per share in the year-ago period.

Fortis said its long-term outlook remains unchanged and that lingering uncertainty due to the COVID-19 pandemic is not expected to have a material financial impact on the company in 2021.

Fortis also released an update to its sustainability efforts, saying it achieved a 15% annual reduction in Scope 1 emissions in 2020, equivalent to taking 400,000 vehicles off the road in a year.

The company also said its unit Tucson Electric Power now has approximately 1,000 megawatts of renewable energy on its system and can produce more than 25% of its energy from renewable sources.

Source: MT Newswires

Fortis Inc. (FTS) was one of our first purchases back in 2012 in our Canadian Magic Pants Portfolio. Fortis has increased its dividend every year for over four decades now, so it is one of the highest quality stocks we own. My mentor, Tom Connolly, has a word for stocks that perform like Fortis; ‘bondified’. After a decade or two, maybe sooner, stocks like Fortis offer an attractive alternative to fixed income instruments such as government bonds and can be counted as the fixed income portion of your portfolio. 

Another thing I like about Fortis is that management regularly communicates and delivers on its dividend growth guidance. Here is an excerpt from their most recent ‘Second Quarter 2021 Results’ document found on their website.

“Fortis expects long-term growth in rate base will support earnings growth and the annual dividend growth guidance of approximately 6% through 2025.”

Knowing that the dividend will grow over the next few years and by how much is comforting as an income investor and a show of confidence by management on where they feel the business is headed. Fortis is one of our quality dividend growers where historically, dividend growth and price growth have moved hand in hand.

As the dividend grows so does the price!

TFI International Acquisition Pays Off

Posted by JM on July 26, 2021 

Here is an excerpt from TFI International’s (TFII) recent quarterly earnings release July 26, 2021.

Earnings Report:

Q2 2021 Estimate: 0.96
Q2 2021 Actual: 1.44
Q3 2021 Estimate: 1.10

TFI International (TFII.TO) edged up in after-hours New York trading after the company on Monday said its second-quarter profit rose five-fold as revenue more than doubled following its acquisition of United Parcel Service’s (UPS) freight business, and topped analysts’ estimates for the measure by half.

Revenue rose to US$1.65 billion from US$740.1 million.

The gains follow on TFI’s US$800-million acquisition of the UPS Freight, truckload and less than truckload business at the end of April.

“The second quarter was historically significant for TFI International, with the closing of our UPS Freight acquisition and record performance across the board. With all four of our business segments reaching new heights, it is increasingly clear that our strategy to navigate the unprecedented events of the past year has created a platform for growth and profitability that is the strongest in our company’s history,” chief executive Alain Bedard said in a release.

TFI did not update its guidance in the release.

Source: MT Newswires

TFI International (TFII) first came across our radar a few years ago while I was still working in the tech services sector. They were acquiring trucking companies we supported and integrating them quickly onto their platform. Although we ended up losing a few customers because of them I was impressed at how quickly they acquired and integrated new acquisitions. Last year TFII reached the milestone of ten consecutive years of paying a growing dividend, so I decided to dig a little deeper into the fundamentals. Double digit annual earnings growth since 2011 and a Total Annual Return of 18.3% quickly caught my attention. I was shocked to discover that the company was also reasonably priced in the range of its historical P/E. Always looking for the next good Canadian dividend grower that is sensibly priced for our portfolios, I bought a starting position in September 2020. Today TFII is up significantly from our purchase price a year ago and still growing earnings and acquiring companies.

CNR Earnings Stay on Track

Posted by JM on July 20, 2021 

Here is an excerpt from Canadian National Railway’s (CNR) recent quarterly earnings release July 20, 2021.

Earnings Report:

Q2 2021 Estimate: 1.50
Q2 2021 Actual: 1.49
Q3 2021 Estimate: 1.56

Canadian National Railway (CNR.TO) on Tuesday said its second-quarter profit rose 90% on higher revenue and lower costs, as it offered little additional detail on its US$33.6-billion offer for the Kansas City Southern Railroad (KSU).

The railway said it earned C$1.03 billion, or C$1.46 per share, in the period, up from C$545 million, or C$0.77, in the second quarter of 2020, which included a C$486 million charge. Adjusted profit, which excludes most one-time items, rose 17% to C$1.06 billion, or C$1.49, just topping the average analyst estimate for the measure of C$1.48 per share, according to Capital IQ.

Revenue rose 12% to C$3.6 billion, while the company’s operating ratio, an efficiency measure where lower is better, dropped to 61.6% from 75.5%, or 61.6% from 60.4% on an adjusted basis.

The company said the rise in its profit came as freight volumes continue to improve from pandemic lows, as revenue-traffic miles rose by 13%.

Canadian National did not offer any additional detail on offer for Kansas City Southern Railroad, which is awaiting regulatory approval from the U.S. Surface Transportation Board. The offer topped a bid from rival Canadian Pacific Railway (CP.TO).

“We enter the second half of 2021 focused on executing for our customers and leveraging our strong network performance to safely and sustainably drive long-term value creation for all of our stakeholders. Our proposed combination with Kansas City Southern has received overwhelming support from a broad base of stakeholders because it will enhance competition and drive economic growth in North America. We are confident in our ability to obtain the necessary approvals and successfully close this pro-competitive combination,” chief executive J.J. Ruest said in a release.

The railway also reiterated 2021 guidance for double-digit growth in its earnings per shares.

Canadian National shares closed up C$0.54 to C$129.79 on the Toronto Stock Exchange.

Source: MT Newswires

CNR is as good as it gets when it comes to quality dividend growers in Canada. With a dividend growth streak of 25 years, Value Line Safety Rating of 1, Value Line Financial Rating of ‘A’ and a S&P Rating of    ‘A ‘, only the largest Canadian Banks are rated higher. The trouble with CNR is purchasing it at a sensible price. We will be monitoring this company closely should any issues with the merger with Kansas City Southern provide a buying opportunity for our Magic Pants Canadian Portfolio.

‘The List’ – Portfolio Review (July 2021)

Posted by BM on July 7, 2021

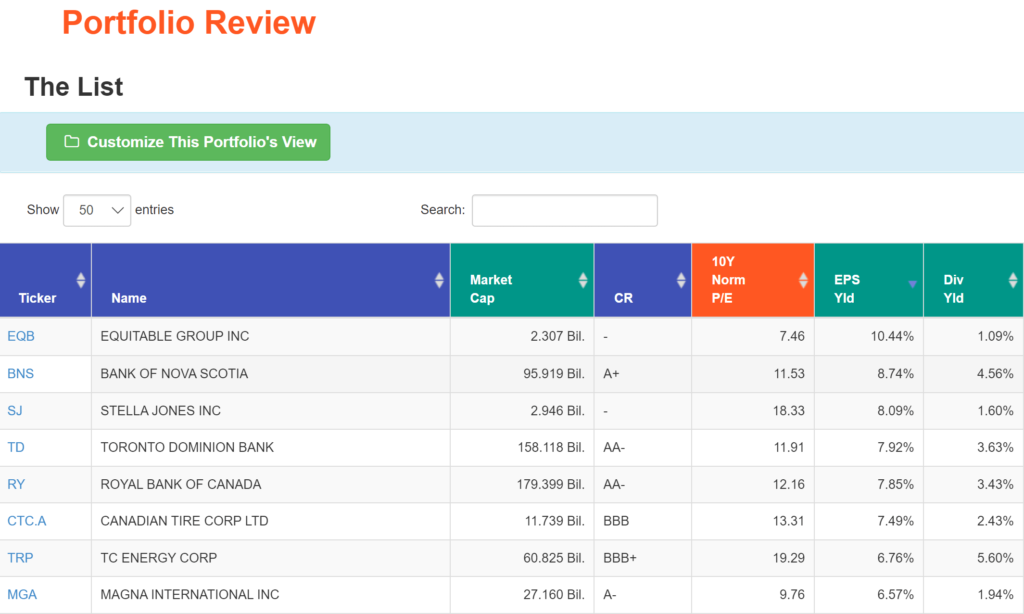
Each month I will walk through our valuation process using a stock on ‘The List’ that meets our minimum screen of 6.5% EPS Yld. This month it is Stella Jones (SJ-T).

Valuation is the second step in our three-step process. Buying when our quality stocks are sensibly priced will help ensure our future investment returns meet our expectations. We rely heavily on the fundamental analyzer software tool (FASTgraphs) to help us understand the fundamentals of the stocks we invest in and then read the company’s website for investor presentations and recent earnings reports to learn more.

SJ Portfolio

Intro:

Stella-Jones Inc. is a Canada-based company that is focused on producing industrial pressure-treated wood products. The Company operates through two segments: pressure-treated wood and logs and lumber. The pressure-treated wood segment includes railway ties, utility poles, residential lumber and industrial products. The logs and lumber segment comprise of the sales of logs harvested in the course of the Company’s procurement process that are determined to be unsuitable for use as utility poles. Also included in this segment is the sale of excess lumber to local home-building markets. Its Operating plants are located in approximately six Canadian provinces and nineteen American states. The Company also operates a distribution network across North America. The Company also provides customized services, such as pre-plating, pre-boring, railway crossing panels, end-plating and bridge timbers to specification.

Historical Graph:

SJ Historical
Source: FASTgraphs

Comments:

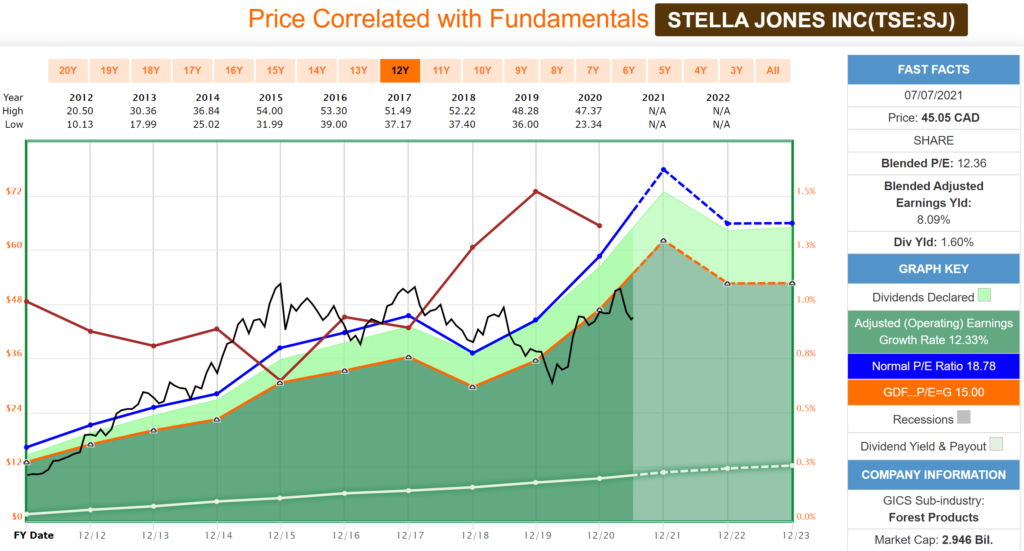
Stella Jones typically trades in a ‘valuation corridor’ between a 15 and 20 P/E. Investment opportunities when the price (Black Line) is under the 15 P/E line (Orange Line), where it is now, are rare. The Red Line is the dividend yield and we can see that Stella Jones is currently offering one of its highest starting yields in a decade. The low payout ratio signified by the White Line is quite low as well which gives us some comfort knowing our dividend is safe from any short-term market pressures.

Performance Graph:

SJ Performance
Source: FASTgraphs

Comments:

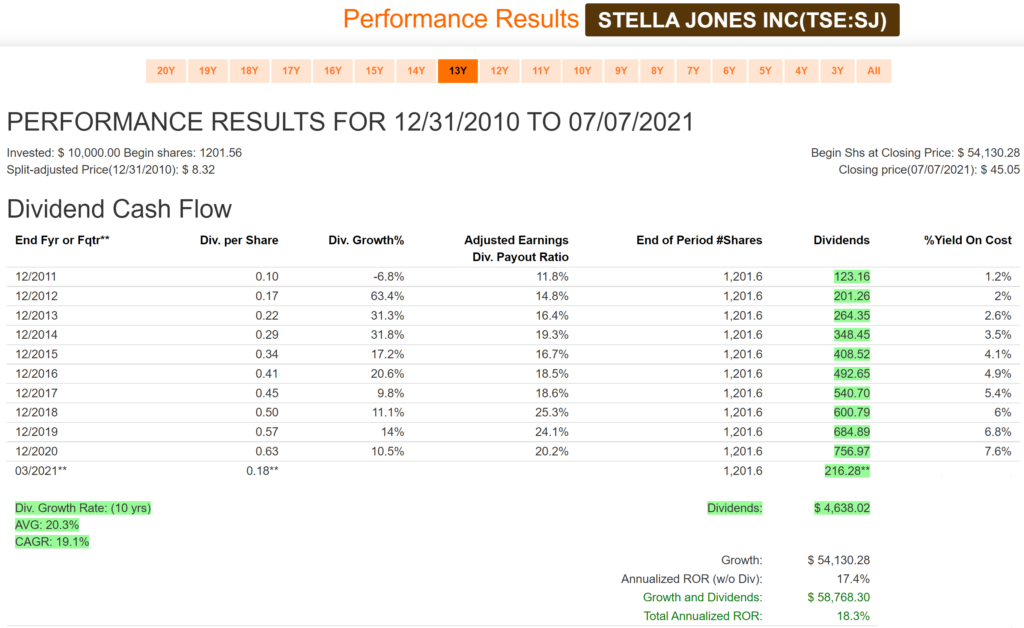
Stella Jones has an excellent dividend growth record averaging over 20% per year over the last ten years. Although the starting yield is low you can see how quickly your yield on cost can grow and provide you with growing income. The annualized rate of return (ROR) of 18.3% is excellent as well and seems to align nicely with dividend growth. Another example of ‘as the dividend grows so does the price’.

Estimated Earnings:

SJ 2YR Estimate
Source: FASTgraphs

Comments:

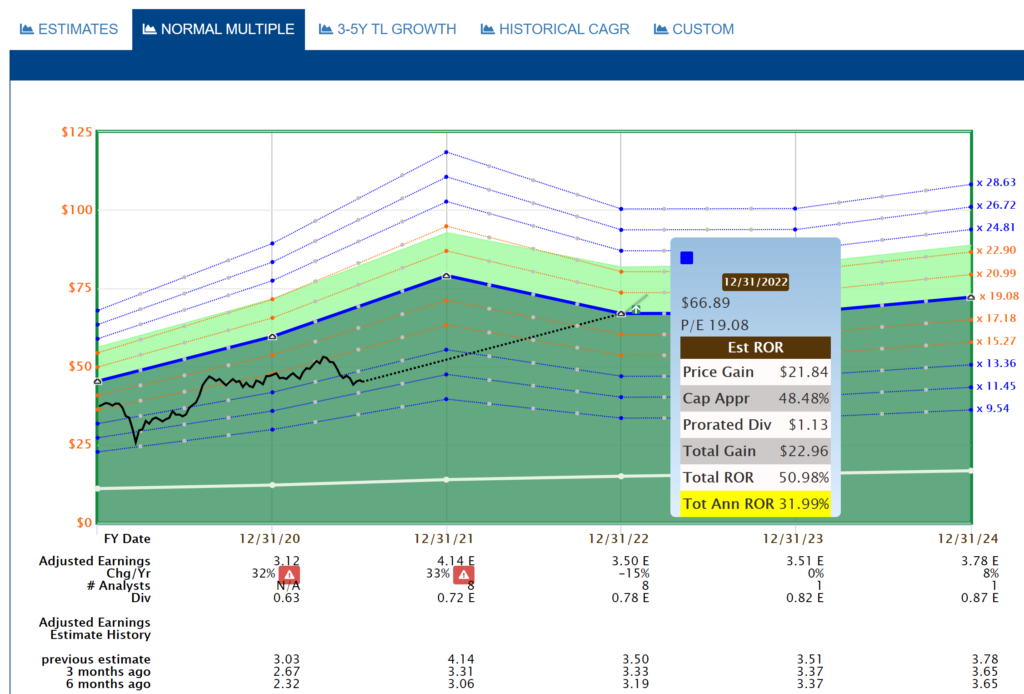
There are eight analysts covering Stella Jones and the earnings estimates are being revised upwards from both three months and six months ago. This is a positive sign. When we project out to the end of 2022 you can see analysts are expecting an annual return of 31.99% on a purchase at today’s price.

Analyst Scorecard:

SJ Analyst Scorecard
Source: FASTgraphs

Comments:

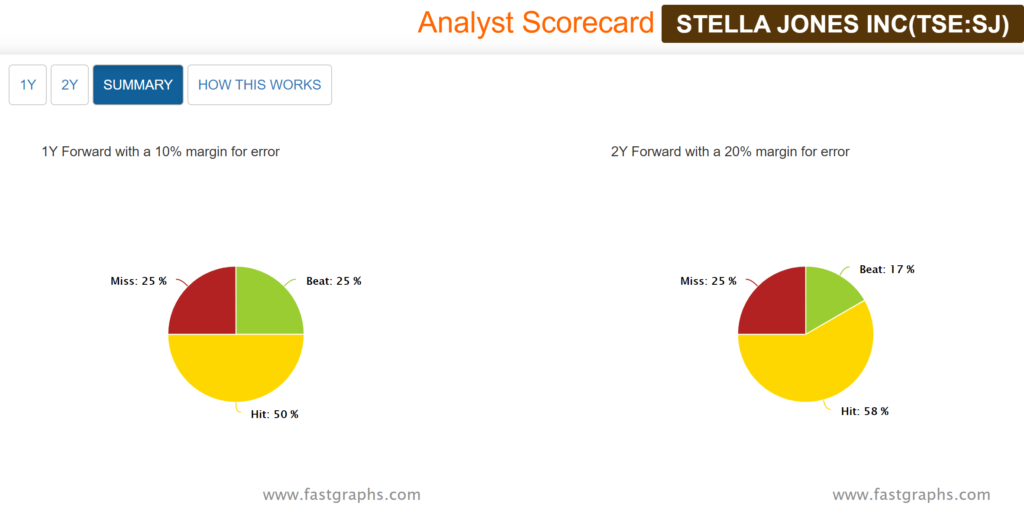
Analyst estimates over the years are quite accurate based on one and two-year earnings projections. Analysts projections have either hit or beat 75% of the time on one and two-year estimates.

Recent Earnings Report-Q1 2021:

Montreal, Quebec – May 3, 2021 – Stella-Jones Inc. (TSX: SJ) (“Stella-Jones” or the “Company”) today announced financial results for its first quarter ended March 31, 2021.

  • Sales increased 23% to a first quarter record of $623 million
  • EBITDA rose 57% to $99 million, or a margin of 15.9%
  • Net income doubled to reach $56 million or $0.85 per share
  • Solid financial position with a net debt-to-EBITDA ratio of 2.2x
  • Annual 2021 EBITDA guidance raised to $450 to $480 million
  • Entered into a new senior unsecured credit agreement of up to US$350 million, subsequent to quarter-end

“We had an exceptionally robust start to the year, continuing our momentum of growth. Our first quarter performance was fueled by record pricing and volume gains in the residential lumber product category, solid utility poles results, and strong railway ties demand tempered by pricing pressures in certain markets. EBITDA grew by 57% to an all-time first quarter high of $99 million and net income doubled to $56 million compared to the same period last year,” stated Éric Vachon, President and CEO of Stella-Jones.

“In anticipation of continued strong market conditions for residential lumber and solid demand in the other core product categories, we leveraged our healthy balance sheet this quarter to increase working capital and invest in our network. In April, we increased our available liquidity with a new senior unsecured credit facility, further enhancing our financial flexibility. Together with our resilient business model and solid competitive position, we are well positioned to take advantage of the momentum in demand, create opportunities to grow our core businesses and deliver EBITDA in the mid-to-high $400 million range in 2021,” concluded Mr. Vachon.

Updated Outlook

The Company’s financial outlook provided in the MD&A for the year ended December 31, 2020 is updated to reflect the strong quarterly performance, largely attributable to the unprecedented rise in the market price of lumber, and the expectation that the higher levels of pricing for lumber will continue to favorably impact the profitability of the residential lumber product category during the seasonal peak demand period.

Stella-Jones is now targeting to deliver EBITDA in the range of $450 to $480 million in 2021, up from the previously disclosed guidance of $385 to $410 million. This updated guidance anticipates a reduction of approximately $90 million in sales from the depreciation of the value of the U.S. dollar relative to the Canadian dollar to C$1.27 per U.S. dollar.

Excluding the impact of the currency conversion, the Company is projecting 2021 sales growth of 15% to low 20% range compared to 2020. The projected 2021 sales for utility poles, railways ties and industrial products remain unchanged. Utility poles sales are expected to increase in the mid to high-single digit range compared to 2020, due to sustained healthy replacement demand, including an increase in value-added fire-resistant wrapped pole sales, while railway ties and industrial product sales are projected to be relatively comparable to those generated in 2020. For residential lumber, sales are now forecasted to increase in the range of 45% to 65% compared to 2020, driven by the current trend of higher pricing, which is projected to continue during the seasonal peak demand period for this product category.

Summary:

There is a lot to like about Stella Jones right now from a valuation standpoint. Definitely a company dividend growth investors should be paying close attention to given its recent price weakness.

Couche-Tard Breezes Past Estimates

Posted by JM on June 29, 2021 

Here is an excerpt from Alimentation Couche-Tard’s (ATD-B) recent quarterly earnings release June 29, 2021.

June 29 (Reuters) – Canada’s Alimentation Couche-Tard Inc breezed past estimates for quarterly profit and revenue on Tuesday, helped by strong sales at the convenience store chain’s fuel supply outlets following speedy vaccination drives and easing coronavirus curbs.

Revenue from its fuel business, which includes about 10,800 outlets across the United States, Europe and other countries, jumped 32% to $8.35 billion in the fourth quarter after falling by more than a third in the first three quarters.

“We had a steady improvement in parts of the network, especially in the United States, where we are starting to see a return to more normal driving behavior,” Chief Executive Officer Brian Hannasch said in a statement.

Couche-Tard’s results mirror that of U.S. peer Casey’s General Stores Inc, which reported growth in its fuel division earlier this month.

Fuel volumes, however, were still below pre-pandemic levels due to work-from-home policies and renewed restrictions in some regions including Ontario and Quebec, Couche-Tard said.

The Canadian company’s revenue from merchandise and services rose 15.2% to $3.72 billion, boosted by its move to sell fast-food items such as sandwiches, hot dogs and snacks at more stores.

Total revenue rose 26.3% to $12.24 billion in the fourth quarter ended April 25, exceeding analysts’ average estimate of $11.65 billion, according to Refinitiv-IBES data.

On an adjusted basis, Couche-Tard earned 52 cents per share, well above an estimate of 42 cents.

Early in 2021 Couche-Tard announced that they were trying to merge with French grocer Carrefour and the stock price declines on the news. As we monitor all the quality dividend growth stocks on ‘The List’ as part of our process, this event naturally caught our attention. We had been waiting to initiate a starting position in ATD-B for quite some time, but it had never been sensibly priced according to our valuation process. After reading managements reasons for the merger and reviewing the success of past acquisitions/mergers by the company, we felt comfortable in purchasing an initial position in our Canadian Magic Pants Portfolio. The proposed merger was opposed by the French government and the bid was eventually dropped by Couche-Tard. The share-price has since rebounded nicely.

The situation with Couch-Tard is no different from what happens all the time in the world of investing. A good quality company’s stock price comes under pressure due to some narrative and the price goes down. Having a process gives you the confidence to look closer at the fundamentals and decide if this weakness in price is likely to continue or be short term in nature. After this earnings release, ATD-B is now up ~25% from its January lows.

We buy quality individual dividend growth stocks when they are sensibly priced and hold for the growing income.