MP Market Review – April 25, 2025
Last updated by BM on April 29, 2025
Summary
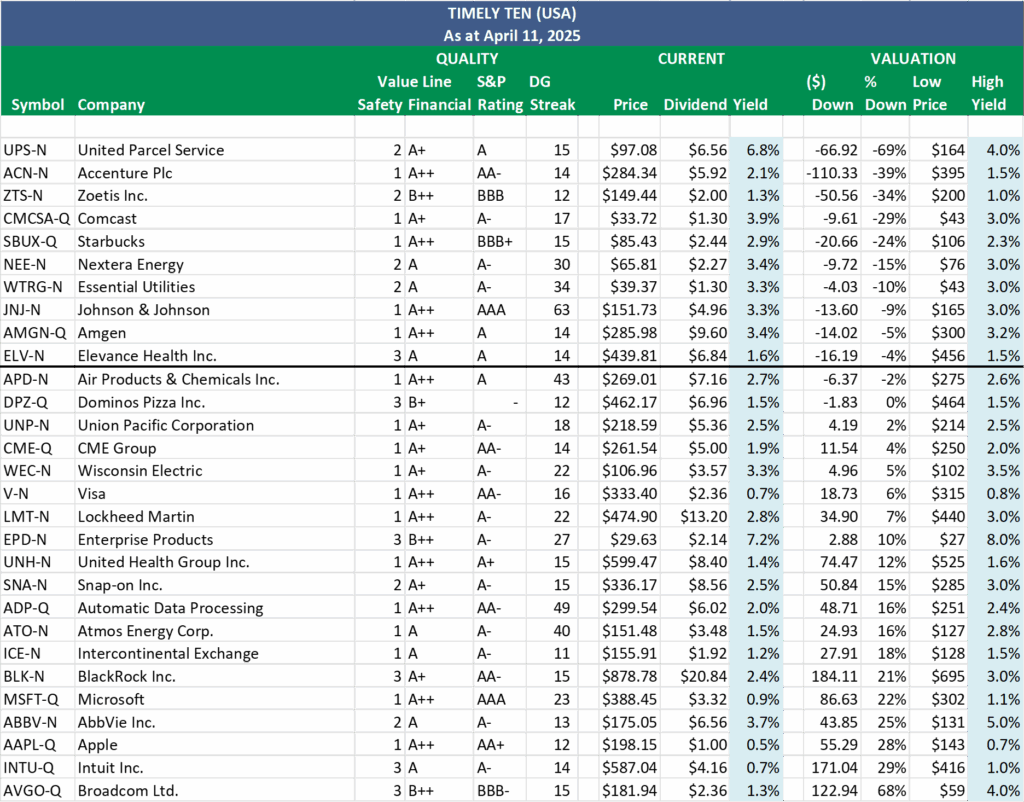
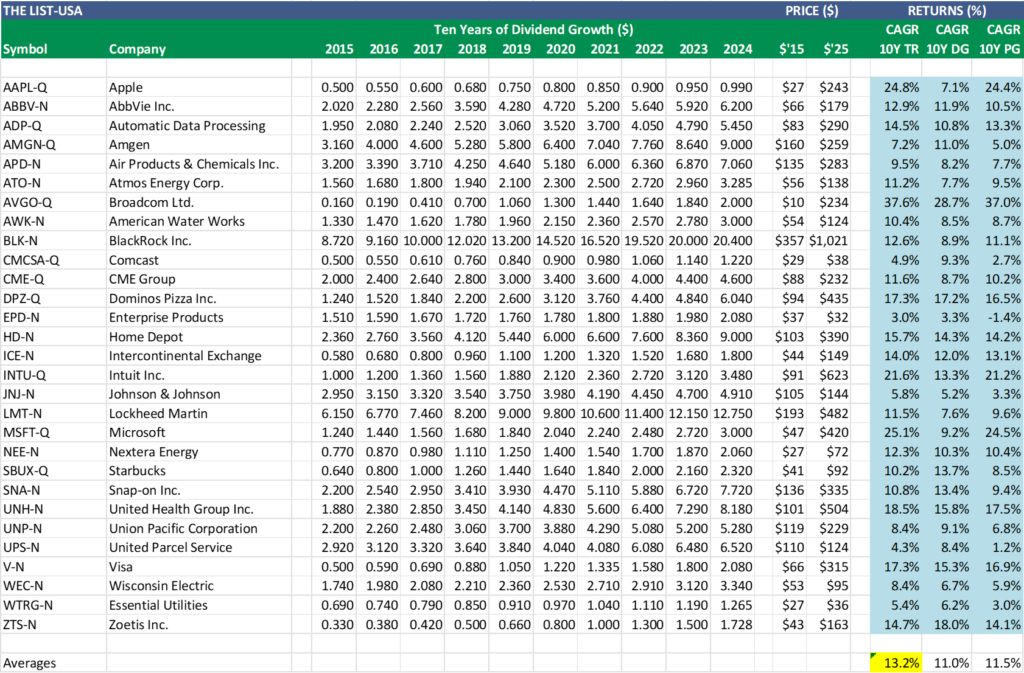
Welcome to this week’s MP Market Review – your go-to source for insights and updates on the Canadian dividend growth companies we track on ‘The List’! While we’ve expanded our watchlists to include U.S. companies (The List-USA), our Canadian lineup remains the cornerstone of our coaching approach.
Don’t miss out on exclusive newsletters and premium content that will help you sharpen your investing strategy. Explore it all at magicpants.substack.com.
Your journey to dividend growth mastery starts here – let’s dive in!
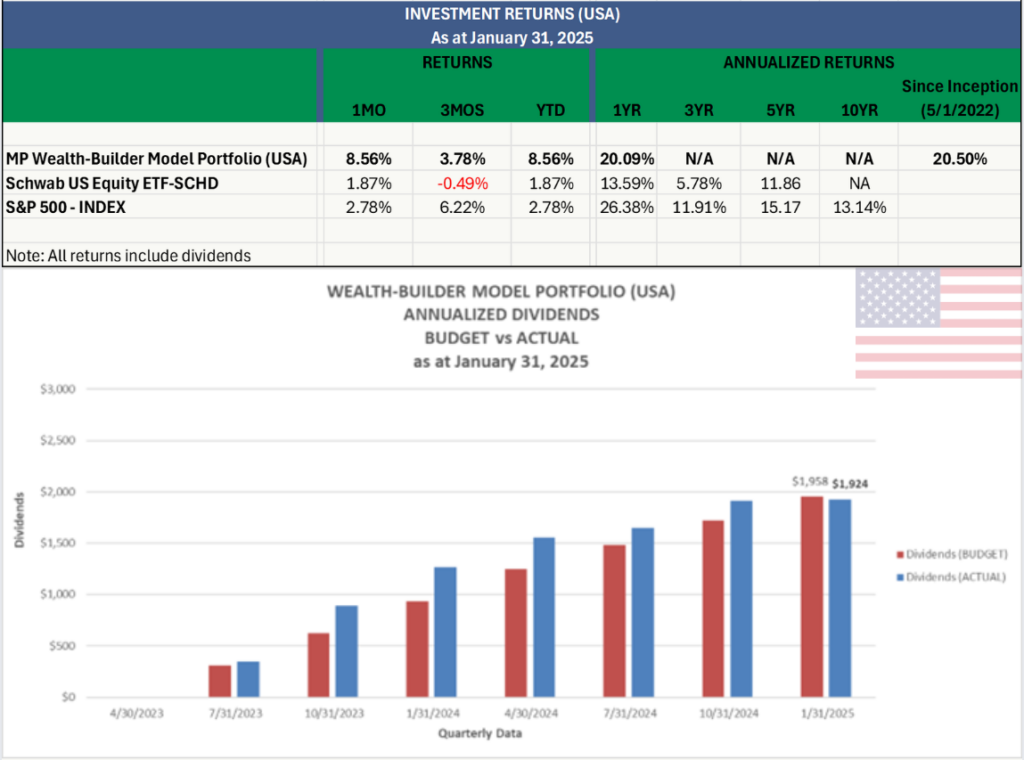
- Last week, dividend growth stayed the same, with an average return of +7.5% YTD (income).
- Last week, the price of ‘The List’ was up from the previous week with an average return of +2.17% YTD (capital).
- Last week, there were no dividend announcements from companies on ‘The List’.
- Last week, there were two earnings reports from companies on ‘The List’.
- This week, seven companies on ‘The List’ will report on earnings.
DGI Clipboard
“Usually, a very long list of securities is not a sign of a brilliant investor but one who is not sure of himself.”
– Philip Fisher
Investing Simplified: Meet Our ‘No-Look’ DGI Portfolio!

Intro
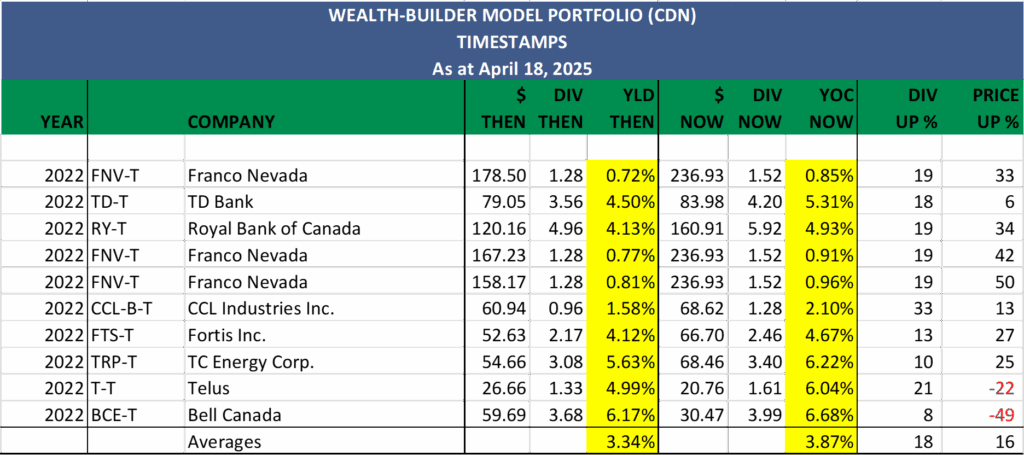
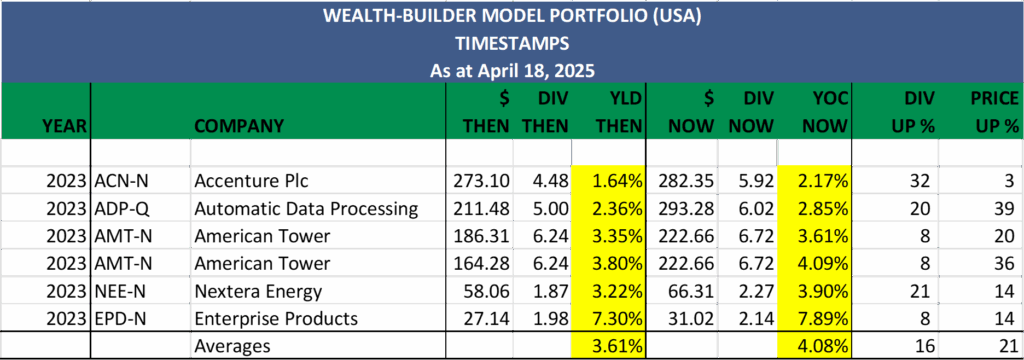
New retirees and novice investors often seek straightforward guidance when making investment choices. To meet this need, we provide a clear and accessible DGI model portfolio featuring precise buy/sell alerts and detailed valuation analyses for every transaction. Our structured approach allows investors to comfortably familiarize themselves with our Dividend Growth Investing (DGI) strategy, gradually building their portfolios alongside ours.
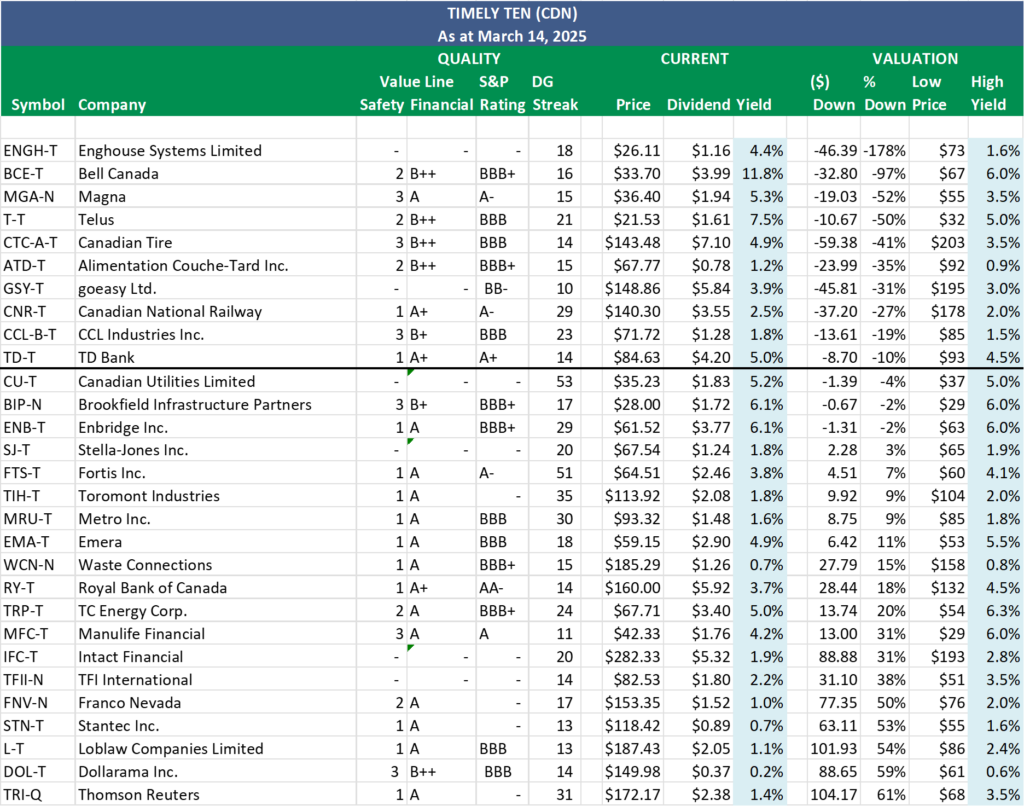
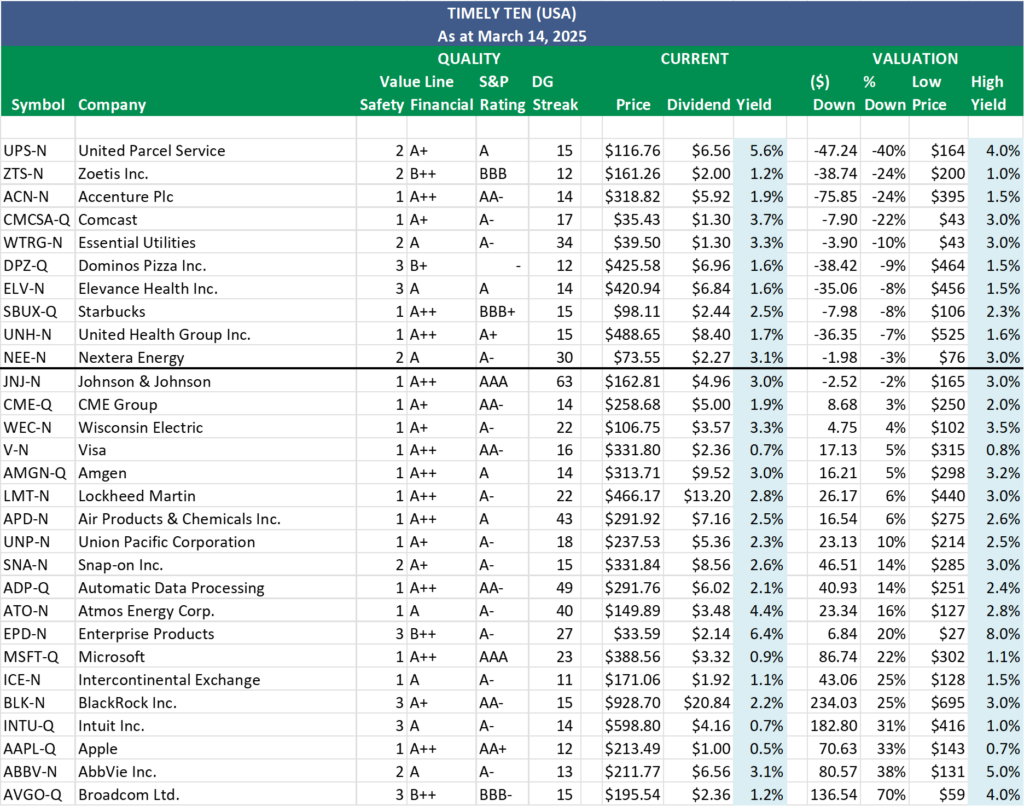
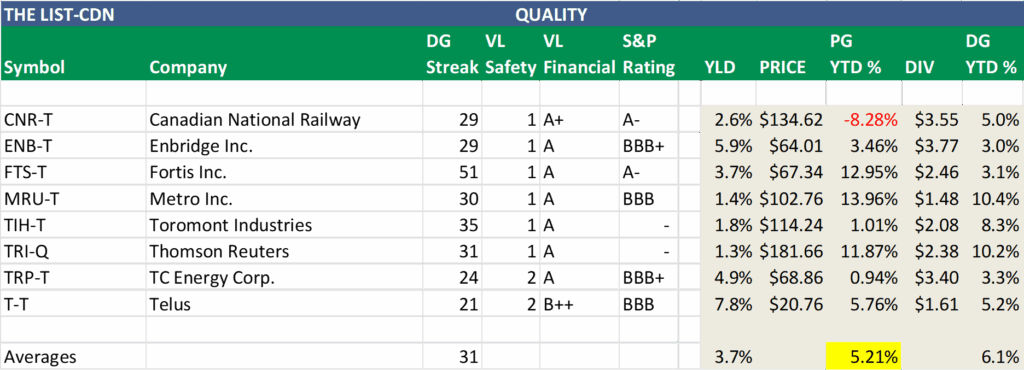
For investors who prefer to invest a lump sum immediately, we offer the ‘No-Look’ DGI Portfolio. Inspired by the sports concept of a ‘no-look’ pass—where an athlete instinctively passes to a teammate without needing to look—this strategy simplifies the investing process. Instead of waiting for individual stocks to become sensibly priced according to our valuation metrics, investors select a single date to equally invest in the highest-rated companies from our curated list, based on reputable third-party quality ratings from Value Line and S&P.
The Value Line ratings are based on the rating services’ proprietary ranking system, which evaluates stocks on various factors, including financial strength, earnings potential, and risk. S&P ratings assess the creditworthiness of entities such as corporations, governments, and other issuers of debt. The better the ratings, the higher the quality of the company.
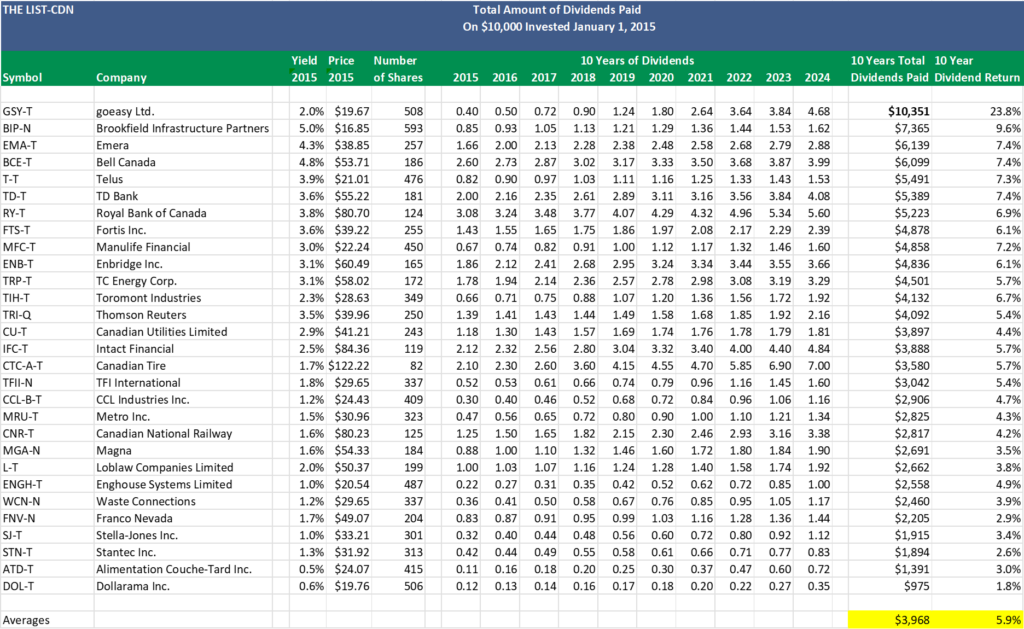
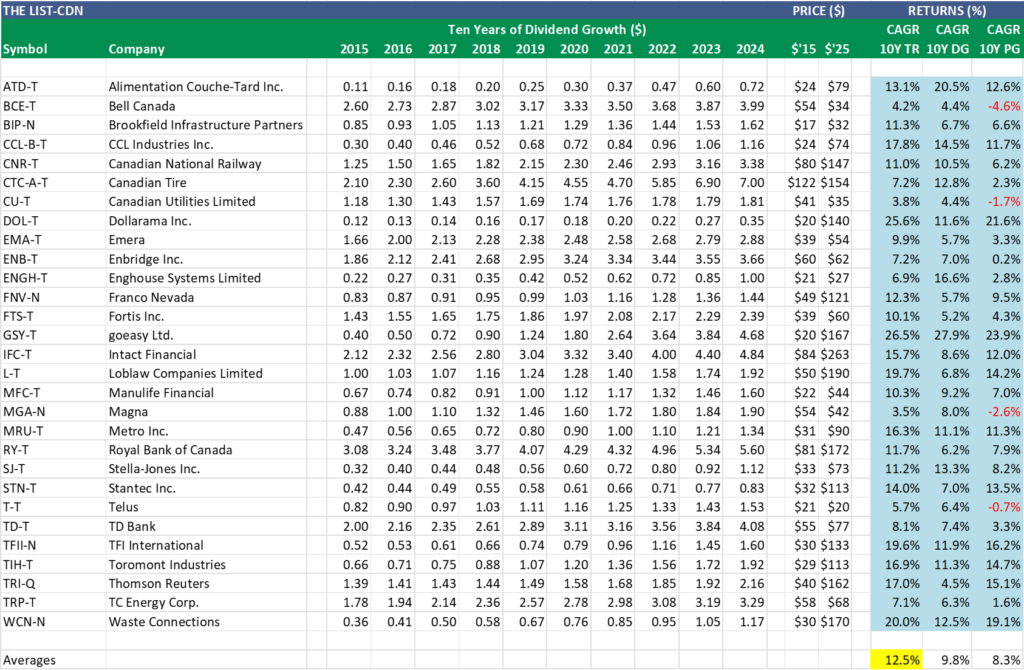
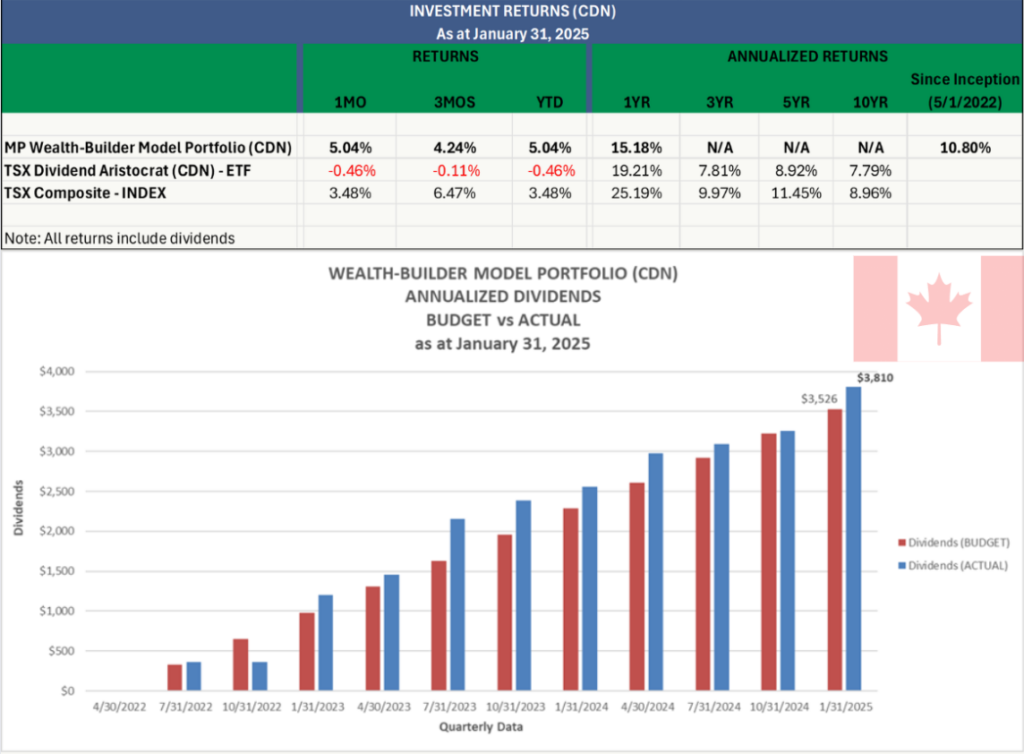
This approach eliminates guesswork, detailed analysis, and timing concerns, focusing instead on the inherent quality of established dividend-growing companies. Here’s a look at how our ‘No-Look’ DGI Portfolio of the top 20 DGI stocks in Canada has performed year-to-date relative to our broader list of dividend growers and tracked indexes.
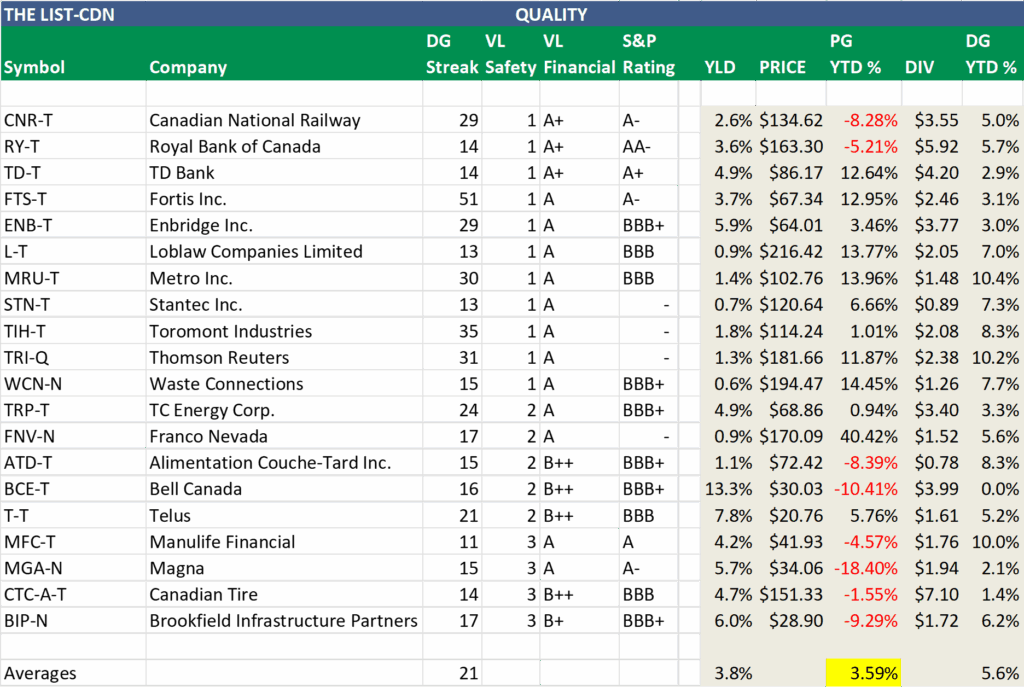
Investors who further refine their choices to include only companies with a minimum twenty-year record of consistent dividend growth have achieved even stronger results.
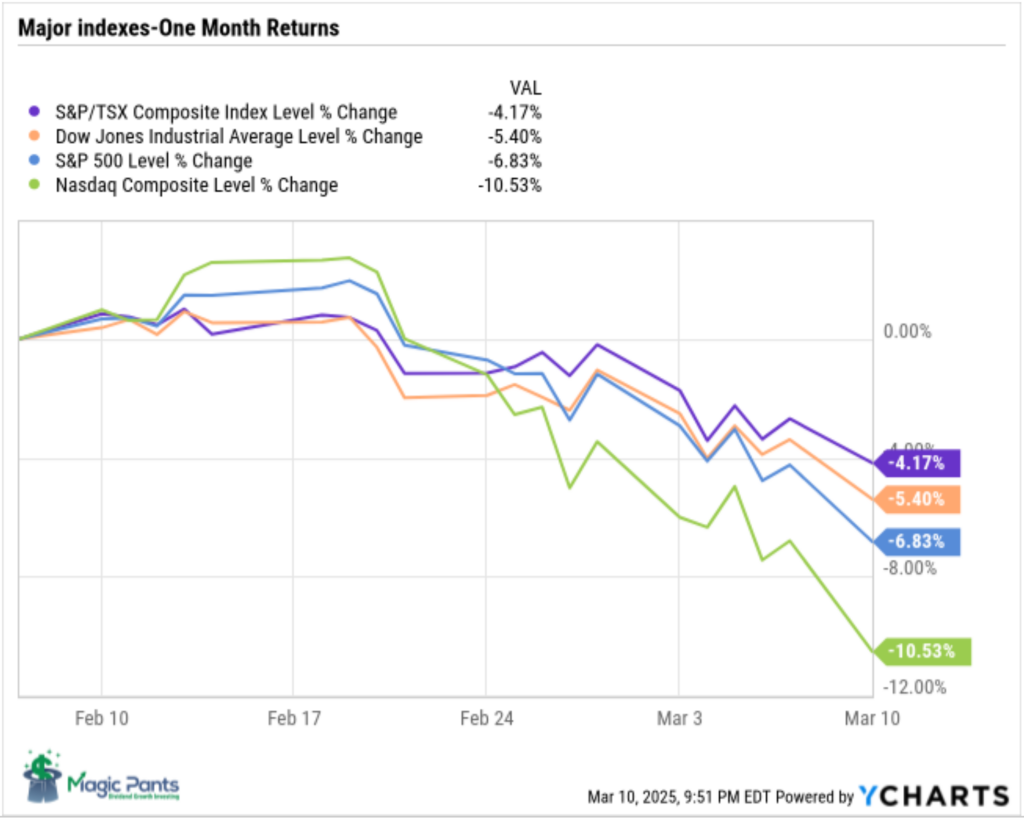
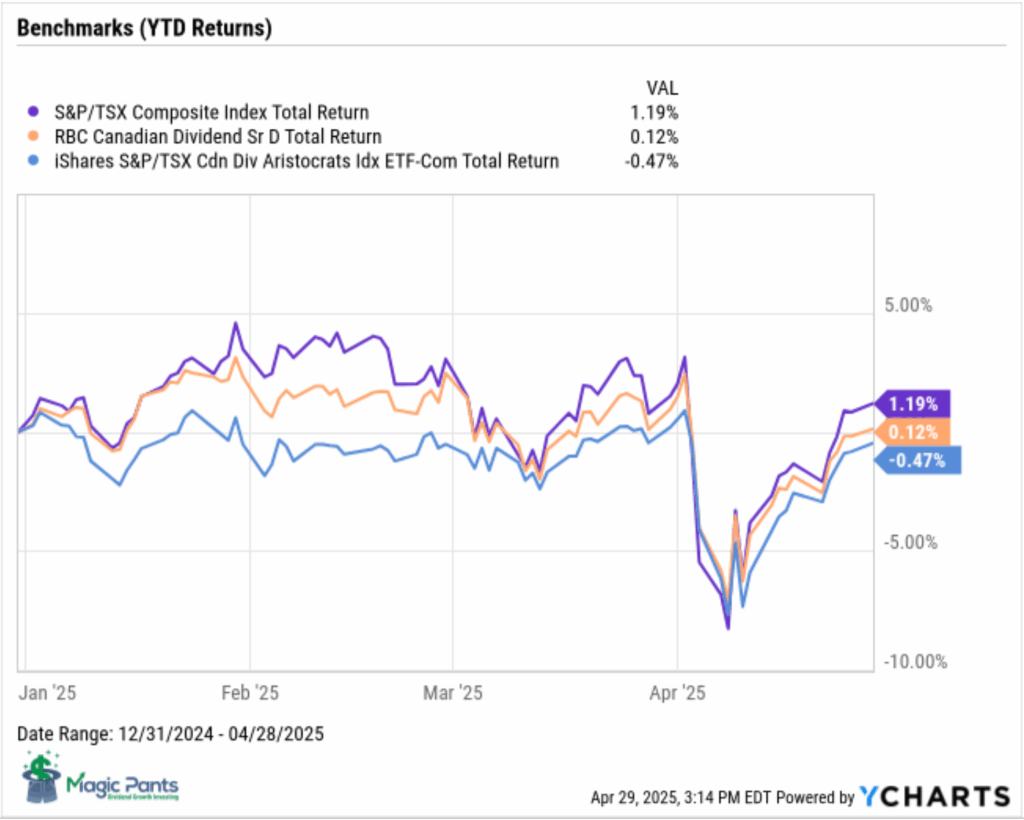
Compare these returns to the Canadian benchmarks (the ones investment advisors try to keep pace with).
Wrap Up
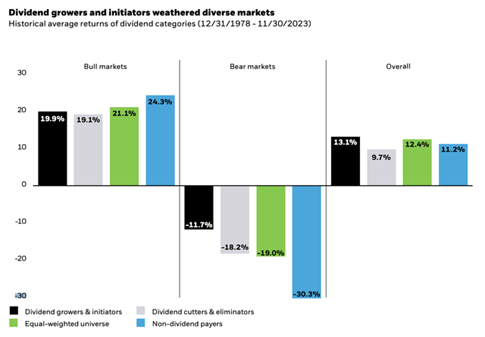
Quality consistently outperforms in volatile and uncertain markets, which is why selecting high-quality companies is the first step to our DGI strategy.
Join as a paying subscriber to gain full access to this post and exclusive, subscriber-only content. Plus, get real-time DGI alerts from our model signaling service whenever we make trades in our portfolios. We do the work; you stay in control. Subscribe today and take your dividend growth investing to the next level.
DGI Scorecard
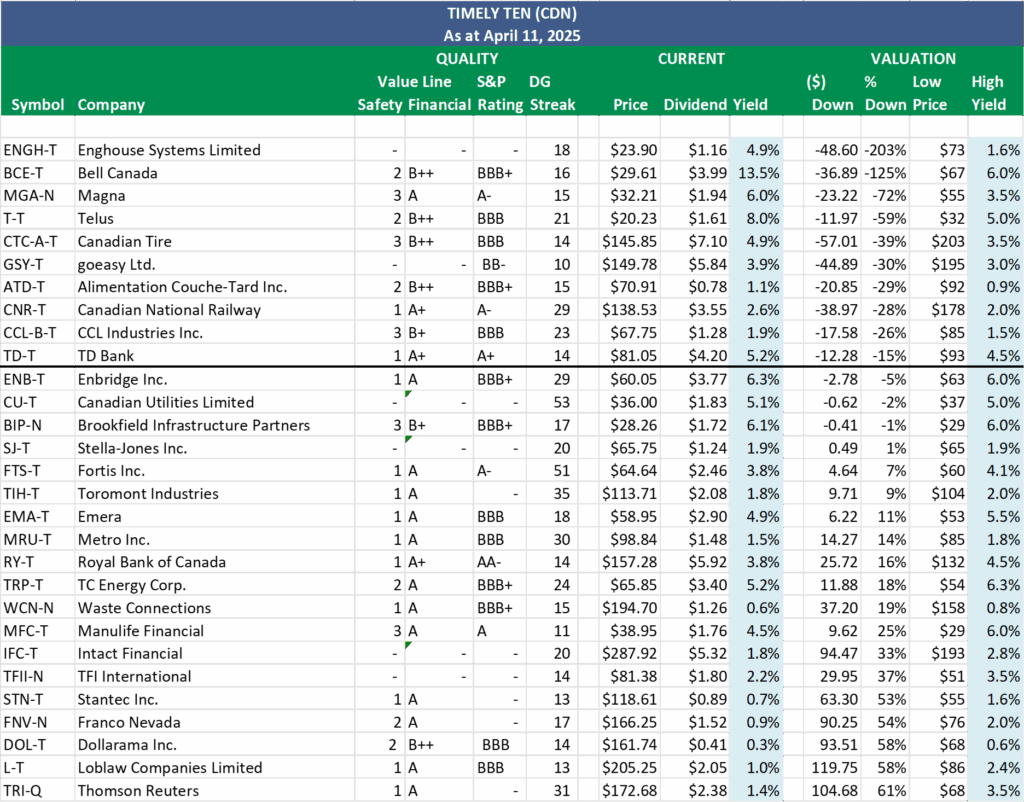
The List (2025)
The Magic Pants 2025 list includes 29 Canadian dividend growth stocks. Here are the criteria to be considered a candidate on ‘The List’:
- Dividend growth streak: 10 years or more.
- Market cap: Minimum one billion dollars.
- Diversification: Limit of five companies per sector, preferably two per industry.
- Cyclicality: Exclude REITs and pure-play energy companies due to high cyclicality.
Based on these criteria, companies are added or removed from ‘The List’ annually on January 1. Prices and dividends are updated weekly.
‘The List’ is not a portfolio but a coaching tool that helps us think about ideas and risk manage our model portfolio. We own some but not all the companies on ‘The List’. In other words, we might want to buy these companies when valuation looks attractive.
Our newsletter provides readers with a comprehensive insight into the implementation and advantages of our Canadian dividend growth investing strategy. This evidence-based, unbiased approach empowers DIY investors to outperform both actively managed dividend funds and passively managed indexes and dividend ETFs over longer-term horizons.
Performance of ‘The List’
Last week, dividend growth stayed the same, with an average return of +7.5% YTD (income).
The price of ‘The List’ was up from the previous week, with an average YTD return of +2.17% (capital).
Even though prices may fluctuate, the dependable growth in our income does not. Stay the course. You will be happy you did.
Last week’s best performers on ‘The List’ were Manulife Financial (MFC-T), up +5.75%; Magna (MGA-N), up +5.61%; and Brookfield Infrastructure Partners (BIP-N), up +3.58%.
Canadian National Railway (CNR-T) was the worst performer last week, down -1.96%.
| SYMBOL | COMPANY | YLD | PRICE | YTD % | DIV | YTD % | STREAK |
|---|---|---|---|---|---|---|---|
| ATD-T | Alimentation Couche-Tard Inc. | 1.1% | $72.42 | -8.39% | $0.78 | 8.3% | 15 |
| BCE-T | Bell Canada | 13.3% | $30.03 | -10.41% | $3.99 | 0.0% | 16 |
| BIP-N | Brookfield Infrastructure Partners | 6.0% | $28.90 | -9.29% | $1.72 | 6.2% | 17 |
| CCL-B-T | CCL Industries Inc. | 1.8% | $70.16 | -4.70% | $1.28 | 10.3% | 23 |
| CNR-T | Canadian National Railway | 2.6% | $134.62 | -8.28% | $3.55 | 5.0% | 29 |
| CTC-A-T | Canadian Tire | 4.7% | $151.33 | -1.55% | $7.10 | 1.4% | 14 |
| CU-T | Canadian Utilities Limited | 4.9% | $37.74 | 8.51% | $1.83 | 1.0% | 53 |
| DOL-T | Dollarama Inc. | 0.2% | $170.99 | 21.96% | $0.41 | 18.1% | 14 |
| EMA-T | Emera | 4.7% | $61.41 | 14.72% | $2.90 | 0.7% | 18 |
| ENB-T | Enbridge Inc. | 5.9% | $64.01 | 3.46% | $3.77 | 3.0% | 29 |
| ENGH-T | Enghouse Systems Limited | 4.7% | $24.85 | -8.17% | $1.16 | 16.0% | 18 |
| FNV-N | Franco Nevada | 0.9% | $170.09 | 40.42% | $1.52 | 5.6% | 17 |
| FTS-T | Fortis Inc. | 3.7% | $67.34 | 12.95% | $2.46 | 3.1% | 51 |
| GSY-T | goeasy Ltd. | 3.7% | $155.80 | -6.80% | $5.84 | 24.8% | 10 |
| IFC-T | Intact Financial | 1.8% | $296.91 | 12.91% | $5.32 | 9.9% | 20 |
| L-T | Loblaw Companies Limited | 0.9% | $216.42 | 13.77% | $2.05 | 7.0% | 13 |
| MFC-T | Manulife Financial | 4.2% | $41.93 | -4.57% | $1.76 | 10.0% | 11 |
| MGA-N | Magna | 5.7% | $34.06 | -18.40% | $1.94 | 2.1% | 15 |
| MRU-T | Metro Inc. | 1.4% | $102.76 | 13.96% | $1.48 | 10.4% | 30 |
| RY-T | Royal Bank of Canada | 3.6% | $163.30 | -5.21% | $5.92 | 5.7% | 14 |
| SJ-T | Stella-Jones Inc. | 1.8% | $67.43 | -7.62% | $1.24 | 10.7% | 20 |
| STN-T | Stantec Inc. | 0.7% | $120.64 | 6.66% | $0.89 | 7.3% | 13 |
| T-T | Telus | 7.8% | $20.76 | 5.76% | $1.61 | 5.2% | 21 |
| TD-T | TD Bank | 4.9% | $86.17 | 12.64% | $4.20 | 2.9% | 14 |
| TFII-N | TFI International | 2.3% | $79.84 | -39.79% | $1.80 | 12.5% | 14 |
| TIH-T | Toromont Industries | 1.8% | $114.24 | 1.01% | $2.08 | 8.3% | 35 |
| TRI-Q | Thomson Reuters | 1.3% | $181.66 | 11.87% | $2.38 | 10.2% | 31 |
| TRP-T | TC Energy Corp. | 4.9% | $68.86 | 0.94% | $3.40 | 3.3% | 24 |
| WCN-N | Waste Connections | 0.6% | $194.47 | 14.45% | $1.26 | 7.7% | 15 |
| Averages | 3.5% | 2.17% | 7.5% | 21 |
Note: Stocks ending in “-N or -Q” declare earnings and dividends in US dollars. To achieve currency consistency between dividends and share price for these stocks, we have shown dividends in US dollars and share price in US dollars (these stocks are listed on a US exchange). The dividends for their Canadian counterparts (-T) would be converted into CDN dollars and would fluctuate with the exchange rate.
PAID subscribers enjoy full access to our enhanced weekly newsletter, premium content, and easy-to-follow trade alerts so they can build DGI portfolios alongside ours. This service provides the resources to develop your DGI business plan confidently. We do the work; you stay in control!
It truly is the subscription that pays dividends!
The greatest investment you can make is in yourself. Are you ready to take that step?
For more articles and the full newsletter, check us out on magicpants.substack.com.