“You have a pair of pants. In the left pocket, you have $100. You take $1 out of the left pocket and put in the right pocket. You now have $101. There is no diminution of dollars in your left pocket. That is one magic pair of pants.”

Category: MP Market Reviews

MP Market Review – January 3, 2025

Last updated by BM on January 7, 2025

Summary


This is a weekly installment of our MP Market Review series, which provides insights and updates on Canadian dividend growth companies we monitor on ‘The List’. To read all our newsletters and premium content be sure to check us out on magicpants.substack.com.

  • This week, we introduce our new 2025 version of ‘The List-USA’. Next week’s newsletter will update both watchlists.
  • Last week, ‘The List’ ‘s dividend growth got a head start from dividends already announced for 2025. Dividend growth is up by +2.3% YTD (income).
  • Last week, the price of ‘The List’ was up with a return of +0.7% YTD (capital).
  • Last week, there were no dividend announcements from companies on ‘The List’.
  • Last week, there were no earnings reports from companies on ‘The List’.
  • This week, no companies on ‘The List’ are due to report earnings.

DGI Clipboard


“If you look for companies that can raise their dividends year after year without milking operations, you will automatically be lead to high quality stocks.”

– Edmund Faltermayer, Fortune magazine, October 1990

America’s Dividend Growth Leaders: Our 2025 Watch List-USA
Intro


Reflecting on 2024 and Looking Ahead

Another year is in the books, and it’s time to gear up for what lies ahead. Overall, 2024 was a strong year for index investors, with many benchmark indexes reaching new highs. Optimism was fueled by receding inflation, lower interest rates, advances in AI, renewed interest in cryptocurrencies, and shifts in the U.S. political landscape.

However, as seasoned investors know, a single year’s performance doesn’t tell the full story. It’s the consistent, compounding results over 5, 10, or more years that truly matter.

That’s why, as dividend growth investors, we focus on the metric that matters most in the short term: growing cash flow. Reflecting on 2024, there’s really one key question for us: How much did our income grow?

We’re proud to report that every company on ‘The List’—our curated watchlist of high-quality dividend growth companies—increased their dividends in 2024. The average income growth from ‘The List’ was an impressive 9.2%, aligning with historical dividend growth rates of 8.1%, 9.1%, 11.2%, and 9.9% over the past four years.

If you’re following along with our model dividend growth portfolio—or managing a similar DGI portfolio—you’ve likely experienced similar results. While capital appreciation is inevitable as dividends grow, it’s important to stay focused on what we control: the growing income our investments provide.

Never lose sight of our unique approach. As the dividend grows, so does the value of the portfolio. Patience and discipline remain the cornerstones of dividend growth investing.

Here’s to another year of building wealth, one dividend at a time!

Introducing ‘The List-USA’: A Watchlist of Quality American Dividend Growth Companies

In 2025, we are excited to publicly launch ‘The List-USA’, our curated watchlist of high-quality American dividend growth companies, alongside the MP Wealth-Builder Model Portfolio (USA). This initiative builds on the proven methodology we use for Canadian dividend growth companies and applies it to the vast U.S. market.

What is ‘The List-USA’?

It’s important to note that ‘The List-USA’ is not a portfolio but a powerful coaching tool designed to inspire ideas and help us effectively manage risk in building the MP Wealth-Builder Model Portfolio (USA). While we own some of the companies on the list, it primarily serves as a resource for identifying potential opportunities when valuations become attractive.

How We Build ‘The List-USA’

The creation of this watchlist involves a disciplined and rigorous screening process.

Initial Screening Criteria:

  • Dividend Growth: Companies must have a minimum of 10 consecutive years of dividend growth.
  • Market Capitalization: A market cap of $1 billion or more is required.

This step narrows the field of NYSE and NASDAQ listed companies to approximately 350 candidates.

Refinement Through Final Criteria:

  • Diversification: We limit the watchlist to five companies per sector, with no more than two companies from the same industry.
  • Cyclicality: To manage risk, we exclude REITs and pure-play energy companies due to their higher cyclicality.

After this extensive filtering and evaluation process, we arrive at the finalized USA Watchlist for 2025.

Why It Matters

This watchlist offers a strategic foundation for dividend growth investors looking to build a high-quality U.S.-focused portfolio. It’s designed to encourage thoughtful decision-making, focusing on both income growth and long-term stability.

It is now time to reveal ‘The List-USA’—your guide to quality dividend growth investing in the United States.
Wrap Up


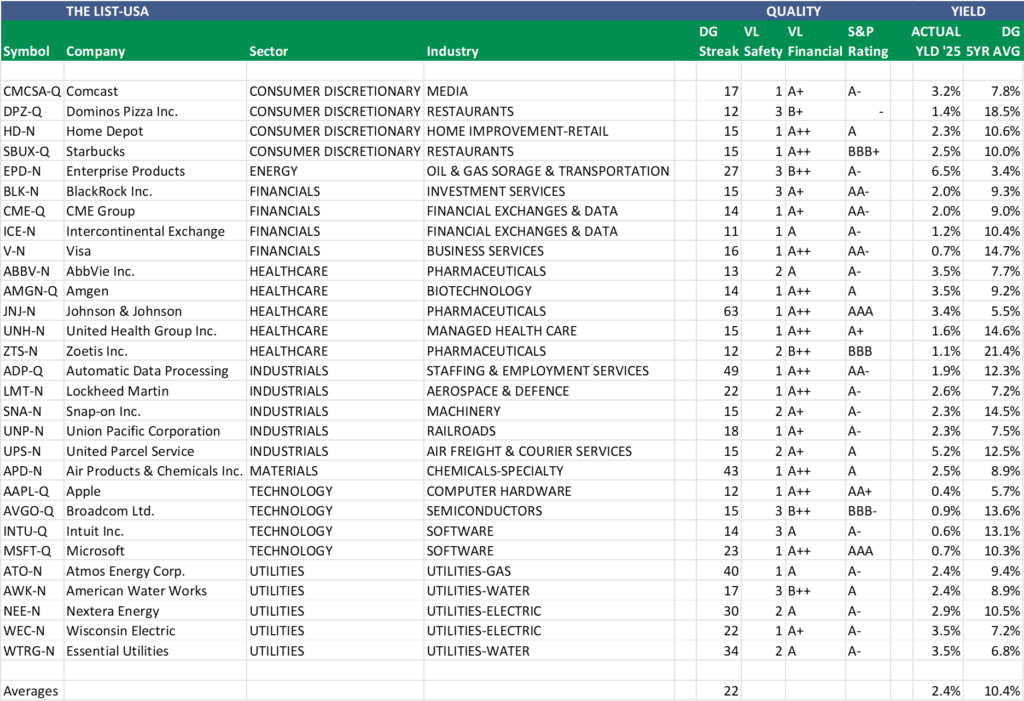
The inaugural USA Watchlist features 29 high-quality companies spanning eight key sectors of the American economy. This diverse selection offers a broad range of starting dividend yields and growth rates, catering to various investment strategies and goals.

Designed with care, this watchlist serves as a robust foundation for building our MP Wealth-Builder Model Portfolio (USA) while providing a structured guide to refine and coach our investment process.

Whether you’re seeking consistent income or long-term growth, this watchlist is your gateway to constructing a resilient and rewarding portfolio.

Become a paid subscriber and start building your portfolio confidently today. We do the work, and you stay in control!

DGI Scorecard

 
The List (2025)

The Magic Pants 2025 lists include 29 dividend growth stocks. Here are the criteria to be considered a candidate on ‘The List’:

  1. Dividend growth streak: 10 years or more.
  2. Market cap: Minimum one billion dollars.
  3. Diversification: Limit of five companies per sector, preferably two per industry.
  4. Cyclicality: Exclude REITs and pure-play energy companies due to high cyclicality.

Based on these criteria, companies are added or removed from ‘The List’ annually on January 1. Prices and dividends are updated weekly.

‘The List’ is not a portfolio but a coaching tool that helps us think about ideas and risk manage our model portfolio. We own some but not all the companies on ‘The List’. In other words, we might want to buy these companies when valuation looks attractive.

Our newsletter provides readers with a comprehensive insight into the implementation and advantages of our Canadian dividend growth investing strategy. This evidence-based, unbiased approach empowers DIY investors to outperform both actively managed dividend funds and passively managed indexes and dividend ETFs over longer-term horizons.

For those interested in something more, please upgrade to a paid subscriber; you get the enhanced weekly newsletter, access to premium content, full privileges on the new Substack website magicpants.substack.com and DGI alerts whenever we make stock transactions in our model portfolio.

Performance of ‘The List’


Last week dividend growth of ‘The List’ got a head start from dividends already announced for 2025. Dividend growth is up by +2.3% YTD (income). Dividend increases announced in 2025 will further contribute to this growth.

Last week, the price of ‘The List’ was up with a return of +0.7% YTD (capital).

Even though prices may fluctuate, the dependable growth in our income does not. Stay the course. You will be happy you did.

Last week’s best performers on ‘The List’ were Bell Canada (BCE-T), up +5.36%; Stella-Jones Inc. (SJ-T), up +3.83%; and Enbridge Inc. (ENB-T), up +3.23%.

TFI International (TFII-N) was the worst performer last week, down -2.96%.

SYMBOL COMPANY YLD PRICE YTD % DIV YTD % STREAK
ATD-T Alimentation Couche-Tard Inc. 1.0% $78.56 -0.6% $0.78 8.3% 15
BCE-T Bell Canada 11.6% $34.40 2.6% $3.99 0.0% 16
BIP-N Brookfield Infrastructure Partners 5.1% $31.96 0.3% $1.62 0.0% 17
CCL-B-T CCL Industries Inc. 1.6% $73.00 -0.8% $1.16 0.0% 23
CNR-T Canadian National Railway 2.3% $148.18 1.0% $3.38 0.0% 29
CTC-A-T Canadian Tire 4.6% $155.00 0.8% $7.10 1.4% 14
CU-T Canadian Utilities Limited 5.2% $34.85 0.2% $1.81 0.1% 53
DOL-T Dollarama Inc. 0.3% $141.90 1.2% $0.37 5.1% 14
EMA-T Emera 5.4% $53.64 0.2% $2.90 0.7% 18
ENB-T Enbridge Inc. 6.1% $62.25 0.6% $3.77 3.0% 29
ENGH-T Enghouse Systems Limited 3.8% $27.53 1.7% $1.04 4.0% 18
FNV-N Franco Nevada 1.2% $122.41 1.1% $1.44 0.0% 17
FTS-T Fortis Inc. 4.1% $60.04 0.7% $2.46 3.1% 51
GSY-T goeasy Ltd. 2.8% $168.07 0.5% $4.68 0.0% 10
IFC-T Intact Financial 1.8% $265.72 1.0% $4.84 0.0% 20
L-T Loblaw Companies Limited 1.1% $191.50 0.7% $2.05 7.0% 13
MFC-T Manulife Financial 3.6% $44.30 0.8% $1.60 0.0% 11
MGA-N Magna 4.6% $41.26 -1.1% $1.90 0.0% 15
MRU-T Metro Inc. 1.5% $91.28 1.2% $1.34 0.0% 30
RY-T Royal Bank of Canada 3.4% $173.91 1.0% $5.92 3.5% 14
SJ-T Stella-Jones Inc. 1.5% $73.50 0.7% $1.12 0.0% 20
STN-T Stantec Inc. 0.7% $114.36 1.1% $0.84 1.8% 13
T-T Telus 8.1% $19.91 1.4% $1.61 5.2% 21
TD-T TD Bank 5.4% $77.78 1.7% $4.20 2.9% 14
TFII-N TFI International 1.3% $133.64 0.8% $1.80 12.5% 14
TIH-T Toromont Industries 1.7% $113.28 0.2% $1.92 0.0% 35
TRI-N Thomson Reuters 1.3% $162.37 0.0% $2.16 0.0% 31
TRP-T TC Energy Corp. 4.8% $68.56 0.5% $3.29 0.0% 24
WCN-N Waste Connections 0.7% $170.93 0.6% $1.26 7.7% 15
Averages 3.3% 0.7% 2.3% 21

Note: Stocks ending in “-N” declare earnings and dividends in US dollars. To achieve currency consistency between dividends and share price for these stocks, we have shown dividends in US dollars and share price in US dollars (these stocks are listed on a US exchange). The dividends for their Canadian counterparts (-T) would be converted into CDN dollars and would fluctuate with the exchange rate.

PAID subscribers enjoy full access to our enhanced weekly newsletter, premium content, and easy-to-follow trade alerts so they can build DGI portfolios alongside ours. This service provides the resources to develop your DGI business plan confidently. We do the work; you stay in control!

It truly is the subscription that pays dividends!

The greatest investment you can make is in yourself. Are you ready to take that step? 

For more articles and the full newsletter, check us out on magicpants.substack.com.

MP Market Review – December 27, 2024

Last updated by BM on December 31, 2024

Summary


This is a weekly installment of our MP Market Review series, which provides insights and updates on Canadian dividend growth companies we monitor on ‘The List’. To read all our newsletters and premium content be sure to check us out on magicpants.substack.com.

  • This week, we introduce our 2025 version of ‘The List’.
  • Last week, dividend growth of ‘The List’ stayed the same and is up by +9.2% YTD (income).
  • Last week, the price of ‘The List’ was up with a return of +10.2% YTD (capital).
  • Last week, there were no dividend announcements from companies on ‘The List’.
  • Last week, there were no earnings reports from companies on ‘The List’.
  • This week, no companies on ‘The List’ are due to report earnings.

DGI Clipboard


“If you look for companies that can raise their dividends year after year without milking operations, you will automatically be lead to high quality stocks.”

– Edmund Faltermayer, Fortune magazine, October 1990

Canada’s Dividend Growth Leaders: Our 2025 Watch List
Intro


As dividend growth investors, we see ourselves as an asset management business. Our “assets” are the many high-quality dividend growth companies we own in Canada and the United States.

One of the most powerful lessons I’ve learned about both investing and running a business came from two of my greatest mentors: Bill Gates and Warren Buffett. In a memorable moment, they were each asked to write down the one word they believed was most responsible for their success. Remarkably, they both wrote the same word: focus.

Gates and Buffett believe that focus, concentration on key goals, and the ability to say “no” to distractions are crucial to success in their respective fields.

Inspired by their words, I’ve created ‘The List’—a curated watchlist of quality dividend growth companies. This focused approach helps me avoid the noise of the broader market, making it easier to track key metrics and develop a deeper understanding of the selected businesses I may invest in.

‘The List’ is not a portfolio but a coaching tool that helps us think about ideas and risk manage our model portfolio. We own some but not all the companies on ‘The List’. In other words, we might want to buy these companies when valuation looks attractive.

To begin our selection for 2025, we review the listed companies on the Toronto Stock Exchange (TSX). The TSX is one of the world’s largest stock exchanges and the third largest in North America. It is home to over 700 companies across all sectors of the Canadian economy.

Here are the criteria to be considered a candidate on ‘The List’:

  1. Dividend growth streak: 10 years or more.
  2. Market cap: Minimum one billion dollars.
  3. Diversification: Limit of five companies per sector, preferably two per industry.
  4. Cyclicality: Exclude REITs and pure-play energy companies due to higher cyclicality.

By screening for the first two criteria, ten years of consecutive dividend growth and a market cap of one billion dollars or more, we narrow our candidates down to only 67 companies (less than 10% of the companies on the TSX).

We then winnow further using the final two criteria, diversification and cyclicality to ensure the companies selected represent stable businesses in all sectors of the Canadian economy.

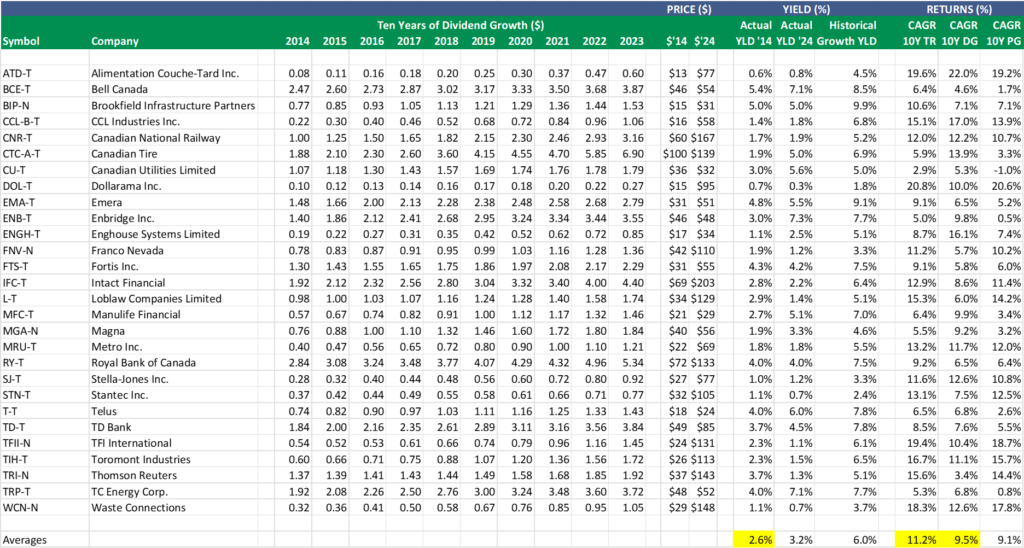
Unless their dividend streaks are interrupted, we typically don’t remove companies on ‘The List’. All 28 companies currently on ‘The List’ increased their dividends in 2024, securing their place on our watch list for 2025.

The highlighted column represents the true magic of what we do. In 2024, ‘The List’ delivered an impressive 9.2% increase in income on average. At this pace, our income could double in less than eight years—and over the course of a thirty-year retirement, it could double more than three times!

In addition, our capital increased by 10%+ on ‘The List,’ reinforcing the strength of our strategy. While ‘The List’ isn’t a portfolio in itself, it serves as a powerful tool to showcase the potential of disciplined dividend growth investing.

This is the transformative power of dividend growth investing. Unlike most retirees, we don’t worry about running out of income or capital. Instead, we focus on building a reliable, growing income stream that works for us in the long run.

Identifying Potential Candidates

One key to our success over the years has been our ability to identify companies with the potential to become the next generation of quality dividend growers. In 2025, we will examine the new companies that meet our criteria for the first time.

We’ve identified six companies on the TSX that will meet our first two criteria for inclusion on ‘The List’ in 2025:

  1. Dividend Growth Streak: At least 10 years.
  2. Market Cap: Minimum of one billion dollars.

Here are the candidates that qualify for the first time in 2025:

When evaluating new entrants against our final two criteria—diversification and cyclicality—we conduct a thorough ‘quality’ review process, similar to the one used when selecting companies for purchase in our MP Wealth-Builder Model Portfolio (CDN). The more quality indicators a company meets, the higher its overall quality.

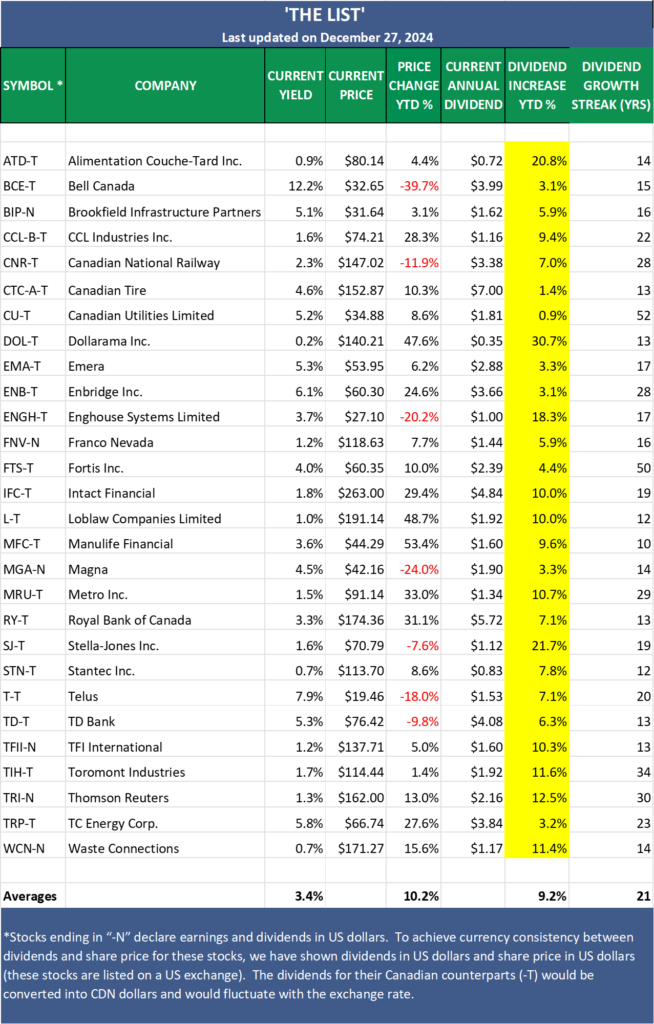
The one company that stood out was goeasy Ltd.  (GSY-T).

goeasy Ltd. is a financial services company with an annualized total return of 25.3% over the last ten years. The principal operating activities of the Company include: providing loans and other financial services to consumers and leasing household products to consumers. Customers can transact seamlessly through an omnichannel model that includes online and mobile platforms. The Company operates in two reportable segments: easyfinancial and easyhome. The easyfinancial reportable segment lends out capital in the form of unsecured and secured consumer loans to nonprime borrowers. easyfinancial’s product offering consists of unsecured and real estate-secured installment loans. The key revenue of the company is generated from easyfinancial.

goeasy Ltd. checks many of our ‘quality indicators’ and has earned its place as one of the top dividend growth stocks on the TSX over the past decade. While its shorter dividend streak slightly skews some of its quality metrics, the company’s performance remains impressive. Even if its growth rates over the next decade were only half as strong as the last, goeasy Ltd. would still rank near the top of most lists for both overall income and capital growth potential.

(GSY-T)’s small market cap and limited third-party financial coverage currently place it in our ‘non-Core’ category. To learn more about how we classify categories and determine position sizes for quality dividend growers, refer to our MP Wealth-Builder Model Portfolio (CDN) – Business Plan.

As a general rule, we aim to keep our watch list focused and manageable. That means maintaining around 30 companies on ‘The List.’

Looking ahead to 2025, with the addition of goeasy Ltd., our watch list has grown to 29 carefully selected dividend growth companies. These companies represent nine sectors of the Canadian economy and offer a balanced mix of diversification, starting yields, and growth rates.

Wrap Up


‘The List’ is designed to serve as a valuable resource for anyone looking to build or refine their own dividend growth investing (DGI) portfolio. Whether you seek stability or long-term income growth, this curated selection provides a solid foundation.

In next week’s newsletter we will begin reporting and coaching our dividend growth investing (DGI) process using the companies on the Canadian 2025 version of ‘The List’.

I will also introduce the 2025 United States version of ‘The List’ for our subscribers interested in adding some southern exposure to their DGI journey.

Happy New Year, and a special shout-out to all our new subscribers in 2024. I am not just interested in getting your subscription; I am interested in keeping it! Comments at the bottom of each post are welcome. It’s how we get better.

Become a paid subscriber and start building your portfolio confidently today. We do the work, and you stay in control!

DGI Scorecard

 
The List (2024)

The Magic Pants 2024 list includes 28 Canadian dividend growth stocks. Here are the criteria to be considered a candidate on ‘The List’:

  1. Dividend growth streak: 10 years or more.
  2. Market cap: Minimum one billion dollars.
  3. Diversification: Limit of five companies per sector, preferably two per industry.
  4. Cyclicality: Exclude REITs and pure-play energy companies due to high cyclicality.

Based on these criteria, companies are added or removed from ‘The List’ annually on January 1. Prices and dividends are updated weekly.

‘The List’ is not a portfolio but a coaching tool that helps us think about ideas and risk manage our model portfolio. We own some but not all the companies on ‘The List’. In other words, we might want to buy these companies when valuation looks attractive.

Our newsletter provides readers with a comprehensive insight into the implementation and advantages of our Canadian dividend growth investing strategy. This evidence-based, unbiased approach empowers DIY investors to outperform both actively managed dividend funds and passively managed indexes and dividend ETFs over longer-term horizons.

For those interested in something more, please upgrade to a paid subscriber; you get the enhanced weekly newsletter, access to premium content, full privileges on the new Substack website magicpants.substack.com and DGI alerts whenever we make stock transactions in our model portfolio.

Performance of ‘The List’


Last week, dividend growth of ‘The List’ stayed the same and has increased by +9.2% YTD (income). How much did your salary go up this year?

Last week, the average price return of ‘The List’ was up with a return of +10.2% YTD (capital).

Even though prices may fluctuate, the dependable growth in our income does not. Stay the course. You will be happy you did.

Last week’s best performers on ‘The List’ were Franco Nevada (FNV-N), up +2.08%; TD Bank (TD-T), up +1.85%; and Manulife Financial (MFC-T), up +1.75%.

Telus (T-T) was the worst performer last week, down -2.31%.

SYMBOL COMPANY YLD PRICE YTD % DIV YTD % STREAK
ATD-T Alimentation Couche-Tard Inc. 0.9% $80.14 4.4% $0.72 20.8% 14
BCE-T Bell Canada 12.2% $32.65 -39.7% $3.99 3.1% 15
BIP-N Brookfield Infrastructure Partners 5.1% $31.64 3.1% $1.62 5.9% 16
CCL-B-T CCL Industries Inc. 1.6% $74.21 28.3% $1.16 9.4% 22
CNR-T Canadian National Railway 2.3% $147.02 -11.9% $3.38 7.0% 28
CTC-A-T Canadian Tire 4.6% $152.87 10.3% $7.00 1.4% 13
CU-T Canadian Utilities Limited 5.2% $34.88 8.6% $1.81 0.9% 52
DOL-T Dollarama Inc. 0.2% $140.21 47.6% $0.35 30.7% 13
EMA-T Emera 5.3% $53.95 6.2% $2.88 3.3% 17
ENB-T Enbridge Inc. 6.1% $60.30 24.6% $3.66 3.1% 28
ENGH-T Enghouse Systems Limited 3.7% $27.10 -20.2% $1.00 18.3% 17
FNV-N Franco Nevada 1.2% $118.63 7.7% $1.44 5.9% 16
FTS-T Fortis Inc. 4.0% $60.35 10.0% $2.39 4.4% 50
IFC-T Intact Financial 1.8% $263.00 29.4% $4.84 10.0% 19
L-T Loblaw Companies Limited 1.0% $191.14 48.7% $1.92 10.0% 12
MFC-T Manulife Financial 3.6% $44.29 53.4% $1.60 9.6% 10
MGA-N Magna 4.5% $42.16 -24.0% $1.90 3.3% 14
MRU-T Metro Inc. 1.5% $91.14 33.0% $1.34 10.7% 29
RY-T Royal Bank of Canada 3.3% $174.36 31.1% $5.72 7.1% 13
SJ-T Stella-Jones Inc. 1.6% $70.79 -7.6% $1.12 21.7% 19
STN-T Stantec Inc. 0.7% $113.70 8.6% $0.83 7.8% 12
T-T Telus 7.9% $19.46 -18.0% $1.53 7.1% 20
TD-T TD Bank 5.3% $76.42 -9.8% $4.08 6.3% 13
TFII-N TFI International 1.2% $137.71 5.0% $1.60 10.3% 13
TIH-T Toromont Industries 1.7% $114.44 1.4% $1.92 11.6% 34
TRI-N Thomson Reuters 1.3% $162.00 13.0% $2.16 12.5% 30
TRP-T TC Energy Corp. 5.8% $66.74 27.6% $3.84 3.2% 23
WCN-N Waste Connections 0.7% $171.27 15.6% $1.17 11.4% 14
Averages 3.4% 10.2% 9.2% 21

Note: Stocks ending in “-N” declare earnings and dividends in US dollars. To achieve currency consistency between dividends and share price for these stocks, we have shown dividends in US dollars and share price in US dollars (these stocks are listed on a US exchange). The dividends for their Canadian counterparts (-T) would be converted into CDN dollars and would fluctuate with the exchange rate.

PAID subscribers enjoy full access to our enhanced weekly newsletter, premium content, and easy-to-follow trade alerts so they can build DGI portfolios alongside ours. This service provides the resources to develop your DGI business plan confidently. We do the work; you stay in control!

It truly is the subscription that pays dividends!

The greatest investment you can make is in yourself. Are you ready to take that step? 

For more articles and the full newsletter, check us out on magicpants.substack.com.

MP Market Review – December 20, 2024

Last updated by BM on December 24, 2024

Summary


This is a weekly installment of our MP Market Review series, which provides insights and updates on Canadian dividend growth companies we monitor on ‘The List’. To read all our newsletters and premium content be sure to check us out on magicpants.substack.com.

  • This week, we learn the predictive power of our DGI strategy in forecasting long term capital returns.
  • Last week, dividend growth of ‘The List’ stayed the same and is up by +9.2% YTD (income).
  • Last week, the price of ‘The List’ was down with a return of +9.8% YTD (capital).
  • Last week, there were no dividend announcements from companies on ‘The List’.
  • Last week, there were no earnings reports from companies on ‘The List’.
    This week, no companies on ‘The List’ are due to report earnings.

DGI Clipboard


“The magnitude of the income, current or prospective, determines the value of the capital which produces it.”

– Arnold Bernhard, Founder of Value Line

Forget the Noise—Focus on Predictable Long-Term Growth
Intro


A couple of weeks ago, we discussed how the short-term predictability of dividend growth serves as the cornerstone of our dividend growth investing strategy. Knowing we can rely on the steady income generated by our investments allows us to sleep well at night, even during periods of market volatility. Moreover, the dependable growth of that income stream helps eliminate concerns or panic about whether it will keep pace with inflation and continue meeting our spending needs when we eventually retire. What may not be immediately obvious is how this same predictability extends to our long-term capital returns.

John Bogle, the founder of Vanguard Group, and Ed Easterling of Crestmont Research both claim they can accurately calculate expected long-term capital returns for dividend growth companies.

They believe stock market returns can be broken down into three key components:

  1. Dividend Yield – The income generated by dividends relative to the stock price.
  2. Growth – The increase in earnings and dividends over time.
  3. P/E Change – The shift in price-to-earnings (P/E) ratios, reflecting changes in market valuation or “expensiveness.”

By focusing on these fundamental drivers, investors can better understand and forecast the long-term performance of dividend growth stocks.

Bogle calls the first two components, Yield + Growth, investment aspects of the investment return and the last component, +/- Change in P/E Ratio, the speculative return – what will people pay for a dollar’s worth of earnings. 

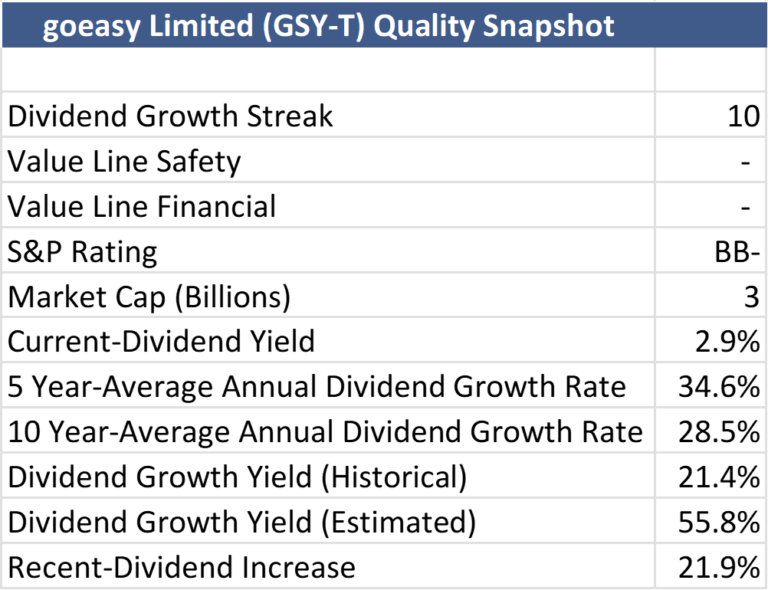
The table below presents the ten-year dividend growth and annualized returns for ‘The List’ as of January 1, 2024. The highlighted averages at the bottom assume an equal investment in each company on January 1, 2014, regardless of valuation.

Let’s apply the teachings of Bogle and Easterling from earlier to evaluate the accuracy of the list of stocks we followed in 2024.

Ten years ago, the average dividend yield of ‘The List’ was 2.6% (Actual YLD ’14). Over the following decade, the average annual dividend growth rate was 9.5% (CAGR 10Y DG). Combining these two components gives us an expected investment return of 12.1%.

Over the last decade, the average total return (CAGR 10Y TR) of ‘The List’ was 11.2%. Pretty close to what Bogle and Easterling’s investment return predicted. The -0.9% difference can be attributed to the Change in P/E from the start to the end of the decade (speculative return). This group of stocks, on average, were slightly overvalued (expensive) in 2014 compared to 2024.

Wrap Up


Predictability ultimately depends on three factors: what we know (Yield), what we can reasonably expect (Dividend Growth), and the speculative return (+/—change in P/E). Did we purchase the stock at a sensible price? Mastering these three elements gives you an investment strategy that delivers dependable, growing income and offers predictable future returns.

Become a paid subscriber and start building your portfolio confidently today. We do the work, and you stay in control!

DGI Scorecard

 
The List (2024)

The Magic Pants 2024 list includes 28 Canadian dividend growth stocks. Here are the criteria to be considered a candidate on ‘The List’:

  1. Dividend growth streak: 10 years or more.
  2. Market cap: Minimum one billion dollars.
  3. Diversification: Limit of five companies per sector, preferably two per industry.
  4. Cyclicality: Exclude REITs and pure-play energy companies due to high cyclicality.

Based on these criteria, companies are added or removed from ‘The List’ annually on January 1. Prices and dividends are updated weekly.

‘The List’ is not a portfolio but a coaching tool that helps us think about ideas and risk manage our model portfolio. We own some but not all the companies on ‘The List’. In other words, we might want to buy these companies when valuation looks attractive.

Our newsletter provides readers with a comprehensive insight into the implementation and advantages of our Canadian dividend growth investing strategy. This evidence-based, unbiased approach empowers DIY investors to outperform both actively managed dividend funds and passively managed indexes and dividend ETFs over longer-term horizons.

For those interested in something more, please upgrade to a paid subscriber; you get the enhanced weekly newsletter, access to premium content, full privileges on the new Substack website magicpants.substack.com and DGI alerts whenever we make stock transactions in our model portfolio.

Performance of ‘The List’


Last week, dividend growth of ‘The List’ stayed the same and has increased by +9.2% YTD (income). How much did your salary go up this year?

Last week, the average price return of ‘The List’ was down with a return of +9.8% YTD (capital).

Even though prices may fluctuate, the dependable growth in our income does not. Stay the course. You will be happy you did.

Last week’s best performers on ‘The List’ were Toromont Industries (TIH-T), up +2.24%; Canadian Tire (CTC-A-T), up +0.38%; and Enghouse Systems Limited (ENGH-T), up +0.29%.

TFI International (TFII-N) was the worst performer last week, down -9.55%.

SYMBOL COMPANY YLD PRICE YTD % DIV YTD % STREAK
ATD-T Alimentation Couche-Tard Inc. 0.9% $80.79 5.3% $0.72 20.8% 14
BCE-T Bell Canada 12.0% $33.28 -38.6% $3.99 3.1% 15
BIP-N Brookfield Infrastructure Partners 5.2% $31.36 2.2% $1.62 5.9% 16
CCL-B-T CCL Industries Inc. 1.6% $73.56 27.2% $1.16 9.4% 22
CNR-T Canadian National Railway 2.3% $145.34 -12.9% $3.38 7.0% 28
CTC-A-T Canadian Tire 4.6% $153.58 10.8% $7.00 1.4% 13
CU-T Canadian Utilities Limited 5.3% $34.47 7.3% $1.81 0.9% 52
DOL-T Dollarama Inc. 0.3% $138.51 45.8% $0.35 30.7% 13
EMA-T Emera 5.4% $53.65 5.6% $2.88 3.3% 17
ENB-T Enbridge Inc. 6.2% $59.43 22.8% $3.66 3.1% 28
ENGH-T Enghouse Systems Limited 3.6% $27.44 -19.2% $1.00 18.3% 17
FNV-N Franco Nevada 1.2% $116.21 5.5% $1.44 5.9% 16
FTS-T Fortis Inc. 4.0% $60.01 9.4% $2.39 4.4% 50
IFC-T Intact Financial 1.8% $262.06 28.9% $4.84 10.0% 19
L-T Loblaw Companies Limited 1.0% $190.62 48.3% $1.92 10.0% 12
MFC-T Manulife Financial 3.7% $43.53 50.7% $1.60 9.6% 10
MGA-N Magna 4.5% $42.22 -23.9% $1.90 3.3% 14
MRU-T Metro Inc. 1.5% $90.43 32.0% $1.34 10.7% 29
RY-T Royal Bank of Canada 3.3% $173.40 30.3% $5.72 7.1% 13
SJ-T Stella-Jones Inc. 1.6% $70.73 -7.7% $1.12 21.7% 19
STN-T Stantec Inc. 0.7% $113.86 8.8% $0.83 7.8% 12
T-T Telus 7.7% $19.92 -16.0% $1.53 7.1% 20
TD-T TD Bank 5.4% $75.03 -11.4% $4.08 6.3% 13
TFII-N TFI International 1.2% $138.25 5.4% $1.60 10.3% 13
TIH-T Toromont Industries 1.7% $114.06 1.1% $1.92 11.6% 34
TRI-N Thomson Reuters 1.3% $162.20 13.2% $2.16 12.5% 30
TRP-T TC Energy Corp. 5.8% $65.79 25.8% $3.84 3.2% 23
WCN-N Waste Connections 0.7% $174.28 17.6% $1.17 11.4% 14
Averages 3.4% 9.8% 9.2% 21

Note: Stocks ending in “-N” declare earnings and dividends in US dollars. To achieve currency consistency between dividends and share price for these stocks, we have shown dividends in US dollars and share price in US dollars (these stocks are listed on a US exchange). The dividends for their Canadian counterparts (-T) would be converted into CDN dollars and would fluctuate with the exchange rate.

PAID subscribers enjoy full access to our enhanced weekly newsletter, premium content, and easy-to-follow trade alerts so they can build DGI portfolios alongside ours. This service provides the resources to develop your DGI business plan confidently. We do the work; you stay in control!

It truly is the subscription that pays dividends!

The greatest investment you can make is in yourself. Are you ready to take that step? 

For more articles and the full newsletter, check us out on magicpants.substack.com.
MP Market Review – December 13, 2024

Last updated by BM on December 17, 2024

Summary


This is a weekly installment of our MP Market Review series, which provides insights and updates on Canadian dividend growth companies we monitor on ‘The List’. To read all our newsletters and premium content be sure to check us out on magicpants.substack.com.

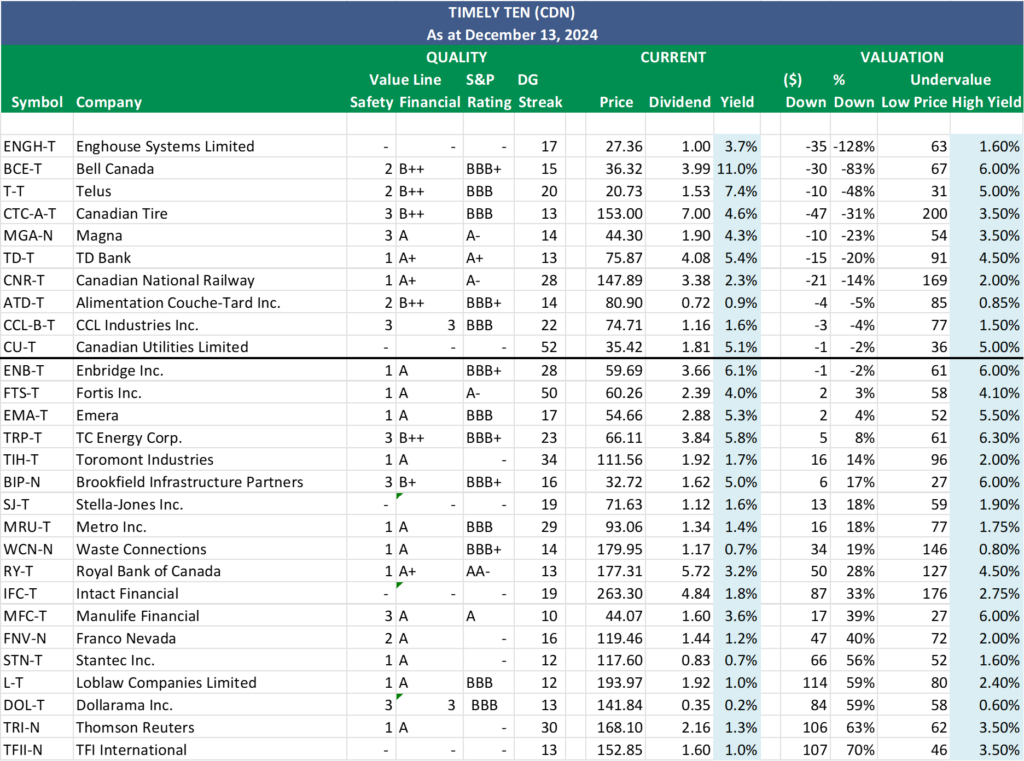
  • This week, we reveal December’s ‘Timely Ten’ most undervalued dividend growth companies.
  • Last week, dividend growth of ‘The List’ stayed the same and is up by +9.2% YTD (income).
  • Last week, the price of ‘The List’ was down with a return of +12.2% YTD (capital).
  • Last week, there were no dividend announcements from companies on ‘The List’.
  • Last week, there was an off-cycle earnings report from a company on ‘The List’.
  • This is the last of the off-cycle reports with the official Q4 earnings season beginning in late January.

DGI Clipboard


“Concentrate on what will produce results rather than on the results, the process rather than the prize.”

— Bill Walsh

Timely Ten: Amidst Tariffs and Turmoil
Intro


Political turmoil in Ottawa and the threat of tariffs on Canadian companies adversely affect Canadian markets. South of the border, healthcare companies are under siege after the United Health shooting. Lots to ponder. This issue should give you lots of ideas to dig a little deeper.

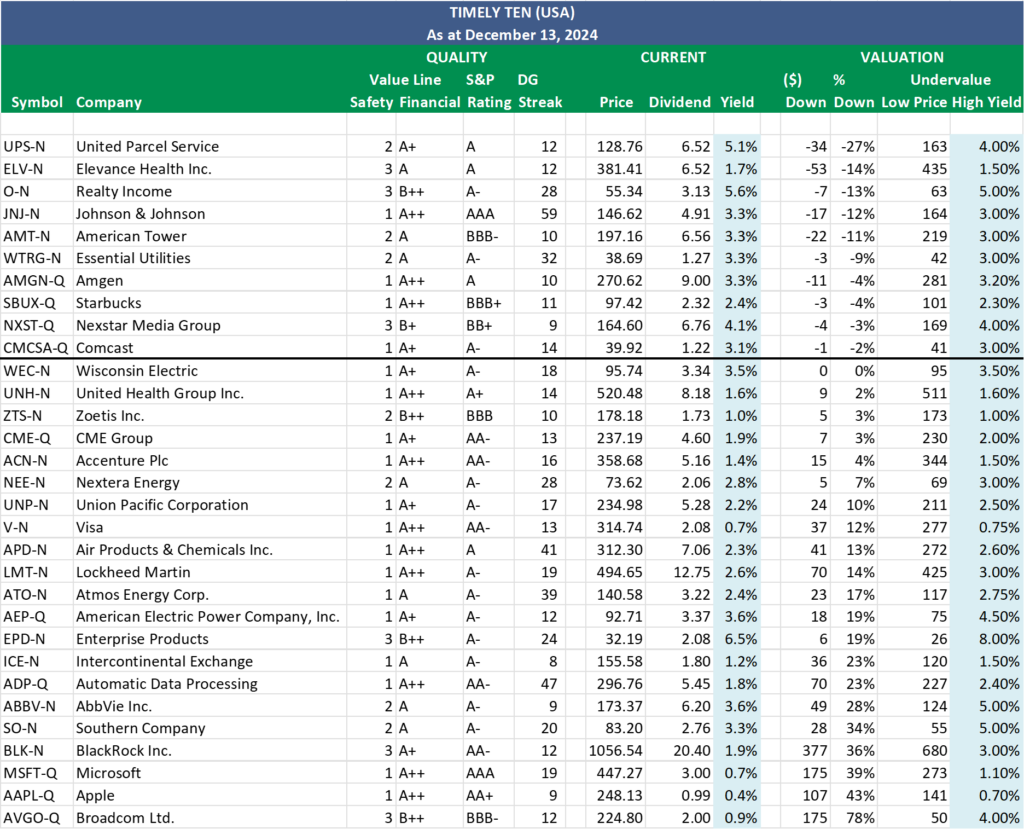
Below are the ten most undervalued dividend growth companies from our Canadian and U.S. watchlists, based on last Friday’s closing prices.

We refresh these lists annually during the first week of January. Be sure to catch the December 31 issue of our newsletter for the highly anticipated release of next year’s updated watchlists!

We own some but not all the companies on these lists. In other words, we might want to buy these companies when valuation looks attractive.

Here’s a recap on how we select our ‘Timely Ten’:

Step three in our process involves monitoring our quality dividend growers regularly, which can become quite challenging depending on the number of companies we track. Fortunately, we rely on ‘The List’ instead of the vast array of stocks in the index, which streamlines our task. Nevertheless, we continually seek methods to enhance our efficiency. Through dividend yield theory, we’ve discovered an approach that has proven remarkably effective in aiding us with our efforts over the years.

Dividend yield theory is a simple and intuitive approach to valuing dividend growth stocks. It suggests that the dividend yield of quality dividend growth stocks tends to revert to the mean over time, assuming that the underlying business model remains stable. In practical terms, if a stock pays a dividend yield above its ten-year average annual yield, its price will likely increase to return the yield to its historical average. Knowing that price and yield go in opposite directions, this theory helps us find stocks poised for a positive price correction.

We have pre-screened our candidates using the criteria we initially laid out in building ‘The List’. This helps us considerably narrow the universe of investable stocks.

  1. Dividend growth streak: 10 years or more.
  2. Market cap: Minimum one billion dollars.
  3. Diversification: Limit of five companies per sector, preferably two per industry.
  4. Cyclicality: Exclude REITs and pure-play energy companies due to high cyclicality.

Next, we rank ‘The List’ by how significantly each stock is priced below its fair value (Low Price), as calculated using dividend yield theory. To determine fair value, divide the current dividend by what you consider to be the stock’s historically high yield.

All companies above the thick black line have a current price below fair value (sensibly priced). The stocks above the thick black line make up our ‘Timely Ten’.

Wrap Up


When making investment decisions, always prioritize a company’s ‘quality’ over a ‘sensible price’. For more details on stock selection and our quality indicators, refer to our free sample Business Plan.

If you’re a new investor looking to build positions in the ‘Timely Ten,’ now is the perfect time to start your research and take action. For a more guided approach, consider becoming a PAID subscriber to gain access to DGI Alerts. These alerts notify you whenever we make a trade in our model portfolios, allowing you to invest alongside us with confidence. We do the work, and you stay in control!

DGI Scorecard

 
The List (2024)

The Magic Pants 2024 list includes 28 Canadian dividend growth stocks. Here are the criteria to be considered a candidate on ‘The List’:

  1. Dividend growth streak: 10 years or more.
  2. Market cap: Minimum one billion dollars.
  3. Diversification: Limit of five companies per sector, preferably two per industry.
  4. Cyclicality: Exclude REITs and pure-play energy companies due to high cyclicality.

Based on these criteria, companies are added or removed from ‘The List’ annually on January 1. Prices and dividends are updated weekly.

‘The List’ is not a portfolio but a coaching tool that helps us think about ideas and risk manage our model portfolio. We own some but not all the companies on ‘The List’. In other words, we might want to buy these companies when valuation looks attractive.

Our newsletter provides readers with a comprehensive insight into the implementation and advantages of our Canadian dividend growth investing strategy. This evidence-based, unbiased approach empowers DIY investors to outperform both actively managed dividend funds and passively managed indexes and dividend ETFs over longer-term horizons.

For those interested in something more, please upgrade to a paid subscriber; you get the enhanced weekly newsletter, access to premium content, full privileges on the new Substack website magicpants.substack.com and DGI alerts whenever we make stock transactions in our model portfolio.

Performance of ‘The List’


Last week, dividend growth of ‘The List’ stayed the same and has increased by +9.2% YTD (income). How much did your salary go up this year?

Last week, the average price return of ‘The List’ was down with a return of +12.2% YTD (capital).

Even though prices may fluctuate, the dependable growth in our income does not. Stay the course. You will be happy you did.

Last week’s best performers on ‘The List’ were TD Bank (TD-T), up +3.21%; Loblaw Companies Limited (L-T), up +1.18%; and TFI International (TFII-N), up +0.60%.

Enghouse Systems Limited (ENGH-T) was the worst performer last week, down -12.53%.

SYMBOL COMPANY YLD PRICE YTD % DIV YTD % STREAK
ATD-T Alimentation Couche-Tard Inc. 0.9% $80.90 5.4% $0.72 20.8% 14
BCE-T Bell Canada 11.0% $36.32 -33.0% $3.99 3.1% 15
BIP-N Brookfield Infrastructure Partners 5.0% $32.72 6.6% $1.62 5.9% 16
CCL-B-T CCL Industries Inc. 1.6% $74.71 29.2% $1.16 9.4% 22
CNR-T Canadian National Railway 2.3% $147.89 -11.4% $3.38 7.0% 28
CTC-A-T Canadian Tire 4.6% $153.00 10.4% $7.00 1.4% 13
CU-T Canadian Utilities Limited 5.1% $35.42 10.3% $1.81 0.9% 52
DOL-T Dollarama Inc. 0.2% $141.84 49.3% $0.35 30.7% 13
EMA-T Emera 5.3% $54.66 7.6% $2.88 3.3% 17
ENB-T Enbridge Inc. 6.1% $59.69 23.3% $3.66 3.1% 28
ENGH-T Enghouse Systems Limited 3.7% $27.36 -19.5% $1.00 18.3% 17
FNV-N Franco Nevada 1.2% $119.46 8.5% $1.44 5.9% 16
FTS-T Fortis Inc. 4.0% $60.26 9.9% $2.39 4.4% 50
IFC-T Intact Financial 1.8% $263.30 29.5% $4.84 10.0% 19
L-T Loblaw Companies Limited 1.0% $193.97 50.9% $1.92 10.0% 12
MFC-T Manulife Financial 3.6% $44.07 52.6% $1.60 9.6% 10
MGA-N Magna 4.3% $44.30 -20.2% $1.90 3.3% 14
MRU-T Metro Inc. 1.4% $93.06 35.8% $1.34 10.7% 29
RY-T Royal Bank of Canada 3.2% $177.31 33.3% $5.72 7.1% 13
SJ-T Stella-Jones Inc. 1.6% $71.63 -6.5% $1.12 21.7% 19
STN-T Stantec Inc. 0.7% $117.60 12.4% $0.83 7.8% 12
T-T Telus 7.4% $20.73 -12.6% $1.53 7.1% 20
TD-T TD Bank 5.4% $75.87 -10.4% $4.08 6.3% 13
TFII-N TFI International 1.0% $152.85 16.5% $1.60 10.3% 13
TIH-T Toromont Industries 1.7% $111.56 -1.1% $1.92 11.6% 34
TRI-N Thomson Reuters 1.3% $168.10 17.3% $2.16 12.5% 30
TRP-T TC Energy Corp. 5.8% $66.11 26.4% $3.84 3.2% 23
WCN-N Waste Connections 0.7% $179.95 21.5% $1.17 11.4% 14
Averages 3.3% 12.2% 9.2% 21

Note: Stocks ending in “-N” declare earnings and dividends in US dollars. To achieve currency consistency between dividends and share price for these stocks, we have shown dividends in US dollars and share price in US dollars (these stocks are listed on a US exchange). The dividends for their Canadian counterparts (-T) would be converted into CDN dollars and would fluctuate with the exchange rate.

PAID subscribers enjoy full access to our enhanced weekly newsletter, premium content, and easy-to-follow trade alerts so they can build DGI portfolios alongside ours. This service provides the resources to develop your DGI business plan confidently. We do the work; you stay in control!

It truly is the subscription that pays dividends!

The greatest investment you can make is in yourself. Are you ready to take that step? 

For more articles and the full newsletter, check us out on magicpants.substack.com.

MP Market Review – December 6, 2024

Last updated by BM on December 10, 2024

Summary


This is a weekly installment of our MP Market Review series, which provides insights and updates on Canadian dividend growth companies we monitor on ‘The List’. To read all our newsletters and premium content be sure to check us out on magicpants.substack.com.

  • This week, we look at the predictability of dividend growth for companies on ‘the List’.
  • Last week, dividend growth of ‘The List’ was up and has increased by +9.2% YTD (income).
  • Last week, the price of ‘The List’ was up with a return of +15.0% YTD (capital).
  • Last week, there were two dividend announcements from companies on ‘The List’.
  • Last week, there were three off-cycle earnings reports from companies on ‘The List’.
  • This week, one company on ‘The List’ is due to report earnings.

DGI Clipboard


“The beauty of dividends is their predictability, even when the stock market isn’t.”

— Lowell Miller 

Predictable Dividend Growth: The Cornerstone of Wealth Building
Intro


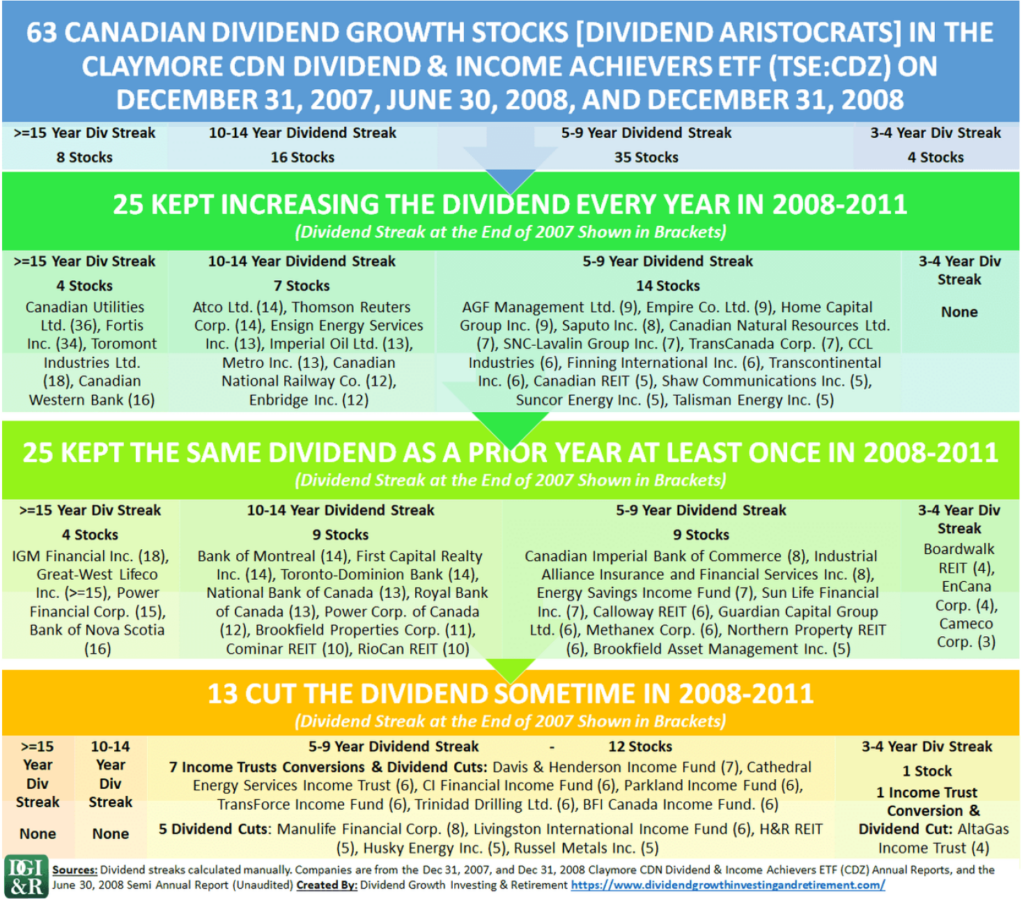
Last week, we highlighted the resilience of dividend stocks with long dividend growth streaks. Remarkably, none of the 24 Canadian companies with 10+ years of consecutive dividend growth heading into the Global Financial Crisis of 2008/2009 cut their dividends. This resilience offers peace of mind to income-focused investors, providing a reliable income stream no matter what challenges the future holds.

Another key aspect of quality dividend growth stocks is the dependability of their dividend increases. Once a company enters our universe of quality dividend growers, management typically prioritizes consistent dividend growth. It’s common to find these commitments clearly articulated in their dividend policies and growth strategies, often featured prominently in quarterly earnings reports.

For instance, here are a few examples from Q4 2023 earnings reports (from a year ago) of companies we track on ‘The List’. These examples underscore how management teams take their dividend-growth commitments seriously and make them a core element of their investor value proposition.

“Last year Fortis was proud to celebrate 50 consecutive years of increases in dividends paid to shareholders,” said Mr. Hutchens. “We remain focused on extending this track record as we execute our$25 billion five-year capital plan in support of our annual dividend growth guidance of 4-6% through 2028.

– Fortis Inc.

“We will continue to develop quality projects within our secured capital program, with approximately $7.0 billion of assets expected to be placed in service in 2024. Our commitment to limiting annual net capital expenditures to $6.0 to $7.0 billion, with a bias to the lower end beyond 2024, will not waver. We believe that adhering to our net capital expenditure limit beyond 2024 will allow TC Energy to continue delivering an attractive and sustainable dividend growth rate of three to five percent.”

-TC Energy

“This quarterly dividend reflects an increase of 7.1 per cent from the $0.3511 per share dividend declared one year earlier and consistent with our multi-year dividend growth program.”

-Telus

Let’s examine how these companies performed in 2024. The table below showcases the five-year dividend growth history for the companies featured on ‘The List,’ highlighting their commitment to rewarding shareholders.

As communicated, Fortis increased its 2024 dividend by 4.4%, Telus by 7.1%, and TC Energy by 3.2%.

Wrap Up


Predictable growth is the cornerstone of our strategy, offering peace of mind and long-term financial stability. It eliminates the need to ‘panic sell’ stocks during market turbulence, as our income remains reliable and steadily growing. By consistently outpacing inflation, this income ensures that we not only preserve but enhance our purchasing power over time.

A dependable income stream is fundamental to the success of our dividend growth strategy. As these companies increase payouts, their growing cash flows attract more investor interest, driving price appreciation and compounding our returns.

Become a PAID subscriber and start building your portfolio with confidence today. We do the work, and you stay in control!

DGI Scorecard

 
The List (2024)

The Magic Pants 2024 list includes 28 Canadian dividend growth stocks. Here are the criteria to be considered a candidate on ‘The List’:

  1. Dividend growth streak: 10 years or more.
  2. Market cap: Minimum one billion dollars.
  3. Diversification: Limit of five companies per sector, preferably two per industry.
  4. Cyclicality: Exclude REITs and pure-play energy companies due to high cyclicality.

Based on these criteria, companies are added or removed from ‘The List’ annually on January 1. Prices and dividends are updated weekly.

‘The List’ is not a portfolio but a coaching tool that helps us think about ideas and risk manage our model portfolio. We own some but not all the companies on ‘The List’. In other words, we might want to buy these companies when valuation looks attractive.

Our newsletter provides readers with a comprehensive insight into the implementation and advantages of our Canadian dividend growth investing strategy. This evidence-based, unbiased approach empowers DIY investors to outperform both actively managed dividend funds and passively managed indexes and dividend ETFs over longer-term horizons.

For those interested in something more, please upgrade to a paid subscriber; you get the enhanced weekly newsletter, access to premium content, full privileges on the new Substack website magicpants.substack.com and DGI alerts whenever we make stock transactions in our model portfolio.

Performance of ‘The List’


Last week, dividend growth of ‘The List’ stayed the same and has increased by +9.2% YTD (income). How much did your salary go up this year?

Last week, the average price return of ‘The List’ was up with a return of +15.0% YTD (capital).

Even though prices may fluctuate, the dependable growth in our income does not. Stay the course. You will be happy you did.

Last week’s best performers on ‘The List’ were Enghouse Systems Limited (ENGH-T), up +7.23%; Loblaw Companies Limited (L-T), up +5.51%; and Thomson Reuters (TRI-N), up +4.90%.

TD Bank (TD-T) was the worst performer last week, down -7.22%.

SYMBOL COMPANY YLD PRICE YTD % DIV YTD % STREAK
ATD-T Alimentation Couche-Tard Inc. 0.9% $81.38 6.0% $0.72 20.8% 14
BCE-T Bell Canada 10.5% $37.94 -30.0% $3.99 3.1% 15
BIP-N Brookfield Infrastructure Partners 4.7% $34.41 12.1% $1.62 5.9% 16
CCL-B-T CCL Industries Inc. 1.5% $77.00 33.1% $1.16 9.4% 22
CNR-T Canadian National Railway 2.2% $151.37 -9.3% $3.38 7.0% 28
CTC-A-T Canadian Tire 4.5% $154.07 11.2% $7.00 1.4% 13
CU-T Canadian Utilities Limited 5.0% $36.49 13.6% $1.81 0.9% 52
DOL-T Dollarama Inc. 0.2% $142.04 49.5% $0.35 30.7% 13
EMA-T Emera 5.2% $55.88 10.0% $2.88 3.3% 17
ENB-T Enbridge Inc. 6.0% $61.05 26.1% $3.66 3.1% 28
ENGH-T Enghouse Systems Limited 3.2% $31.28 -7.9% $1.00 18.3% 17
FNV-N Franco Nevada 1.2% $120.65 9.6% $1.44 5.9% 16
FTS-T Fortis Inc. 3.8% $62.98 14.8% $2.39 4.4% 50
IFC-T Intact Financial 1.8% $274.23 34.9% $4.84 10.0% 19
L-T Loblaw Companies Limited 1.0% $191.71 49.1% $1.92 10.0% 12
MFC-T Manulife Financial 3.5% $45.81 58.6% $1.60 9.6% 10
MGA-N Magna 4.2% $45.29 -18.4% $1.90 3.3% 14
MRU-T Metro Inc. 1.4% $93.20 36.0% $1.34 10.7% 29
RY-T Royal Bank of Canada 3.2% $178.27 34.0% $5.72 7.1% 13
SJ-T Stella-Jones Inc. 1.5% $74.45 -2.8% $1.12 21.7% 19
STN-T Stantec Inc. 0.7% $122.44 17.0% $0.83 7.8% 12
T-T Telus 6.9% $22.25 -6.2% $1.53 7.1% 20
TD-T TD Bank 5.6% $73.51 -13.2% $4.08 6.3% 13
TFII-N TFI International 1.1% $151.94 15.8% $1.60 10.3% 13
TIH-T Toromont Industries 1.7% $112.00 -0.7% $1.92 11.6% 34
TRI-N Thomson Reuters 1.3% $170.56 19.0% $2.16 12.5% 30
TRP-T TC Energy Corp. 5.6% $68.29 30.5% $3.84 3.2% 23
WCN-N Waste Connections 0.6% $190.35 28.5% $1.17 11.4% 14
Averages 3.2% 15.0% 9.2% 21

Note: Stocks ending in “-N” declare earnings and dividends in US dollars. To achieve currency consistency between dividends and share price for these stocks, we have shown dividends in US dollars and share price in US dollars (these stocks are listed on a US exchange). The dividends for their Canadian counterparts (-T) would be converted into CDN dollars and would fluctuate with the exchange rate.

PAID subscribers enjoy full access to our enhanced weekly newsletter, premium content, and easy-to-follow trade alerts so they can build DGI portfolios alongside ours. This service provides the resources to develop your DGI business plan confidently. We do the work; you stay in control!

It truly is the subscription that pays dividends!

The greatest investment you can make is in yourself. Are you ready to take that step? 

For more articles and the full newsletter, check us out on magicpants.substack.com.
MP Market Review – November 29, 2024

Last updated by BM on December 3, 2024

Summary


This is a weekly installment of our MP Market Review series, which provides insights and updates on Canadian dividend growth companies we monitor on ‘The List’. To read all our newsletters and premium content be sure to check us out on magicpants.substack.com.

  • This week, we find out how Canadian dividend growth stocks did in the Global Financial Crisis.
  • Last week, dividend growth of ‘The List’ was up and has increased by +9.2% YTD (income).
  • Last week, the price of ‘The List’ was up with a return of +14.2% YTD (capital).
  • Last week, there was one dividend announcement from a company on ‘The List’.
  • Last week, there was one earnings report from a company on ‘The List’.
  • This week, three companies on ‘The List’ is due to report earnings.

DGI Clipboard


“I like to see that the company was capable of increasing its dividends in the good times and the bad so that I’m more comfortable relying on that income in the future.”

– Lowell Miller, The Single Best Investment: Creating Wealth with Dividend Growth

Long Dividend Streaks = High Quality
Intro


If you’re new to dividend growth investing, you’re beginning to see that our success isn’t just about total returns—it’s about the steady growth of our dividend income year over year. The ability to rely on this growing income, no matter what the market is doing, provides a sense of stability and peace of mind, especially in retirement.

Looking back at how well Canadian stocks with 10+ years of dividend growth streaks performed during the Global Financial Crisis solidified my confidence in this strategy. Despite one of the most challenging economic periods in recent history, their dividend income held strong. That resilience showed me that dividend growth investing isn’t just a strategy—it’s a reliable foundation for long-term financial security.

To illustrate, let’s look back at the Global Financial Crisis of 2008/2009, a period of extreme financial stress:

At the end of 2007, before the crisis began, there were 24 Canadian stocks with dividend growth streaks of 10+ years.

Of these 24 companies, how many do you think cut their dividends during the crisis?

The answer might surprise you.

The correct answer is none!

It’s worth noting that during this period, 57% of dividend-paying companies worldwide either reduced (43%) or eliminated (14%) their dividends. Following the 2008 global market decline, aggregate dividends dropped by 20%.

This highlights a crucial distinction: dividend-paying stocks are not the same as dividend growth stocks. Dividend growth companies are typically higher-quality names, with stronger fundamentals and a proven commitment to rewarding shareholders over time.

Wrap Up


By investing only in companies with a minimum of 10 consecutive years of dividend growth, we ensure our portfolio is built around high-quality businesses. These are the companies that demonstrate resilience, discipline, and the ability to navigate challenging economic times—exactly what you want when markets turn turbulent.

The good news? You don’t have to search far to find these reliable performers. We’ve done the work for you. Check out ‘The List’ right here on our blog, where we highlight companies with proven dividend growth streaks of 10+ years.

Become a PAID subscriber and start building your portfolio with confidence today. We do the work you stay in control!

DGI Scorecard

 
The List (2024)


The Magic Pants 2024 list includes 28 Canadian dividend growth stocks. Here are the criteria to be considered a candidate on ‘The List’:

  1. Dividend growth streak: 10 years or more.
  2. Market cap: Minimum one billion dollars.
  3. Diversification: Limit of five companies per sector, preferably two per industry.
  4. Cyclicality: Exclude REITs and pure-play energy companies due to high cyclicality.

Based on these criteria, companies are added or removed from ‘The List’ annually on January 1. Prices and dividends are updated weekly.

‘The List’ is not a portfolio; it is a coaching tool that helps us think about ideas and risk manage our model portfolio. We own some but not all the companies on ‘The List’.

Our newsletter provides readers with a comprehensive insight into the implementation and advantages of our Canadian dividend growth investing strategy. This evidence-based, unbiased approach empowers DIY investors to outperform both actively managed dividend funds and passively managed indexes and dividend ETFs over longer-term horizons.

For those interested in something more, please upgrade to a paid subscriber; you get the enhanced weekly newsletter, access to premium content, full privileges on the new Substack website magicpants.substack.com and DGI alerts whenever we make stock transactions in our model portfolio.

Performance of ‘The List’


Last week, dividend growth of ‘The List’ was up and has increased by +9.2% YTD (income). How much did your salary go up this year?

Last week, the average price return of ‘The List’ was up with a return of +14.2% YTD (capital).

Even though prices may fluctuate, the dependable growth in our income does not. Stay the course. You will be happy you did.

Last week’s best performers on ‘The List’ were Alimentation Couche-Tard Inc. (ATD-T), up +4.22%; Emera (EMA-T), up +2.89%; and Canadian Tire (CTC-A-T), up +2.80%.

TC Energy Corp. (TRP-T) was the worst performer last week, down -2.00%.

SYMBOL COMPANY YLD PRICE YTD % DIV YTD % STREAK
ATD-T Alimentation Couche-Tard Inc. 0.9% $81.91 6.7% $0.72 20.8% 14
BCE-T Bell Canada 10.5% $37.90 -30.0% $3.99 3.1% 15
BIP-N Brookfield Infrastructure Partners 4.6% $34.97 13.9% $1.62 5.9% 16
CCL-B-T CCL Industries Inc. 1.5% $77.61 34.2% $1.16 9.4% 22
CNR-T Canadian National Railway 2.2% $156.34 -6.3% $3.38 7.0% 28
CTC-A-T Canadian Tire 4.5% $154.37 11.4% $7.00 1.4% 13
CU-T Canadian Utilities Limited 5.0% $35.94 11.9% $1.81 0.9% 52
DOL-T Dollarama Inc. 0.2% $145.84 53.5% $0.35 30.7% 13
EMA-T Emera 5.4% $53.42 5.2% $2.88 3.3% 17
ENB-T Enbridge Inc. 6.0% $60.57 25.1% $3.66 3.1% 28
ENGH-T Enghouse Systems Limited 3.4% $29.17 -14.1% $1.00 18.3% 17
FNV-N Franco Nevada 1.2% $122.62 11.3% $1.44 5.9% 16
FTS-T Fortis Inc. 3.8% $62.59 14.1% $2.39 4.4% 50
IFC-T Intact Financial 1.8% $266.67 31.2% $4.84 10.0% 19
L-T Loblaw Companies Limited 1.1% $181.70 41.3% $1.92 10.0% 12
MFC-T Manulife Financial 3.6% $45.07 56.1% $1.60 9.6% 10
MGA-N Magna 4.2% $45.14 -18.7% $1.90 3.3% 14
MRU-T Metro Inc. 1.5% $91.23 33.2% $1.34 10.7% 29
RY-T Royal Bank of Canada 3.2% $176.16 32.4% $5.72 7.1% 13
SJ-T Stella-Jones Inc. 1.6% $71.54 -6.6% $1.12 21.7% 19
STN-T Stantec Inc. 0.7% $121.27 15.9% $0.83 7.8% 12
T-T Telus 7.0% $21.80 -8.1% $1.53 7.1% 20
TD-T TD Bank 5.1% $79.23 -6.4% $4.08 6.3% 13
TFII-N TFI International 1.1% $151.68 15.6% $1.60 10.3% 13
TIH-T Toromont Industries 1.7% $115.00 1.9% $1.92 11.6% 34
TRI-N Thomson Reuters 1.3% $162.59 13.4% $2.16 12.5% 30
TRP-T TC Energy Corp. 5.6% $68.26 30.5% $3.84 3.2% 23
WCN-N Waste Connections 0.6% $192.47 29.9% $1.17 11.4% 14
Averages 3.2% 14.2% 9.2% 21

Note: Stocks ending in “-N” declare earnings and dividends in US dollars. To achieve currency consistency between dividends and share price for these stocks, we have shown dividends in US dollars and share price in US dollars (these stocks are listed on a US exchange). The dividends for their Canadian counterparts (-T) would be converted into CDN dollars and would fluctuate with the exchange rate.

PAID subscribers enjoy full access to our enhanced weekly newsletter, premium content, and easy-to-follow trade alerts so they can build DGI portfolios alongside ours. This service provides the resources to develop your DGI business plan confidently. We do the work; you stay in control!

It truly is the subscription that pays dividends!

The greatest investment you can make is in yourself. Are you ready to take that step? 

For more articles and the full newsletter, check us out on magicpants.substack.com.

MP Market Review – November 22, 2024

Last updated by BM on November 26, 2024

Summary


This is a weekly installment of our MP Market Review series, which provides insights and updates on Canadian dividend growth companies we monitor on ‘The List’. To read all our newsletters and premium content be sure to check us out on magicpants.substack.com.

  • This week, we ask: Should retirees choose dividend stocks over bonds?
  • Last week, dividend growth of ‘The List’ stayed the course and has increased by +9.1% YTD (income).
  • Last week, the price of ‘The List’ was up with a return of +13.6% YTD (capital).
  • Last week, there were no dividend announcements from companies on ‘The List’.
  • Last week, there was an earnings report from a company on ‘The List’.
  • This week, one company on ‘The List’ is due to report earnings.

DGI Clipboard


“Cash is not a safe investment, is not a safe place because it will be taxed by inflation.”

– Ray Dalio

The Question Isn’t When You Retire But How!
Intro


A couple of months ago, in the ‘DGI Clipboard’ section of our weekly newsletter, I wrote about How to Own Inflation: Why Dividend Growth is the True Hedge. In that article, I demonstrated how inflation erodes purchasing power and explained why owning a portfolio of dividend growth stocks is one of the best ways to combat this challenge. Unlike bonds and T-bills, which don’t grow their income over time, a dividend growth portfolio not only increases its income but appreciates in value—this was the key point we emphasized.

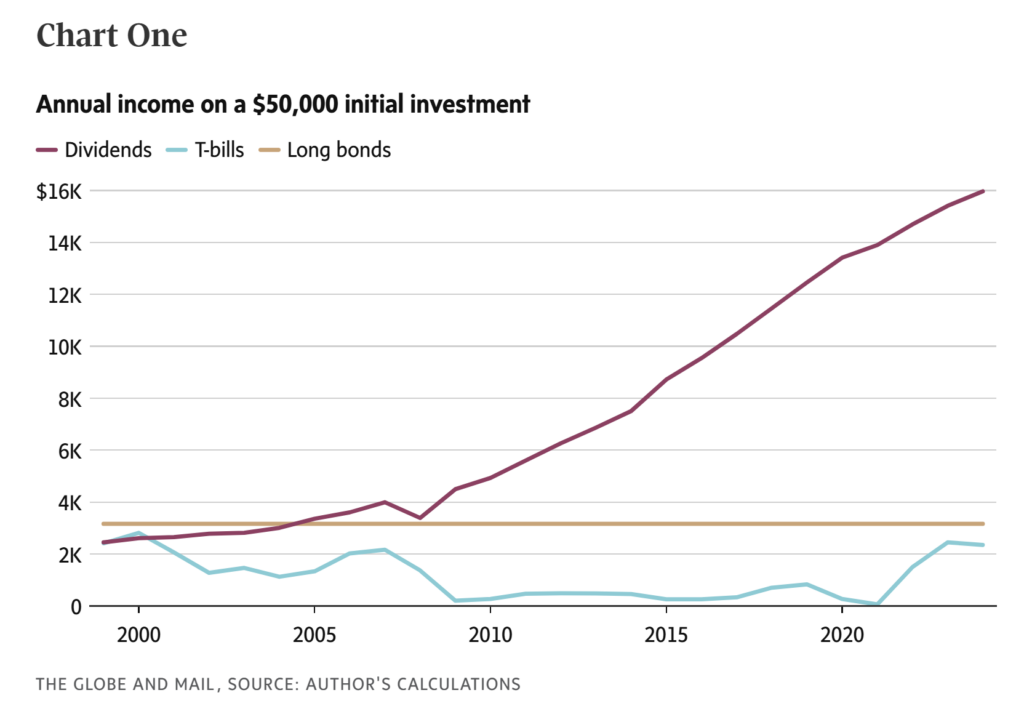
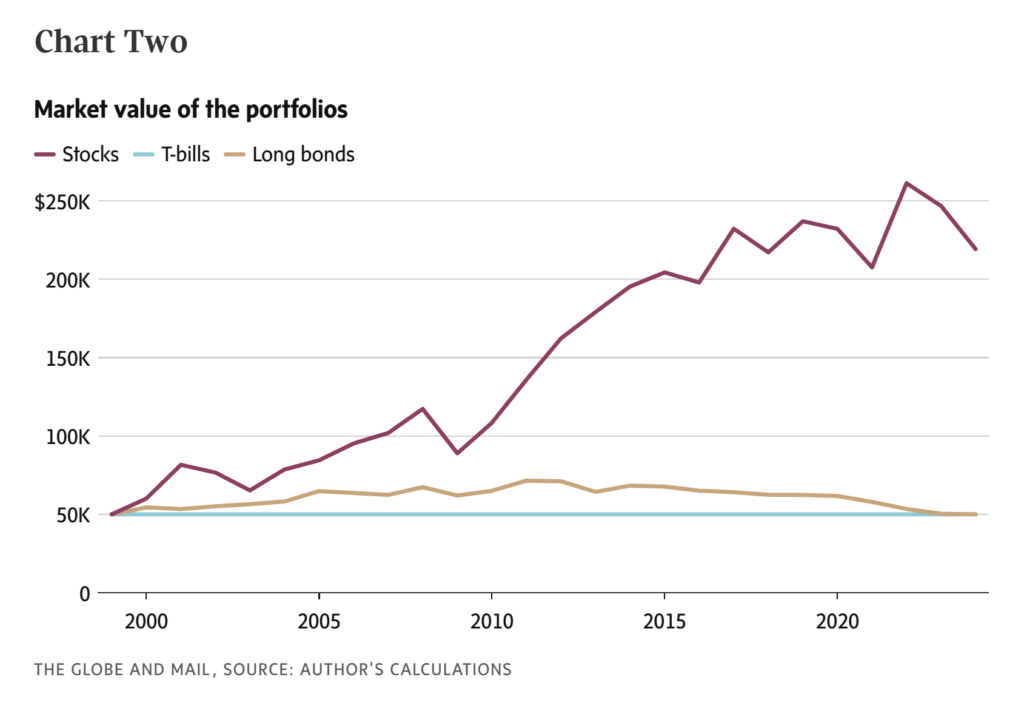
This week, The Globe and Mail published a column exploring a similar theme. It compared the performance of dividend growth stocks to bonds and T-bills over the past 25 years, posing the question: Should retirees buy dividend stocks instead of bonds?

First a little column background:

To answer the question with historical data, the author picked the year 1999 as a starting point and created both a bond portfolio and a stock portfolio. This year was particularly favorable for government bonds, as yields were high and on a downward trajectory, benefiting bond prices. However, it was a challenging starting point for stocks due to the significant market disruptions that followed: the dot-com bubble burst in 2001-2002, the Great Recession of 2008-2009, and the sharp but short-lived market downturn during the early months of the COVID-19 pandemic.

The $50,000 stock portfolio was allocated across three companies: BCE-T (a telecom), TD-T (a Big Five bank), and ENB-T (a pipeline in the energy sector). While not necessarily the top performers in their sectors, these companies were chosen for their reputation as reliable dividend payers and provided some diversification.

The bond portfolio also consisted of $50,000, invested in long-term Canadian government bonds purchased in 1999. At the time, these bonds offered a yield of over 6%, which was locked in for the full 25-year term.

As a third option, the author also included 91-day Treasury bills (T-bills).

The author brilliantly proves his point with just two charts, leaving you to question the appeal of fixed income for long-term retirement investing.

Stocks (dividend growth stocks) are the clear winner in both income and capital growth. We already know it’s the growing income/yield that drives total return. Soon many others will do what we do.

By year 25, your initial $50K investment yields $16K annually in dividends—a 32% return on the original amount in this year alone—and it’s still growing!

Wrap Up


The charts in this article can be replicated for any period over the last twenty years using other quality dividend growth stocks from ‘The List.’ While we don’t recommend holding just three stocks, a diversified portfolio of 15-20 quality dividend growers would yield similar results. There is no need for an ETF, a wealth manager or an adviser.

Investing in the stock market doesn’t have to be a high-risk endeavor. Our growing yield strategy is ‘how’ to play the long-term horizon of retirement investing. Purchasing individual, quality dividend growth stocks at sensible valuations and holding them for their steadily growing income remains one of the most effective strategies to preserve purchasing power and achieve above-average total returns.

The complete Globe and Mail article referenced above is available for Globe subscribers in the ‘DGI News’ section later in this newsletter.

DGI Scorecard

 
The List (2024)


The Magic Pants 2024 list includes 28 Canadian dividend growth stocks. Here are the criteria to be considered a candidate on ‘The List’:

  1. Dividend growth streak: 10 years or more.
  2. Market cap: Minimum one billion dollars.
  3. Diversification: Limit of five companies per sector, preferably two per industry.
  4. Cyclicality: Exclude REITs and pure-play energy companies due to high cyclicality.

Based on these criteria, companies are added or removed from ‘The List’ annually on January 1. Prices and dividends are updated weekly.

‘The List’ is not a portfolio; it is a coaching tool that helps us think about ideas and risk manage our model portfolio. We own some but not all the companies on ‘The List’.

Our newsletter provides readers with a comprehensive insight into the implementation and advantages of our Canadian dividend growth investing strategy. This evidence-based, unbiased approach empowers DIY investors to outperform both actively managed dividend funds and passively managed indexes and dividend ETFs over longer-term horizons.

For those interested in something more, please upgrade to a paid subscriber; you get the enhanced weekly newsletter, access to premium content, full privileges on the new Substack website magicpants.substack.com and DGI alerts whenever we make stock transactions in our model portfolio.

Performance of ‘The List’


Last week, dividend growth of ‘The List’ stayed the course and has increased by +9.1% YTD (income). How much did your salary go up this year?

Last week, the average price return of ‘The List’ was up with a return of +13.6% YTD (capital).

Even though prices may fluctuate, the dependable growth in our income does not. Stay the course. You will be happy you did.

Last week’s best performers on ‘The List’ were Franco Nevada (FNV-N), up +8.55%; Metro Inc. (MRU-T), up +3.76%; and Stella-Jones Inc. (SJ-T), up +3.71%.

Canadian Tire (CTC-A-T) was the worst performer last week, down -1.82%.

SYMBOL COMPANY YLD PRICE YTD % DIV YTD % STREAK
ATD-T Alimentation Couche-Tard Inc. 0.9% $78.59 2.4% $0.70 17.4% 14
BCE-T Bell Canada 10.7% $37.42 -30.9% $3.99 3.1% 15
BIP-N Brookfield Infrastructure Partners 4.7% $34.74 13.2% $1.62 5.9% 16
CCL-B-T CCL Industries Inc. 1.5% $77.68 34.3% $1.16 9.4% 22
CNR-T Canadian National Railway 2.2% $155.44 -6.8% $3.38 7.0% 28
CTC-A-T Canadian Tire 4.7% $150.16 8.3% $7.00 1.4% 13
CU-T Canadian Utilities Limited 5.0% $36.10 12.4% $1.81 0.9% 52
DOL-T Dollarama Inc. 0.2% $145.51 53.1% $0.35 30.7% 13
EMA-T Emera 5.5% $51.92 2.2% $2.88 3.3% 17
ENB-T Enbridge Inc. 6.1% $60.47 24.9% $3.66 3.1% 28
ENGH-T Enghouse Systems Limited 3.4% $29.27 -13.8% $1.00 18.3% 17
FNV-N Franco Nevada 1.2% $123.69 12.3% $1.44 5.9% 16
FTS-T Fortis Inc. 3.8% $63.13 15.1% $2.39 4.4% 50
IFC-T Intact Financial 1.8% $271.68 33.6% $4.84 10.0% 19
L-T Loblaw Companies Limited 1.1% $178.29 38.7% $1.92 10.0% 12
MFC-T Manulife Financial 3.5% $45.37 57.1% $1.60 9.6% 10
MGA-N Magna 4.2% $45.08 -18.8% $1.90 3.3% 14
MRU-T Metro Inc. 1.5% $89.73 31.0% $1.34 10.7% 29
RY-T Royal Bank of Canada 3.3% $174.71 31.3% $5.72 7.1% 13
SJ-T Stella-Jones Inc. 1.6% $70.69 -7.7% $1.12 21.7% 19
STN-T Stantec Inc. 0.7% $120.06 14.7% $0.83 7.8% 12
T-T Telus 7.2% $21.26 -10.4% $1.53 7.1% 20
TD-T TD Bank 5.2% $78.51 -7.3% $4.08 6.3% 13
TFII-N TFI International 1.1% $148.73 13.4% $1.60 10.3% 13
TIH-T Toromont Industries 1.6% $116.74 3.5% $1.92 11.6% 34
TRI-N Thomson Reuters 1.3% $161.20 12.5% $2.16 12.5% 30
TRP-T TC Energy Corp. 5.5% $69.65 33.1% $3.84 3.2% 23
WCN-N Waste Connections 0.6% $189.87 28.2% $1.17 11.4% 14
Averages 3.2% 13.6% 9.1% 21

Note: Stocks ending in “-N” declare earnings and dividends in US dollars. To achieve currency consistency between dividends and share price for these stocks, we have shown dividends in US dollars and share price in US dollars (these stocks are listed on a US exchange). The dividends for their Canadian counterparts (-T) would be converted into CDN dollars and would fluctuate with the exchange rate.

PAID subscribers enjoy full access to our enhanced weekly newsletter, premium content, and easy-to-follow trade alerts so they can build DGI portfolios alongside ours. This service provides the resources to develop your DGI business plan confidently. We do the work; you stay in control!

It truly is the subscription that pays dividends!

The greatest investment you can make is in yourself. Are you ready to take that step? 

For more articles and the full newsletter, check us out on magicpants.substack.com.
MP Market Review – November 15, 2024

Last updated by BM on November 19, 2024

Summary


This is a weekly installment of our MP Market Review series, which provides insights and updates on Canadian dividend growth companies we monitor on ‘The List’. To read all our newsletters and premium content be sure to check us out on magicpants.substack.com.

  • This week, we reveal our ‘Timely Ten’ most undervalued dividend growth companies.
  • Last week, dividend growth of ‘The List’ was up and has increased by +9.1% YTD (income).
  • Last week, the price of ‘The List’ was down with a return of +12.2% YTD (capital).
  • Last week, there were no dividend announcements from companies on ‘The List’.
  • Last week, there were three earnings reports from companies on ‘The List’.
  • This week, one company on ‘The List’ is due to report earnings.

DGI Clipboard


“Some of the most undervalued assets on Wall Street are history books.”

-Morgan Housel, author of The Psychology of Money

Timely Ten: Expanding Our Investable Universe
Intro


This month, we’ve expanded our ‘Timely Ten’ to include a selection of U.S. companies we actively monitor. While we track far more than the 30 U.S. companies featured on this list, we’ve streamlined it for consistency with our Canadian counterpart. Broadening your investable universe offers no shortage of compelling opportunities to consider.

Here’s a recap on how we select our ‘Timely Ten’:

Step three in our process involves monitoring our quality dividend growers regularly, which can become quite challenging depending on the number of companies we track. Fortunately, we rely on ‘The List’ instead of the vast array of stocks in the index, which streamlines our task. Nevertheless, we continually seek methods to enhance our efficiency. Through dividend yield theory, we’ve discovered an approach that has proven remarkably effective in aiding us with our efforts over the years.

Dividend yield theory is a simple and intuitive approach to valuing dividend growth stocks. It suggests that the dividend yield of quality dividend growth stocks tends to revert to the mean over time, assuming that the underlying business model remains stable. In practical terms, if a stock pays a dividend yield above its ten-year average annual yield, its price will likely increase to return the yield to its historical average. Knowing that price and yield go in opposite directions, this theory helps us find stocks poised for a positive price correction.

We have pre-screened our candidates using the criteria we initially laid out in building ‘The List’. This helps us considerably narrow the universe of investable stocks.

  1. Dividend growth streak: 10 years or more.
  2. Market cap: Minimum one billion dollars.
  3. Diversification: Limit of five companies per sector, preferably two per industry.
  4. Cyclicality: Exclude REITs and pure-play energy companies due to high cyclicality.

Next, we rank ‘The List’ by how significantly each stock is priced below its fair value (Low Price), as calculated using dividend yield theory. To determine fair value, divide the current dividend by what you consider to be the stock’s historically high yield.

All companies above the thick black line have a current price below fair value (sensibly priced). The stocks above the thick black line make up our ‘Timely Ten’.

Wrap Up


When making investment decisions, always prioritize a company’s ‘quality’ over a ‘sensible price’. For more details on stock selection and our quality indicators, refer to our sample Business Plan.

If you’re a new investor looking to build positions in the ‘Timely Ten,’ now is the perfect opportunity to start your research and take action. For a more guided approach, consider becoming a PAID subscriber to gain access to DGI Alerts, which notify you whenever we make a trade in our model portfolios, allowing you to invest alongside us with confidence.

DGI Scorecard

 
The List (2024)


The Magic Pants 2024 list includes 28 Canadian dividend growth stocks. Here are the criteria to be considered a candidate on ‘The List’:

  1. Dividend growth streak: 10 years or more.
  2. Market cap: Minimum one billion dollars.
  3. Diversification: Limit of five companies per sector, preferably two per industry.
  4. Cyclicality: Exclude REITs and pure-play energy companies due to high cyclicality.

Based on these criteria, companies are added or removed from ‘The List’ annually on January 1. Prices and dividends are updated weekly.

‘The List’ is not a portfolio; it is a coaching tool that helps us think about ideas and risk manage our model portfolio. We own some but not all the companies on ‘The List’.

Our newsletter provides readers with a comprehensive insight into the implementation and advantages of our Canadian dividend growth investing strategy. This evidence-based, unbiased approach empowers DIY investors to outperform both actively managed dividend funds and passively managed indexes and dividend ETFs over longer-term horizons.

For those interested in something more, please upgrade to a paid subscriber; you get the enhanced weekly newsletter, access to premium content, full privileges on the new Substack website magicpants.substack.com and DGI alerts whenever we make stock transactions in our model portfolio.

Performance of ‘The List’


Last week, dividend growth of ‘The List’ was up slightly and has increased by +9.1% YTD (income). How much did your salary go up this year?

Last week, the average price return of ‘The List’ was down with a return of +12.2% YTD (capital).

Even though prices may fluctuate, the dependable growth in our income does not. Stay the course. You will be happy you did.

Last week’s best performers on ‘The List’ were Manulife Financial (MFC-T), up +4.09%; Stantec Inc. (STN-T), up +3.42%; and Alimentation Couche-Tard Inc. (ATD-T), up +3.04%.

Franco Nevada (FNV-N) was the worst performer last week, down -6.93%.

SYMBOL COMPANY YLD PRICE YTD % DIV YTD % STREAK
ATD-T Alimentation Couche-Tard Inc. 0.9% $79.37 3.4% $0.70 17.4% 14
BCE-T Bell Canada 10.6% $37.81 -30.2% $3.99 3.1% 15
BIP-N Brookfield Infrastructure Partners 4.7% $34.20 11.4% $1.62 5.9% 16
CCL-B-T CCL Industries Inc. 1.5% $77.12 33.3% $1.16 9.4% 22
CNR-T Canadian National Railway 2.2% $153.35 -8.1% $3.38 7.0% 28
CTC-A-T Canadian Tire 4.6% $152.95 10.4% $7.00 1.4% 13
CU-T Canadian Utilities Limited 5.2% $34.98 8.9% $1.81 0.9% 52
DOL-T Dollarama Inc. 0.2% $148.07 55.8% $0.35 30.7% 13
EMA-T Emera 5.7% $50.76 -0.1% $2.88 3.3% 17
ENB-T Enbridge Inc. 6.2% $59.40 22.7% $3.66 3.1% 28
ENGH-T Enghouse Systems Limited 3.4% $29.60 -12.9% $1.00 18.3% 17
FNV-N Franco Nevada 1.3% $113.95 3.5% $1.44 5.9% 16
FTS-T Fortis Inc. 3.8% $62.21 13.4% $2.39 4.4% 50
IFC-T Intact Financial 1.8% $266.26 31.0% $4.84 10.0% 19
L-T Loblaw Companies Limited 1.1% $181.49 41.2% $1.92 10.0% 12
MFC-T Manulife Financial 3.5% $46.05 59.5% $1.60 9.6% 10
MGA-N Magna 4.3% $43.90 -20.9% $1.90 3.3% 14
MRU-T Metro Inc. 1.5% $86.48 26.2% $1.34 10.7% 29
RY-T Royal Bank of Canada 3.3% $171.13 28.6% $5.72 7.1% 13
SJ-T Stella-Jones Inc. 1.6% $68.16 -11.0% $1.12 21.7% 19
STN-T Stantec Inc. 0.7% $116.00 10.8% $0.83 7.8% 12
T-T Telus 7.2% $21.39 -9.8% $1.53 7.1% 20
TD-T TD Bank 5.2% $78.80 -7.0% $4.08 6.3% 13
TFII-N TFI International 1.1% $143.66 9.5% $1.60 10.3% 13
TIH-T Toromont Industries 1.6% $117.34 4.0% $1.92 11.6% 34
TRI-N Thomson Reuters 1.3% $161.71 12.8% $2.16 12.5% 30
TRP-T TC Energy Corp. 5.6% $69.05 32.0% $3.84 3.2% 23
WCN-N Waste Connections 0.6% $183.50 23.9% $1.17 11.4% 14
Averages 3.2% 12.2% 9.1% 21

Note: Stocks ending in “-N” declare earnings and dividends in US dollars. To achieve currency consistency between dividends and share price for these stocks, we have shown dividends in US dollars and share price in US dollars (these stocks are listed on a US exchange). The dividends for their Canadian counterparts (-T) would be converted into CDN dollars and would fluctuate with the exchange rate.

For more articles and the full newsletter, check us out on magicpants.substack.com. Don’t miss this opportunity to stay informed and make the most of your investments!
MP Market Review – November 8, 2024

Last updated by BM on November 12, 2024

Summary


This is a weekly installment of our MP Market Review series, which provides insights and updates on Canadian dividend growth companies we monitor on ‘The List’. To read all our newsletters and premium content be sure to check us out on magicpants.substack.com.
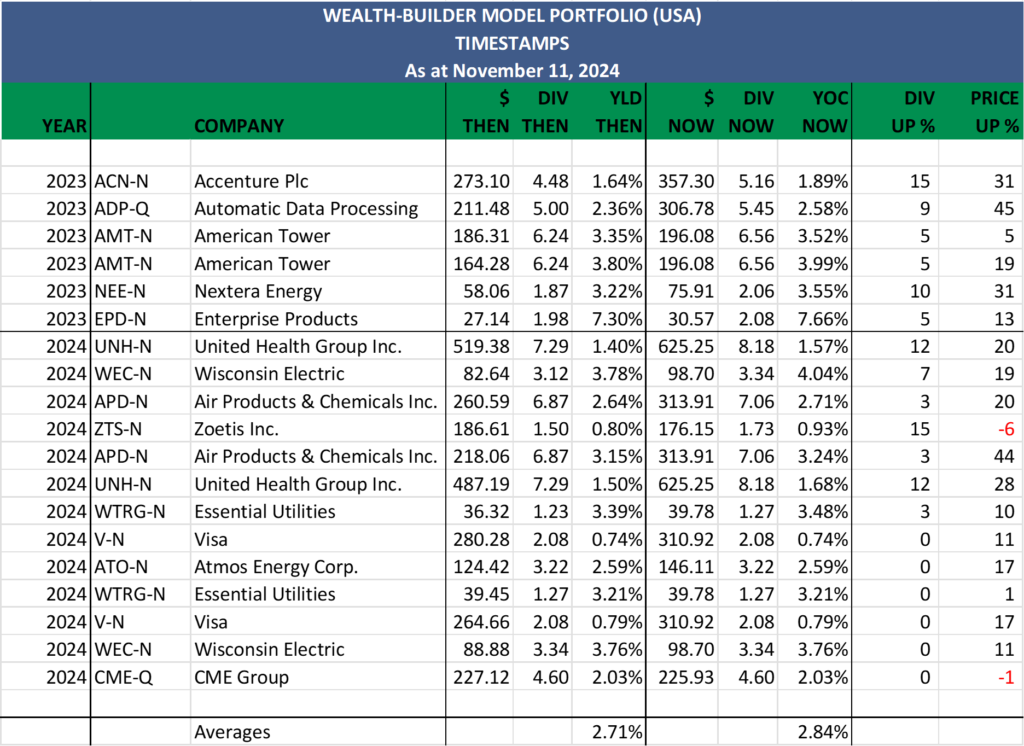
  • This week, we reveal the performance of our MP Wealth Builder Model Portfolio (USA).
  • Last week, dividend growth of ‘The List’ stayed the same and has increased by +9.0% YTD (income).
  • Last week, the price of ‘The List’ was up with a return of +13.0% YTD (capital).
  • Last week, there were two dividend announcements from companies on ‘The List’.
  • Last week, there were fourteen earnings reports from companies on ‘The List’.
  • This week, three companies on ‘The List’ are due to report earnings.

DGI Clipboard


”Missing the train” vs. ”losing your money”. There are a lot of trains, but if your money is gone, it’s over.

– Paul Tudor Jones

Growing Dividends, Growing Wealth: The Strong Returns of Our U.S. Portfolio
Intro


Major indices, including the S&P 500 and Dow Jones, have surged to new highs, reflecting investor optimism around the incoming Trump administration’s economic policies. Here in Canada, our markets experienced a similar boost following Donald Trump’s election victory, but our markets never seem to quite keep up.

This week, I’m excited to welcome our new subscribers from south of the border! Our reach is growing, and while much of our analysis focuses on Canadian dividend growth companies, the principles of dividend growth investing are just as relevant in the U.S. as they are in Canada. The key difference? The U.S. market offers roughly ten times the number of quality dividend growth companies to invest in.

In this edition of the MP Market Review, readers will get a sneak peek at our soon-to-be-public MP Wealth-Builder Model Portfolio (USA). I launched this portfolio for family and friends in May 2023, following a business plan similar to the one in our ‘Premium Content’ section. The main difference lies in the position sizing strategy. When I post the portfolio performance to the blog, I will include the U.S. business plan as well.

To provide accountability, transparency, and trust in our process, we ‘timestamp’ all our trades. Each quarter, we show each purchase transaction to date to see how we are doing and the effects a growing dividend has on price. We don’t hide our history. When we’re wrong, it’s right there for all to see – every win, loss, and tie.

Portfolio To Date (USA)

To date, we’ve invested in thirteen high-quality dividend growth companies spanning seven U.S. sectors. Our strategy prioritizes top-tier companies within each sector, ensuring focused yet ample diversification.

Wrap Up


Since inception, our USA portfolio has achieved an impressive 25% annualized return (including dividends) without the volatility of FANG or AI stocks. This highlights the strength of our strategy to grow income and capital steadily while delivering above-average total returns.

For American investors, our approach mirrors the favourable tax treatment of eligible Canadian dividends that Canadians enjoy, making it an attractive option to explore. While I’ll begin posting performance updates for the USA portfolio on the blog, I won’t have time to write detailed articles about every trade. However, I’m happy to send timely trade alerts to those interested. Let me know in the comments section if this is something of interest to you.

DGI Scorecard

 
The List (2024)


The Magic Pants 2024 list includes 28 Canadian dividend growth stocks. Here are the criteria to be considered a candidate on ‘The List’:

  1. Dividend growth streak: 10 years or more.
  2. Market cap: Minimum one billion dollars.
  3. Diversification: Limit of five companies per sector, preferably two per industry.
  4. Cyclicality: Exclude REITs and pure-play energy companies due to high cyclicality.

Based on these criteria, companies are added or removed from ‘The List’ annually on January 1. Prices and dividends are updated weekly.

‘The List’ is not a portfolio; it is a coaching tool that helps us think about ideas and risk manage our model portfolio. We own some but not all the companies on ‘The List’.

Our newsletter provides readers with a comprehensive insight into the implementation and advantages of our Canadian dividend growth investing strategy. This evidence-based, unbiased approach empowers DIY investors to outperform both actively managed dividend funds and passively managed indexes and dividend ETFs over longer-term horizons.

For those interested in something more, please upgrade to a paid subscriber; you get the enhanced weekly newsletter, access to premium content, full privileges on the new Substack website magicpants.substack.com and DGI alerts whenever we make stock transactions in our model portfolio.

Performance of ‘The List’


Last week, dividend growth of ‘The List’ stayed the same and has increased by +9.0% YTD (income). How much did your salary go up this year?

Last week, the average price return of ‘The List’ was up with a return of +13.0% YTD (capital).

Even though prices may fluctuate, the dependable growth in our income does not. Stay the course. You will be happy you did.

Last week’s best performers on ‘The List’ were TFI International (TFII-N), up +10.21%; Manulife Financial (MFC-T), up +7.56%; and Alimentation Couche-Tard Inc. (ATD-T), up +5.46%.

Stella-Jones Inc. (SJ-T) was the worst performer last week, down -16.81%.

SYMBOL COMPANY YLD PRICE YTD % DIV YTD % STREAK
ATD-T Alimentation Couche-Tard Inc. 0.9% $77.03 0.4% $0.70 17.4% 14
BCE-T Bell Canada 10.1% $39.49 -27.1% $3.99 3.1% 15
BIP-N Brookfield Infrastructure Partners 4.7% $34.29 11.7% $1.62 5.9% 16
CCL-B-T CCL Industries Inc. 1.4% $81.19 40.4% $1.16 9.4% 22
CNR-T Canadian National Railway 2.2% $154.15 -7.6% $3.38 7.0% 28
CTC-A-T Canadian Tire 4.5% $154.00 11.1% $7.00 1.4% 13
CU-T Canadian Utilities Limited 5.2% $34.64 7.8% $1.81 0.9% 52
DOL-T Dollarama Inc. 0.2% $151.00 58.9% $0.35 29.5% 13
EMA-T Emera 5.7% $50.19 -1.2% $2.88 3.2% 17
ENB-T Enbridge Inc. 6.2% $58.93 21.8% $3.66 3.1% 28
ENGH-T Enghouse Systems Limited 3.3% $30.09 -11.4% $1.00 18.3% 17
FNV-N Franco Nevada 1.2% $122.44 11.2% $1.44 5.9% 16
FTS-T Fortis Inc. 3.9% $61.47 12.1% $2.39 4.4% 50
IFC-T Intact Financial 1.8% $266.23 30.9% $4.84 10.0% 19
L-T Loblaw Companies Limited 1.0% $185.51 44.3% $1.92 10.0% 12
MFC-T Manulife Financial 3.6% $44.24 53.2% $1.60 9.6% 10
MGA-N Magna 4.4% $43.40 -21.8% $1.90 3.3% 14
MRU-T Metro Inc. 1.6% $85.74 25.1% $1.34 10.7% 29
RY-T Royal Bank of Canada 3.3% $172.04 29.3% $5.72 7.1% 13
SJ-T Stella-Jones Inc. 1.5% $72.37 -5.5% $1.12 21.7% 19
STN-T Stantec Inc. 0.7% $112.16 7.2% $0.83 7.8% 12
T-T Telus 7.0% $21.81 -8.1% $1.53 7.1% 20
TD-T TD Bank 5.2% $78.91 -6.8% $4.08 6.3% 13
TFII-N TFI International 1.1% $145.55 10.9% $1.60 10.3% 13
TIH-T Toromont Industries 1.6% $118.65 5.2% $1.92 11.6% 34
TRI-N Thomson Reuters 1.3% $168.23 17.4% $2.16 12.5% 30
TRP-T TC Energy Corp. 5.7% $67.82 29.7% $3.84 3.2% 23
WCN-N Waste Connections 0.6% $184.04 24.2% $1.17 11.4% 14
Averages 3.2% 13.0% 9.0% 21

Note: Stocks ending in “-N” declare earnings and dividends in US dollars. To achieve currency consistency between dividends and share price for these stocks, we have shown dividends in US dollars and share price in US dollars (these stocks are listed on a US exchange). The dividends for their Canadian counterparts (-T) would be converted into CDN dollars and would fluctuate with the exchange rate.

For more articles and the full newsletter, check us out on magicpants.substack.com. Don’t miss this opportunity to stay informed and make the most of your investments!

MP Market Review – November 1, 2024

Last updated by BM on November 5, 2024

Summary


This is a weekly installment of our MP Market Review series, which provides insights and updates on Canadian dividend growth companies we monitor on ‘The List’. To read all our newsletters and premium content be sure to check us out on magicpants.substack.com.
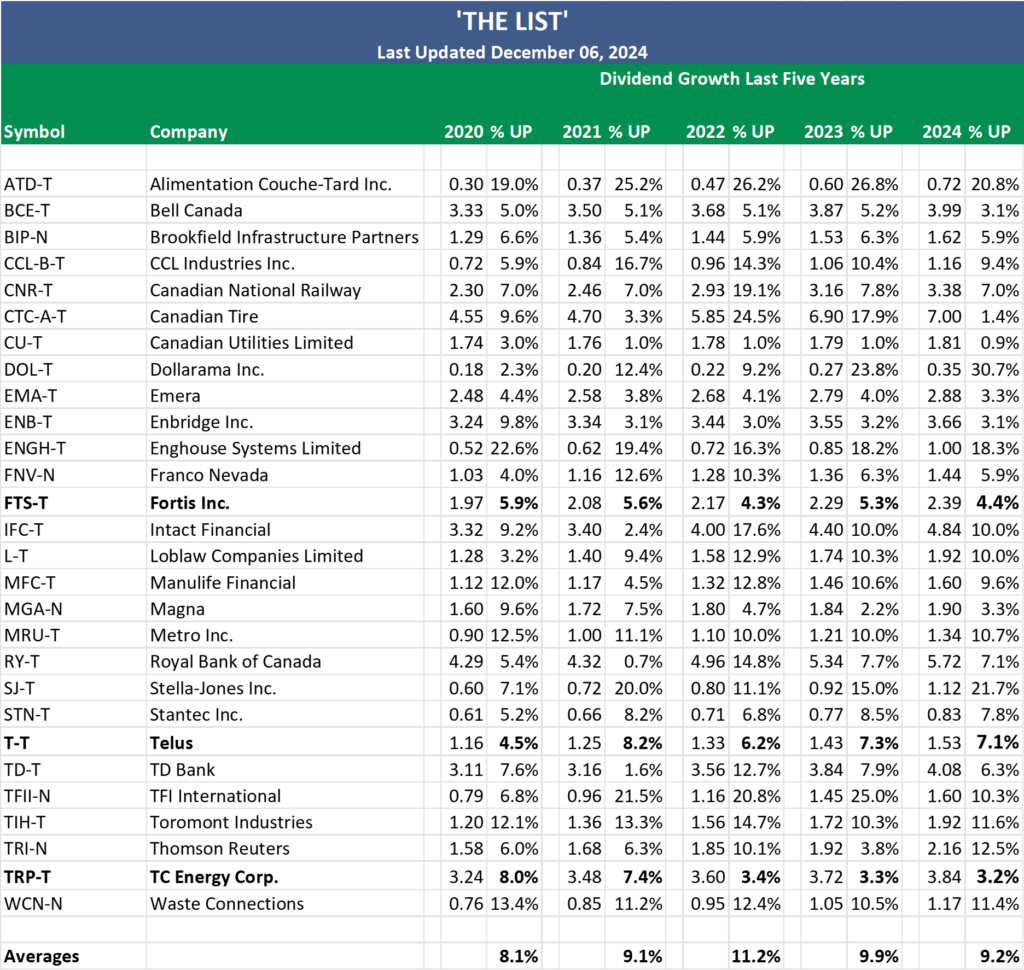
  • This week, we discuss what to do when a company freezes its dividend.
  • Last week, dividend growth of ‘The List’ stayed the same and has increased by +9.0% YTD (income).
  • Last week, the price of ‘The List’ was down slightly with a return of +12.1% YTD (capital).
  • Last week, there were no dividend announcements from companies on ‘The List’.
  • Last week, there were two earnings reports from companies on ‘The List’.
  • This week, fourteen companies on ‘The List’ are due to report earnings.

DGI Clipboard


“The best investment you can make is in a company that doesn’t have to change its dividend policy to stay afloat, but a freeze is sometimes a wise alternative to cuts.”

-Warren Buffett

When A Stock Fails To Raise Its Dividend
Intro


I’m reluctant to sell when I am building a position in any of our quality dividend growth stocks. My first objective when buying a stock is to hold it indefinitely and enjoy the steady, growing dividend income it provides. However, sometimes, changes occur that no longer align with the goals of my portfolio before I can fill out my position size. These changes may include a dividend cut or a dividend freeze (when a company fails to raise its dividend at the expected time).

Yesterday, Bell Canada (BCE-T), one of our quality dividend growers, announced a dividend freeze.

To determine if a stock that’s frozen its dividend still belongs in my portfolio, I follow my process:

Does the company’s long-term earnings power appear to have become impaired?

Before deciding to sell, it’s crucial to assess the company’s future prospects:

  • Dividend Potential: Is there a realistic chance the company will still raise its dividend in the current year?
  • Financial Health: Do the company’s future earnings and free cash flow support dividend growth? Or will obligations like debt take priority over returning cash to shareholders?
  • Management’s Commitment: Does the leadership remain committed to dividend growth?
  • Investment Appeal: If you didn’t already own the stock, would you buy it today for its income potential?

If a stock no longer meets my criteria, it becomes a candidate for sale. But before making a final decision, I ask one more question:

Are There More Attractive Ideas?

When a stock becomes a sell candidate, the next step is to explore whether a better alternative exists. Remember that once negative news (like a dividend freeze) is public, it’s often priced into the stock, which may push the yield higher. Yield on cost is irrelevant here; only the current yield matters, as it reflects what you’re giving up and what a replacement investment could provide.

Here’s what to consider when evaluating an alternative:

  • Income Replacement: Will the new stock at least match the lost dividend income?
  • Future Prospects: Does the alternative stock have strong future earnings and cash flow, debt management, and a commitment to dividend growth?
  • Risk Level: Is this new investment more or less risky than the one it’s replacing?

If an alternative stock offers a clear upgrade in income reliability and growth potential, it’s time to sell the dividend-freezing stock and invest in the replacement. This approach keeps the portfolio’s objective—an ever-growing dividend income—on track.

Wrap Up


Yesterday was a tough day for Canadian investors, as Bell Canada (BCE-T) is a crucial income source for many. Fortunately, Bell Canada comprises only ~4% of our portfolio, yielding 7% from dividends alone. We’ve been here before—in 2018, our non-public Wealth-Builder Portfolio (USA) faced a similar situation with AT&T. After unloading non-core assets and managing their debt, AT&T has resumed growth, up 28% YTD. While Bell’s long-term earnings are uncertain, few income alternatives look more appealing. We see dividend freezes as opportunities for reassessment rather than immediate alarm.

DGI Scorecard

 
The List (2024)


The Magic Pants 2024 list includes 28 Canadian dividend growth stocks. Here are the criteria to be considered a candidate on ‘The List’:

  1. Dividend growth streak: 10 years or more.
  2. Market cap: Minimum one billion dollars.
  3. Diversification: Limit of five companies per sector, preferably two per industry.
  4. Cyclicality: Exclude REITs and pure-play energy companies due to high cyclicality.

Based on these criteria, companies are added or removed from ‘The List’ annually on January 1. Prices and dividends are updated weekly.

‘The List’ is not a portfolio; it is a coaching tool that helps us think about ideas and risk manage our model portfolio. We own some but not all the companies on ‘The List’.

Our newsletter provides readers with a comprehensive insight into the implementation and advantages of our Canadian dividend growth investing strategy. This evidence-based, unbiased approach empowers DIY investors to outperform both actively managed dividend funds and passively managed indexes and dividend ETFs over longer-term horizons.

For those interested in something more, please upgrade to a paid subscriber; you get the enhanced weekly newsletter, access to premium content, full privileges on the new Substack website magicpants.substack.com and DGI alerts whenever we make stock transactions in our model portfolio.

Performance of ‘The List’


Last week, dividend growth of ‘The List’ stayed the same and has increased by +9.0% YTD (income). How much did your salary go up this year?

Last week, the average price return of ‘The List’ was down slightly with a return of +12.1% YTD (capital).

Even though prices may fluctuate, the dependable growth in our income does not. Stay the course. You will be happy you did.

Last week’s best performers on ‘The List’ were Dollarama Inc. (DOL-T), up +3.41%; Loblaw Companies Limited (L-T), up +2.55%; and Alimentation Couche-Tard Inc. (ATD-T), up +2.25%.

Brookfield Infrastructure Partners (BIP-N) was the worst performer last week, down -4.45%.

SYMBOL COMPANY YLD PRICE YTD % DIV YTD % STREAK
ATD-T Alimentation Couche-Tard Inc. 1.0% $73.04 -4.8% $0.70 17.4% 14
BCE-T Bell Canada 8.9% $44.81 -17.3% $3.99 3.1% 15
BIP-N Brookfield Infrastructure Partners 4.7% $34.11 11.1% $1.62 5.9% 16
CCL-B-T CCL Industries Inc. 1.4% $81.85 41.5% $1.16 9.4% 22
CNR-T Canadian National Railway 2.2% $150.98 -9.5% $3.38 7.0% 28
CTC-A-T Canadian Tire 4.7% $150.11 8.3% $7.00 1.4% 13
CU-T Canadian Utilities Limited 5.1% $35.38 10.1% $1.81 0.9% 52
DOL-T Dollarama Inc. 0.2% $146.49 54.2% $0.35 29.5% 13
EMA-T Emera 5.6% $50.93 0.3% $2.88 3.2% 17
ENB-T Enbridge Inc. 6.5% $56.42 16.6% $3.66 3.1% 28
ENGH-T Enghouse Systems Limited 3.3% $30.45 -10.4% $1.00 18.3% 17
FNV-N Franco Nevada 1.1% $131.71 19.6% $1.44 5.9% 16
FTS-T Fortis Inc. 4.0% $59.74 8.9% $2.39 4.4% 50
IFC-T Intact Financial 1.8% $269.16 32.4% $4.84 10.0% 19
L-T Loblaw Companies Limited 1.1% $177.41 38.0% $1.92 10.0% 12
MFC-T Manulife Financial 3.9% $41.13 42.4% $1.60 9.6% 10
MGA-N Magna 4.5% $41.97 -24.4% $1.90 3.3% 14
MRU-T Metro Inc. 1.6% $82.91 21.0% $1.34 10.7% 29
RY-T Royal Bank of Canada 3.4% $170.12 27.9% $5.72 7.1% 13
SJ-T Stella-Jones Inc. 1.3% $86.99 13.6% $1.12 21.7% 19
STN-T Stantec Inc. 0.7% $113.77 8.7% $0.83 7.8% 12
T-T Telus 7.0% $21.90 -7.7% $1.53 7.1% 20
TD-T TD Bank 5.3% $76.76 -9.4% $4.08 6.3% 13
TFII-N TFI International 1.2% $132.07 0.7% $1.60 10.3% 13
TIH-T Toromont Industries 1.6% $123.66 9.6% $1.92 11.6% 34
TRI-N Thomson Reuters 1.3% $164.78 15.0% $2.16 12.5% 30
TRP-T TC Energy Corp. 5.9% $64.61 23.5% $3.84 3.2% 23
WCN-N Waste Connections 0.7% $176.96 19.4% $1.17 11.4% 14
Averages 3.2% 12.1% 9.0% 21

Note: Stocks ending in “-N” declare earnings and dividends in US dollars. To achieve currency consistency between dividends and share price for these stocks, we have shown dividends in US dollars and share price in US dollars (these stocks are listed on a US exchange). The dividends for their Canadian counterparts (-T) would be converted into CDN dollars and would fluctuate with the exchange rate.

For more articles and the full newsletter, check us out on magicpants.substack.com. Don’t miss this opportunity to stay informed and make the most of your investments!

We buy quality individual dividend growth stocks when they are sensibly priced and hold for the growing income.