MP Market Review – April 1, 2022
Last updated by BM on April 4, 2022
“The buying frenzy of the past 12 years has lured many market participants into speculative holdings that someday will seem like roach motels, easier to get into than out of.” – Seth Klarman
In an earlier post, ‘Estimating Future Returns’, we talked about speculation and how it can affect market returns in even the best companies.
The post is highlighted by Jack Bogle’s formula for estimating future market returns:
Future Market Returns = Dividend Yield + Earnings Growth +/- Change in P/E Ratio
Bogle calls the first two components, Yield + Growth, investment aspects of the investment return and the last component, +/- Change in P/E Ratio, the speculative return – what will people pay for a dollar’s worth of earnings?
A few stocks on ‘The List’ have experienced falling prices YTD, not because of the investment aspects of the formula but because they were priced to perfection (speculative return) coming into 2022. People paid a lot for their earnings. When the economy hits a bump in the road or financial results aren’t perfect…down goes the price. A falling price lowers the P/E, so now the speculative return component takes away from the investment return which can turn the future market returns negative in the short run. As dividend growth investors, the way we protect our capital is to be patient and only purchase our companies when they are sensibly priced. This gives our good dividend growers a higher probability of a positive Total Return going forward.
Here is an example of Bogle’s theory in action from a company on ‘The List’:
At one-point last year, Magna (MG-T) was trading at a P/E of 22. Understanding Bogle’s formula, we had a pretty good idea what our future return would look like if we added to our position at that point. Magna (MG-T) has a historical average P/E closer to 11. The investment aspects of Bogle’s formula (Yield + Growth) would not be enough to overcome a significant drop in P/E back to the historical average. We decided to wait until the speculative return came back down to earth. In the end, we were patient and when Magna (MG-T) finally touched its historical P/E in March of this year, we added to our position. At a P/E of 10 we determined the P/E was no longer speculative and the probability of further P/E reductions had decreased considerably. It was time to execute on our process.
Having a time-tested process to value our dividend growers helps increase the odds in our favour for a future positive return and keeps us out of Klarman’s ‘roach motels’.
Performance of ‘The List’
‘The List’ was up last week with a 3.1% YTD price return (capital). Dividend growth of ‘The List’ continues upward with a 9.4% YTD increase in our income over last year.
The best performers last week on ‘The List’ were Dollarama Inc. (DOL-T) up 7.2%; Brookfield Infrastructure Partners (BIP-T) up 5.0%; with both Emera (EMA-T) and Fortis (FTS-T) up 4.0%.
Canadian National Railway (CNR-T) was the worst performer last week, down -5.8%.
One company on ‘The List’, Dollarama Inc. (DOL-T), announced both a dividend increase and an earnings report for Q4 and Full Fiscal Year 2022 (January 2022 year-end).
Recent News
I watched a few videos and listened to some podcasts this week which all had their take on the current state of our economies both here in Canada and abroad. One thing that everyone can agree on is that inflation is no longer ‘transitory’, it is real, and it is here to stay for a while. We see rising prices at the gas pumps, in the grocery stores and now at our ‘dollar’ stores. Dollarama Inc. (DOL-T) announced that price tags up to $5 will begin appearing on its store shelves in the coming year. Until now, Dollarama’s highest price point was $4. I can still remember everything at Dollarama Inc. (DOL-T) being a dollar (as the name implies) only a few years ago.
A good book I am now reading, The Price of Tomorrow by Jeff Booth, has an interesting take on inflation. In the book, Booth equates inflation to ‘theft’. He talks about how inflation is only accelerating the divide between the haves and the have-nots. Owning real assets (quality businesses) instead of holding cash and fixed income is one of the better ways to keep pace with inflation.
One of the things that first attracted us to dividend growth investing was its built-in inflation protected cash flow (growing dividend). Owning companies like Dollarama Inc. (DOL-T) who also have pricing power helps as well.
There are no companies on ‘The List’ due to report earnings this week.
Dividend Increases
There was one company on ‘The List’ that announced a dividend increase this week.
Dollarama Inc. (DOL-T) on Wednesday said it increased its 2022 quarterly dividend from $0.0503 to $.0553 per share, payable May 6, 2022, to shareholders of record on April 15, 2022.
This represents a dividend increase of 10.0% and the 12th consecutive year in which the company has increased its dividend.
Earnings Releases
There was only one company on ‘The List’ to report as we now move into the next quarter (Q1 2022) of earnings releases in late April and May. Not all companies on the list have a fiscal year-end of December 31. Dollarama Inc. (DOL-T) is one such company with a year end of January 31 which moves them into Fiscal 2023 earnings next.
Dollarama Inc. (DOL-T)
“Dollarama delivered strong operational and financial results in Fiscal 2022, including EPS growth of 20%, all this while navigating the ebb and flow of the pandemic’s impacts on retailers and consumer shopping patterns and in the context of supply chain and inflationary pressures. This remarkable performance speaks to the resilience of our business model and the relevance of our value promise to Canadian consumers, a promise we are committed to fulfilling in what remains a complex and volatile environment as we enter Fiscal 2023,” said Neil Rossy, President and CEO.
Fiscal 2022 Fourth Quarter Results Highlights Compared to Fiscal 2021 Fourth Quarter Results
- Sales increased by 11.0% to $1,224.9 million
- Comparable store sales grew 5.7%
- Gross margin was 45.2% of sales, compared to 45.5% of sales
- EBITDA increased by 20.4% to $393.7 million, or 32.1% of sales, compared to 29.6% of sales
- Operating income increased by 23.3% to $315.7 million, or 25.8% of sales, compared to 23.2% of sales
- Incremental direct costs related to COVID-19 measures totaled $4.4 million, compared to $23.8 million
- Diluted net earnings per share increased by 32.1% to $0.74, compared to $0.56
- 24 net new stores were opened, compared to 23 net new stores
- 5,090,587 common shares were repurchased for cancellation for $318.5 million
Fiscal 2022 Results Highlights Compared to Fiscal 2021 Results
- Sales increased by 7.6% to $4,330.8 million
- Comparable store sales grew 1.7%
- Gross margin was 43.9% of sales, compared to 43.8% of sales
- EBITDA increased by 13.4% to $1,282.6 million, or 29.6% of sales, compared to 28.1% of sales
- Operating income increased by 14.4% to $984.6 million, or 22.7% of sales, compared to 21.4% of sales
- Incremental direct costs related to COVID-19 measures totaled $35.5 million, compared to $84.0 million, of which $2.9 million relates to cost of sales and $81.1 million to SG&A
- Diluted net earnings per share increased by 20.4% to $2.18, compared to $1.81
- 65 net new stores were opened, same as prior year, bringing total store count to 1,421
- 18,176,760 common shares were repurchased for cancellation for $1,059.9 million
We liked Dollarama’s report. Twenty percent earnings growth YoY, a 10% dividend increase and plans to add more stores sends a lot of positive messages to investors. It is no wonder it was the top performer on ‘The List’ this past week. At a P/E of 32 (21% above its average) however, we will wait for a better entry point.
Below is a snapshot of ‘The List’ from last Friday’s close. For a sortable version of ‘The List’ please click on The List menu item.
‘The List’ is not meant to be a template for investors to copy exactly. Rather, its purpose is to provide investment ideas and a real-time illustration of dividend growth investing in action. It is not a ‘Buy List’ nor does it reflect the composition or returns of our Magic Pants Wealth-Builder CDN Portfolio. It is only a starting point for our analysis and discussion.
The List (2022)
Last updated by BM on April 1, 2022
*Note: The following graph is wide, you can scroll to the right on your device to see more of the data.
| SYMBOL | COMPANY | YLD | PRICE | YTD % | DIV | YTD % | STREAK |
|---|---|---|---|---|---|---|---|
| AQN-N | Algonquin Power & Utilities | 4.4% | $15.59 | 8.6% | $0.68 | 2.3% | 11 |
| ATD-T | Alimentation Couche-Tard Inc. | 0.8% | $55.56 | 6.6% | $0.44 | 18.1% | 12 |
| BCE-T | Bell Canada | 5.2% | $70.23 | 6.6% | $3.68 | 5.1% | 13 |
| BIP-N | Brookfield Infrastructure Partners | 3.2% | $67.26 | 10.1% | $2.16 | 5.9% | 14 |
| CCL-B-T | CCL Industries | 1.7% | $56.55 | -16.6% | $0.96 | 14.3% | 20 |
| CNR-T | Canadian National Railway | 1.8% | $159.94 | 3.3% | $2.93 | 19.1% | 26 |
| CTC-A-T | Canadian Tire | 2.8% | $185.80 | 1.4% | $5.20 | 10.6% | 11 |
| CU-T | Canadian Utilities Limited | 4.6% | $38.23 | 4.4% | $1.78 | 1.0% | 50 |
| DOL-T | Dollarama Inc. | 0.3% | $72.42 | 14.2% | $0.22 | 9.2% | 11 |
| EMA-T | Emera | 4.2% | $62.92 | 0.5% | $2.65 | 2.9% | 15 |
| ENB-T | Enbridge Inc. | 5.9% | $58.08 | 17.2% | $3.44 | 3.0% | 26 |
| ENGH-T | Enghouse Systems Limited | 1.8% | $39.99 | -12.8% | $0.72 | 16.3% | 15 |
| FNV-N | Franco Nevada | 0.8% | $163.67 | 20.3% | $1.28 | 10.3% | 14 |
| FTS-T | Fortis | 3.4% | $62.73 | 3.7% | $2.14 | 4.4% | 48 |
| IFC-T | Intact Financial | 2.2% | $184.67 | 12.8% | $4.00 | 17.6% | 17 |
| L-T | Loblaws | 1.3% | $110.88 | 7.9% | $1.46 | 6.6% | 10 |
| MGA-N | Magna | 2.8% | $64.33 | -21.2% | $1.80 | 4.7% | 12 |
| MRU-T | Metro | 1.5% | $71.57 | 6.8% | $1.10 | 10.0% | 27 |
| RY-T | Royal Bank of Canada | 3.5% | $137.32 | 0.4% | $4.80 | 11.1% | 11 |
| SJ-T | Stella-Jones Inc. | 2.2% | $37.00 | -9.0% | $0.80 | 11.1% | 17 |
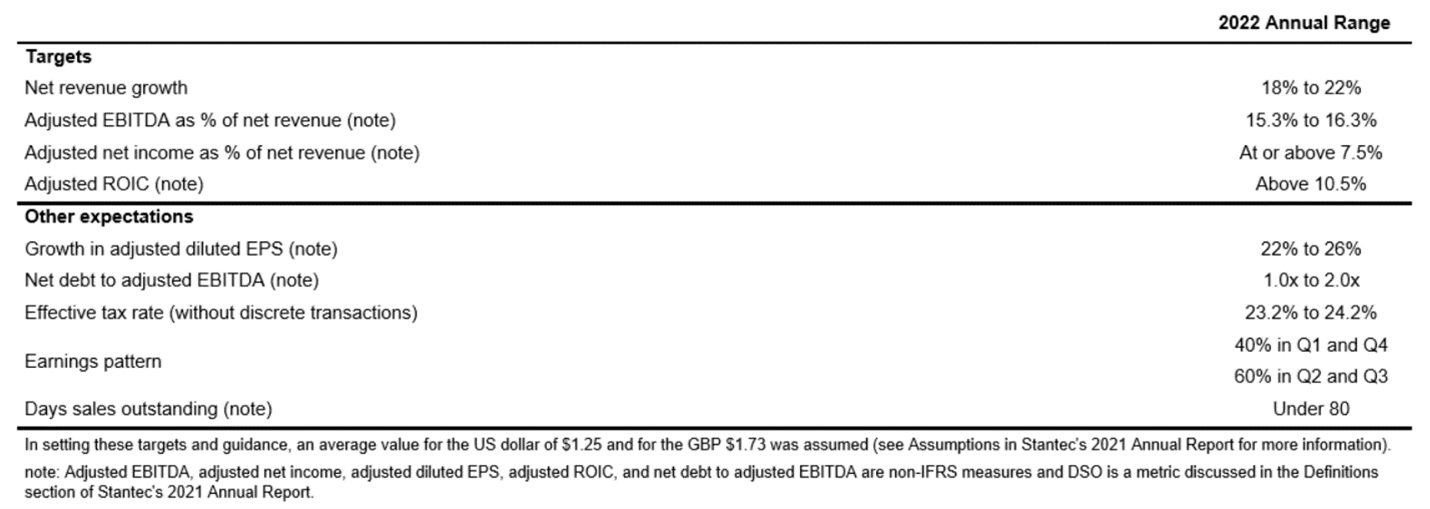
| STN-T | Stantec Inc. | 1.1% | $62.11 | -11.5% | $0.71 | 6.8% | 10 |
| TD-T | TD Bank | 3.6% | $99.47 | 0.1% | $3.56 | 12.7% | 11 |
| TFII-T | TFI International | 1.1% | $125.60 | -10.4% | $1.36 | 17.4% | 11 |
| TIH-T | Toromont Industries | 1.3% | $118.53 | 4.3% | $1.52 | 15.2% | 32 |
| TRP-T | TC Energy Corp. | 5.0% | $71.46 | 19.6% | $3.57 | 4.4% | 21 |
| T-T | Telus | 3.9% | $33.31 | 11.9% | $1.31 | 4.4% | 18 |
| WCN-N | Waste Connections | 0.7% | $139.73 | 4.2% | $0.92 | 8.9% | 12 |
| Averages | 2.6% | 3.1% | 9.4% | 18 |