“You have a pair of pants. In the left pocket, you have $100. You take $1 out of the left pocket and put in the right pocket. You now have $101. There is no diminution of dollars in your left pocket. That is one magic pair of pants.”

Category: MP Market Reviews

MP Market Review – November 21, 2025

Last updated by BM on November 25, 2025

Summary


Welcome to this week’s MP Market Review – your go-to source for insights and updates on the Canadian dividend growth companies we track on The List! While we’ve expanded our watchlists to include U.S. companies The List-USA, our Canadian lineup remains the cornerstone of our coaching approach.

Don’t miss out on exclusive newsletters and premium content that will help you sharpen your investing strategy. Explore it all at magicpants.substack.com.

Your journey to dividend growth mastery starts here – let’s dive in!

  • Last week, dividend growth of The List stayed the same with an average return of +7.1% YTD (income).
  • Last week, the price of The List was down from the previous week with an average return of +10.9% YTD (capital).
  • Last week, no companies on The List made a dividend announcement.
  • Last week, one company on The List released an earnings report.
  • This week, one company from The List will report their off-cycle earnings.

DGI Clipboard


“If you are just starting to invest in dividend growth stocks and you also hold bonds, I’d keep them for a while…until the dividend income starts to grow…until you realize what’s going on. Once your ‘yield on cost’ gets close to the yield on your bonds, you’ll know what to do.”

— Tom Connolly

Homes Didn’t Get Pricier. Your Dollar Got Weaker. The Investing Lesson No One Talks About.
Intro


I came across a chart in the article referenced in our “DGI News” section below that illustrates something we can all relate to: the erosion of purchasing power as seen through Canadian home prices. While home prices have surged dramatically in dollar terms, their value in forms of money with longer histories, like gold and silver, has barely changed in more than four decades.

In 1981, the average Canadian home cost about 4.5 kilograms of gold. Today, it costs almost exactly the same. Measured in silver, the average home is worth roughly 375 kilograms, virtually identical to its value back in 1986. This raises an obvious question: If homes do not cost more in real terms, why do they feel so much less affordable?

The answer lies in the nature of fiat currency. Modern money is not anchored to anything tangible. As governments expand the money supply, each dollar buys less over time. Homes have not become dramatically more valuable. Our money has simply become weaker.

Federal governments, particularly those with significant debt, increase the money supply to bring on inflation which will reduce the real value of their debt and boost tax revenue. Given the current state of government balance sheets, it’s reasonable to expect higher inflation will become more common in the future.

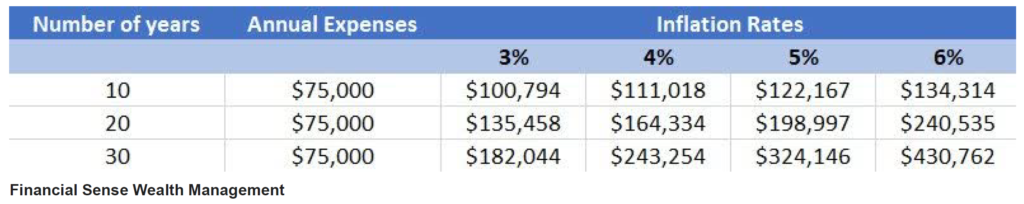
So, why discuss inflation in the context of dividend growth investing? Because it can have a profound impact on your retirement planning.

The chart below illustrates how much more you’ll need in 10, 20, or 30 years to cover $75,000 in expenses today at various inflation rates.

Now let’s apply the same concept to fixed income investing (Bonds) versus dividend growth investing.

In this example we look at a $100,000 Bond over 10, 20, or 30 years, as inflation steadily erodes its purchasing power.

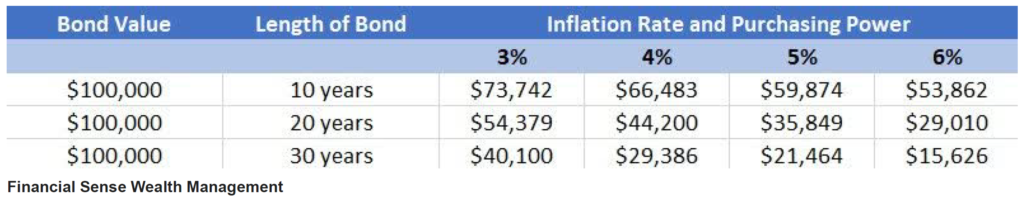
Over time, a fixed coupon loses purchasing power, just like wages that do not keep up with inflation. Investors may think they are buying stability, but in real terms they may be locking in a long-term loss.

Dividend growth companies are different. They adjust. As earnings rise, so do dividends. Quality businesses with pricing power can pass inflation on to customers and grow their income streams in real terms. Dividend growth investors are not simply collecting a fixed payment. They own businesses that increase their distributions year after year, helping protect and expand purchasing power over time.

Takeaway


In an environment where money steadily loses value, fixed income stands still. Dividend growth compounds.

Become a paid partner, and I’ll show you exactly how I do it. With real money. In real stocks. In addition, gain full access to this post and exclusive, subscriber-only content. We do the work; you stay in control. Subscribe today and take your dividend growth investing to the next level!

DGI Scorecard

 
The List (2025)


The Magic Pants 2025 list includes 29 Canadian dividend growth stocks. Here are the criteria to be considered a candidate on ‘The List’:

  1. Dividend growth streak: 10 years or more.
  2. Market cap: Minimum one billion dollars.
  3. Diversification: Limit of five companies per sector, preferably two per industry.
  4. Cyclicality: Exclude REITs and pure-play energy companies due to high cyclicality.

Based on these criteria, companies are added or removed from ‘The List’ annually on January 1. Prices and dividends are updated weekly.

‘The List’ is not a portfolio but a coaching tool that helps us think about ideas and risk manage our model portfolio. We own some but not all the companies on ‘The List’. In other words, we might want to buy these companies when valuation looks attractive.

Our newsletter provides readers with a comprehensive insight into the implementation and advantages of our Canadian dividend growth investing strategy. This evidence-based, unbiased approach empowers DIY investors to outperform both actively managed dividend funds and passively managed indexes and dividend ETFs over longer-term horizons.

Performance of ‘The List’


Last week, dividend growth stayed the same, with an average return of +7.1% YTD (income).

The price of ‘The List’ was down from the previous week, with an average YTD return of +10.9% (capital).

Last week’s best performers on ‘The List’ were Loblaw Companies Limited (L-T), up +4.16%.; Waste Connections (WCN-N), up +3.96%; and Royal Bank of Canada (RY-T) up +2.88%.

Stantec Inc. (STN-T) was the worst performer last week, down -10.75%.

SYMBOL COMPANY YLD PRICE YTD % DIV YTD % STREAK
ATD-T Alimentation Couche-Tard Inc. 1.1% $72.02 -8.89% $0.78 8.3% 15
BCE-T Bell Canada 8.8% $32.60 -2.74% $2.87 -28.1% 16
BIP-N Brookfield Infrastructure Partners 4.9% $35.21 10.51% $1.72 6.2% 17
CCL-B-T CCL Industries Inc. 1.5% $83.77 13.79% $1.28 10.3% 23
CNR-T Canadian National Railway 2.7% $131.11 -10.68% $3.55 5.0% 29
CTC-A-T Canadian Tire 4.3% $166.65 8.42% $7.10 1.4% 14
CU-T Canadian Utilities Limited 4.4% $41.84 20.30% $1.83 1.0% 53
DOL-T Dollarama Inc. 0.2% $197.68 41.00% $0.41 18.1% 14
EMA-T Emera 4.4% $66.78 24.75% $2.92 1.2% 18
ENB-T Enbridge Inc. 5.6% $67.60 9.26% $3.77 3.0% 29
ENGH-T Enghouse Systems Limited 5.8% $20.13 -25.61% $1.16 16.0% 18
FNV-N Franco Nevada 0.8% $191.30 57.93% $1.52 5.6% 17
FTS-T Fortis Inc. 3.4% $72.66 21.87% $2.49 4.2% 51
GSY-T goeasy Ltd. 4.7% $124.43 -25.56% $5.84 24.8% 10
IFC-T Intact Financial 1.9% $284.19 8.07% $5.32 9.9% 20
L-T Loblaw Companies Limited 0.9% $63.03 32.53% $0.55 15.2% 13
MFC-T Manulife Financial 3.6% $48.66 10.74% $1.76 10.0% 11
MGA-N Magna 4.0% $48.26 15.62% $1.94 2.1% 15
MRU-T Metro Inc. 1.5% $100.19 11.11% $1.48 10.4% 30
RY-T Royal Bank of Canada 2.9% $211.38 22.70% $6.04 7.9% 14
SJ-T Stella-Jones Inc. 1.5% $84.26 15.44% $1.24 10.7% 20
STN-T Stantec Inc. 0.7% $132.65 17.28% $0.89 7.3% 13
T-T Telus 8.8% $18.71 -4.69% $1.64 7.0% 21
TD-T TD Bank 3.6% $115.59 51.10% $4.20 2.9% 14
TFII-N TFI International 2.1% $85.95 -35.19% $1.80 12.5% 14
TIH-T Toromont Industries 1.3% $158.98 40.57% $2.08 8.3% 35
TRI-Q Thomson Reuters 1.8% $135.00 -16.86% $2.38 10.2% 31
TRP-T TC Energy Corp. 4.5% $75.98 11.37% $3.40 3.3% 24
WCN-N Waste Connections 0.7% $175.30 3.17% $1.30 10.7% 15
Averages 3.2% 10.9% 7.1% 21

Note: Stocks ending in “-N or -Q” declare earnings and dividends in US dollars. To achieve currency consistency between dividends and share price for these stocks, we have shown dividends in US dollars and share price in US dollars (these stocks are listed on a US exchange). The dividends for their Canadian counterparts (-T) would be converted into CDN dollars and would fluctuate with the exchange rate.

PAID subscribers enjoy full access to our enhanced weekly newsletter, premium content, and easy-to-follow trade alerts so they can build DGI portfolios alongside ours. This service provides the resources to develop your DGI business plan confidently. We do the work; you stay in control!

It truly is the subscription that pays dividends!

The greatest investment you can make is in yourself. Are you ready to take that step? 

For more articles and the full newsletter, check us out on magicpants.substack.com.

MP Market Review – November 14, 2025

Last updated by BM on November 18, 2025

Summary


Welcome to this week’s MP Market Review – your go-to source for insights and updates on the Canadian dividend growth companies we track on The List! While we’ve expanded our watchlists to include U.S. companies The List-USA, our Canadian lineup remains the cornerstone of our coaching approach.

Don’t miss out on exclusive newsletters and premium content that will help you sharpen your investing strategy. Explore it all at magicpants.substack.com.

Your journey to dividend growth mastery starts here – let’s dive in!

  • Last week, dividend growth of The List stayed the same with an average return of +7.1% YTD (income).
  • Last week, the price of The List was up from the previous week with an average return of +11.8% YTD (capital).
  • Last week, no companies on The List made a dividend announcement.
  • Last week, four companies on The List released earnings reports.
  • This week, one company from The List will report on earnings.

DGI Clipboard


“Current yield, using its own historic yield as a guide, is, in my view, a fine valuation measure.”

— Tom Connolly

The Timely Ten: Finding Value Before The Crowd
Intro


Our Timely Ten lists remain the fastest way to spot potential value opportunities, which explains why they continue to be the most-read articles every month.

Timely Ten (CDN)

goeasy Ltd. climbed to the number three spot in this month’s Timely Ten after a sharp 25% pullback following its Q3 2025 earnings release. Investors clearly were not impressed, but the decline has pushed the stock into more attractive valuation territory.

Magna moved in the opposite direction, slipping to number eight from number five last month. The market responded favourably to its Q3 results.

Our two recent Canadian model portfolio additions, Metro Inc. (MRU-T) and Waste Connections (WCN-N), went in opposite directions with Metro Inc. moving down the list on price strength and Waste Connections cracking the Timely Ten on weakness.

Among this month’s Timely Ten, goeasy Ltd. stands out as the most compelling opportunity. A starting yield above 4.5 percent, a 25 percent dividend increase in 2025, and a payout ratio of under 40 percent all indicate a company that warrants further research from dividend growth investors.

Outside of a deeper dive on goeasy Ltd., we remain comfortable staying patient with our Canadian model portfolio and continue collecting our growing dividends. Unless something meaningfully shifts in the market, there is no need to force new positions.

Timely Ten (USA)

Most of the Timely Ten barely budged this month, with the top eight still firmly in undervalued territory. United Parcel Service remains in the number one spot, although a 17 percent gain since last month has made it slightly less attractive. There is plenty of debate around the safety of its dividend, so we are content to watch from the sidelines for now.

The real story this month is the movement from two exceptional dividend growth companies. One is a dividend king, the other one of the best compounders of the past twenty years. They now sit at number nine and ten on the list. For those new to dividend growth investing, a company earns the title of dividend king after raising its dividend for 50 consecutive years.

Automatic Data Processing jumped from number seventeen last month to number nine. In its most recent earnings release, both revenue and earnings increased, making the market’s negative reaction somewhat hard to explain. Some of the price weakness appears tied to concerns about AI-related disruption to its business model.

Visa, another long-term compounder, enters the Timely Ten in the tenth position. It is rare to find a company with Visa’s combination of sustained dividend growth and strong price appreciation trading above its average yield. When dividend growth and price growth align over long investment horizons, the results can be remarkable. Here is Visa’s ten-year dividend growth and price growth chart:

The price growth recently dropped below the dividend growth, which has historically been a good entry point for this quality dividend growth company.

Each month, the Timely Ten lists surface real, actionable ideas. Some require more research, while others are ready to act on today. This disciplined framework keeps us focused on quality and valuation, not market noise.

Here’s a recap on how we select our Timely Ten:

Step three in our process involves monitoring our quality dividend growers regularly, which can become quite challenging depending on the number of companies we track. Fortunately, we rely on ‘The List’ instead of the vast array of stocks in the index, which streamlines our task. Nevertheless, we continually seek methods to enhance our efficiency. Through dividend yield theory, we’ve discovered an approach that has proven remarkably effective in aiding us with our efforts over the years.

Dividend yield theory is a simple and intuitive approach to valuing dividend growth stocks. It suggests that the dividend yield of quality dividend growth stocks tends to revert to the mean over time, assuming that the underlying business model remains stable. In practical terms, if a stock pays a dividend yield above its ten-year average annual yield, its price will likely increase to return the yield to its historical average. Knowing that price and yield go in opposite directions, this theory helps us find stocks poised for a favourable price correction.

We have pre-screened our candidates using the criteria we initially laid out in building our watchlists. This helps us considerably narrow the universe of investable stocks.

  1. Dividend growth streak: 10 years or more.
  2. Market cap: Minimum one billion dollars.
  3. Diversification: Limit of five companies per sector, preferably two per industry.
  4. Cyclicality: Exclude REITs and pure-play energy companies due to high cyclicality.

Next, we rank our Canadian and American watchlists based on how far each stock’s price is below its fair value (Low Price), as determined by dividend yield theory. To find fair value, divide the current dividend (Dividend) by the stock’s historical high yield (High Yield).

Since price and yield move in opposite directions, a lower price results in a higher yield, and vice versa. The ten companies above the thick black line have a current price (Price) below fair value (Low Price). Put simply, these stocks have a current dividend yield higher than their historically high yield. According to dividend yield theory, these companies are sensibly priced and have the highest probability of a price increase in the short term. These are our Timely Ten.

Takeaway


History shows the Timely Ten is fertile ground for finding attractive entry points into high-quality dividend growers. Whether or not you act on the names, the list serves its purpose: to surface opportunities when quality meets value.

When making investment decisions, always prioritize a company’s ‘quality’ over a ‘sensible price’. For more details on our quality indicators, download our Free Guide to Finding Quality Dividend Growth Stocks here.

Become a paid partner, and I’ll show you exactly how I do it. With real money. In real stocks. In addition, gain full access to this post and exclusive, subscriber-only content. We do the work; you stay in control. Subscribe today and take your dividend growth investing to the next level!

DGI Scorecard

 
The List (2025)


The Magic Pants 2025 list includes 29 Canadian dividend growth stocks. Here are the criteria to be considered a candidate on ‘The List’:

  1. Dividend growth streak: 10 years or more.
  2. Market cap: Minimum one billion dollars.
  3. Diversification: Limit of five companies per sector, preferably two per industry.
  4. Cyclicality: Exclude REITs and pure-play energy companies due to high cyclicality.

Based on these criteria, companies are added or removed from ‘The List’ annually on January 1. Prices and dividends are updated weekly.

‘The List’ is not a portfolio but a coaching tool that helps us think about ideas and risk manage our model portfolio. We own some but not all the companies on ‘The List’. In other words, we might want to buy these companies when valuation looks attractive.

Our newsletter provides readers with a comprehensive insight into the implementation and advantages of our Canadian dividend growth investing strategy. This evidence-based, unbiased approach empowers DIY investors to outperform both actively managed dividend funds and passively managed indexes and dividend ETFs over longer-term horizons.

Performance of ‘The List’


Last week, dividend growth stayed the same, with an average return of +7.1% YTD (income).

The price of ‘The List’ was up from the previous week, with an average YTD return of +11.8% (capital).

Last week’s best performers on ‘The List’ were CCL Industries Inc. (CCL-B-T), up +10.89%.; Loblaw Companies Limited (L-T), up +6.87%; and TC Energy Corp. (TRP-T) up +5.72%.

goeasy Ltd. (GSY-T) was the worst performer last week, down -5.03%.

SYMBOL COMPANY YLD PRICE YTD % DIV YTD % STREAK
ATD-T Alimentation Couche-Tard Inc. 1.1% $70.30 -11.07% $0.78 8.3% 15
BCE-T Bell Canada 9.0% $32.01 -4.50% $2.87 -28.1% 16
BIP-N Brookfield Infrastructure Partners 4.9% $35.40 11.11% $1.72 6.2% 17
CCL-B-T CCL Industries Inc. 1.5% $87.74 19.18% $1.28 10.3% 23
CNR-T Canadian National Railway 2.6% $134.81 -8.16% $3.55 5.0% 29
CTC-A-T Canadian Tire 4.1% $171.80 11.77% $7.10 1.4% 14
CU-T Canadian Utilities Limited 4.3% $42.40 21.91% $1.83 1.0% 53
DOL-T Dollarama Inc. 0.2% $194.93 39.04% $0.41 18.1% 14
EMA-T Emera 4.3% $67.13 25.41% $2.92 1.2% 18
ENB-T Enbridge Inc. 5.6% $67.16 8.55% $3.77 3.0% 29
ENGH-T Enghouse Systems Limited 5.8% $19.99 -26.13% $1.16 16.0% 18
FNV-N Franco Nevada 0.8% $196.96 62.60% $1.52 5.6% 17
FTS-T Fortis Inc. 3.4% $73.33 23.00% $2.49 4.2% 51
GSY-T goeasy Ltd. 4.7% $122.95 -26.45% $5.84 24.8% 10
IFC-T Intact Financial 1.9% $282.18 7.31% $5.32 9.9% 20
L-T Loblaw Companies Limited 0.9% $60.51 27.23% $0.55 15.2% 13
MFC-T Manulife Financial 3.6% $48.26 9.83% $1.76 10.0% 11
MGA-N Magna 4.0% $49.09 17.61% $1.94 2.1% 15
MRU-T Metro Inc. 1.5% $98.04 8.73% $1.48 10.4% 30
RY-T Royal Bank of Canada 2.9% $205.46 19.27% $6.04 7.9% 14
SJ-T Stella-Jones Inc. 1.5% $84.87 16.28% $1.24 10.7% 20
STN-T Stantec Inc. 0.6% $148.63 31.40% $0.89 7.3% 13
T-T Telus 8.0% $20.38 3.82% $1.64 7.0% 21
TD-T TD Bank 3.7% $114.05 49.08% $4.20 2.9% 14
TFII-N TFI International 2.1% $85.69 -35.38% $1.80 12.5% 14
TIH-T Toromont Industries 1.3% $159.56 41.08% $2.08 8.3% 35
TRI-Q Thomson Reuters 1.7% $141.13 -13.09% $2.38 10.2% 31
TRP-T TC Energy Corp. 4.4% $77.45 13.53% $3.40 3.3% 24
WCN-N Waste Connections 0.8% $168.63 -0.75% $1.30 10.7% 15
Averages 3.1% 11.8% 7.1% 21

Note: Stocks ending in “-N or -Q” declare earnings and dividends in US dollars. To achieve currency consistency between dividends and share price for these stocks, we have shown dividends in US dollars and share price in US dollars (these stocks are listed on a US exchange). The dividends for their Canadian counterparts (-T) would be converted into CDN dollars and would fluctuate with the exchange rate.

PAID subscribers enjoy full access to our enhanced weekly newsletter, premium content, and easy-to-follow trade alerts so they can build DGI portfolios alongside ours. This service provides the resources to develop your DGI business plan confidently. We do the work; you stay in control!

It truly is the subscription that pays dividends!

The greatest investment you can make is in yourself. Are you ready to take that step? 

For more articles and the full newsletter, check us out on magicpants.substack.com.

MP Market Review – November 7, 2025

Last updated by BM on November 11, 2025

Summary


Welcome to this week’s MP Market Review – your go-to source for insights and updates on the Canadian dividend growth companies we track on The List! While we’ve expanded our watchlists to include U.S. companies The List-USA, our Canadian lineup remains the cornerstone of our coaching approach.

Don’t miss out on exclusive newsletters and premium content that will help you sharpen your investing strategy. Explore it all at magicpants.substack.com.

Your journey to dividend growth mastery starts here – let’s dive in!

  • Last week, dividend growth of The List stayed the same with an average return of +7.1% YTD (income).
  • Last week, the price of The List was up from the previous week with an average return of +10.3% YTD (capital).
  • Last week, there were three dividend announcements from companies on The List.
  • Last week, there were fourteen earnings reports from companies on The List.
  • This week, four companies from The List will report on earnings.

DGI Clipboard


“Earnings are the principal factor determining market value, provided they are reasonably stable and subject to careful analysis.”

– Benjamin Graham

Earnings Growth and Dividend Growth: Two Sides of the Same Coin
Intro


With roughly half of The List reporting earnings last week, it’s a good time to revisit why earnings matter so much in our dividend growth investing strategy and how they ultimately drive the income and long-term returns we are building toward.

The Significance of Earnings in Dividend Growth Investing

When it comes to dividend growth investing, earnings are the engine that drives everything. They determine not only how much a company can pay shareholders today, but also how much it can sustainably grow those payments in the future. Benjamin Graham, the father of value investing, put it best when he said, “In the short run, the market is a voting machine, but in the long run, it is a weighing machine.” What it weighs, of course, is earnings power, the ability of a business to generate consistent, growing profits.

For dividend growth investors, that principle sits at the core of every decision we make. Our strategy is built on identifying high-quality companies that can reliably grow earnings over time. Why? Because earnings growth funds dividend growth, and dividend growth fuels long-term total returns. In fact, over the long run, the two are almost always aligned. When a company’s earnings compound steadily, its dividends tend to follow a similar upward path.

Earnings: The Foundation of Dividend Safety

A company that earns more each year can afford to raise its dividend without jeopardizing its balance sheet. When earnings stagnate or decline, the payout ratio, the percentage of profits paid out as dividends, begins to creep higher, and that is when risk enters the picture. The most sustainable dividend growth stories are those backed by stable, predictable earnings streams.

That is why our process emphasizes quality first. We look for businesses with durable competitive advantages, recurring revenues, and management teams that allocate capital wisely. These companies tend to produce consistent earnings regardless of economic cycles. Think of regulated utilities, consumer staples, or railways, sectors where steady demand supports steady profits. When earnings are predictable, dividend growth becomes predictable too.

The Power of Compounding Earnings

Earnings growth does not just support dividends; it multiplies value. Over time, compounding earnings translate into higher share prices, creating the classic “double double” effect of dividend growth investing: rising income and rising capital value.

John Bogle, another investing legend, famously summarized expected market returns as:


Future Returns = Dividend Yield + Earnings Growth (Dividend Growth) ± Change in Valuation.


That middle term, earnings growth, is what really moves the needle over decades. Even if valuations fluctuate, companies that consistently grow earnings at 8 to 10 percent annually tend to deliver similar total returns over the long run. Dividend growth often mirrors that same pace, since management teams typically aim to keep payout ratios steady as profits increase.

Why We Focus on Earnings Trends

In our model portfolios, we spend less time predicting next quarter’s numbers and more time studying long-term earnings trajectories. We look for a track record of at least ten years of growth, the accuracy of analyst forecasts, and how management has performed against those expectations. These trends tell us far more about the reliability of future dividends than any headline or market forecast.

When we find companies that pair consistent earnings growth with sensible valuations, we are willing to be patient owners. As earnings compound, dividends follow, and so does total shareholder wealth.

Takeaway


Dividends may be what we see and collect, but earnings are what make them possible. Over time, dividend growth and earnings growth move hand in hand, reinforcing one another. For the dividend growth investor, understanding and respecting that relationship is the difference between chasing yield and building lasting wealth. In the end, it is not the market’s opinion that counts, it is the steady, growing earnings behind the businesses we own that do the heavy lifting.

Become a paid partner, and I’ll show you exactly how I do it. With real money. In real stocks. In addition, gain full access to this post and exclusive, subscriber-only content. We do the work; you stay in control. Subscribe today and take your dividend growth investing to the next level!

DGI Scorecard

 
The List (2025)


The Magic Pants 2025 list includes 29 Canadian dividend growth stocks. Here are the criteria to be considered a candidate on ‘The List’:

  1. Dividend growth streak: 10 years or more.
  2. Market cap: Minimum one billion dollars.
  3. Diversification: Limit of five companies per sector, preferably two per industry.
  4. Cyclicality: Exclude REITs and pure-play energy companies due to high cyclicality.

Based on these criteria, companies are added or removed from ‘The List’ annually on January 1. Prices and dividends are updated weekly.

‘The List’ is not a portfolio but a coaching tool that helps us think about ideas and risk manage our model portfolio. We own some but not all the companies on ‘The List’. In other words, we might want to buy these companies when valuation looks attractive.

Our newsletter provides readers with a comprehensive insight into the implementation and advantages of our Canadian dividend growth investing strategy. This evidence-based, unbiased approach empowers DIY investors to outperform both actively managed dividend funds and passively managed indexes and dividend ETFs over longer-term horizons.

Performance of ‘The List’


Last week, dividend growth stayed the same, with an average return of +7.1% YTD (income).

The price of ‘The List’ was up from the previous week, with an average YTD return of +10.3% (capital).

Last week’s best performers on ‘The List’ were Intact Financial (IFC-T), up +7.09%.; Canadian Tire (CTC-A-T), up +6.93%; and Magna (MGA-N) up +5.63%.

goeasy Ltd. (GSY-T) was the worst performer last week, down -23.24%.

SYMBOL COMPANY YLD PRICE YTD % DIV YTD % STREAK
ATD-T Alimentation Couche-Tard Inc. 1.1% $68.51 -13.33% $0.78 8.3% 15
BCE-T Bell Canada 8.8% $32.53 -2.95% $2.87 -28.1% 16
BIP-N Brookfield Infrastructure Partners 4.9% $35.22 10.55% $1.72 6.2% 17
CCL-B-T CCL Industries Inc. 1.6% $79.12 7.47% $1.28 10.3% 23
CNR-T Canadian National Railway 2.7% $133.31 -9.18% $3.55 5.0% 29
CTC-A-T Canadian Tire 4.1% $171.99 11.89% $7.10 1.4% 14
CU-T Canadian Utilities Limited 4.5% $41.08 18.11% $1.83 1.0% 53
DOL-T Dollarama Inc. 0.2% $184.94 31.91% $0.41 18.1% 14
EMA-T Emera 4.3% $67.23 25.59% $2.92 1.2% 18
ENB-T Enbridge Inc. 5.6% $66.94 8.19% $3.77 3.0% 29
ENGH-T Enghouse Systems Limited 5.5% $20.98 -22.47% $1.16 16.0% 18
FNV-N Franco Nevada 0.8% $192.12 58.61% $1.52 5.6% 17
FTS-T Fortis Inc. 3.5% $71.96 20.70% $2.49 4.2% 51
GSY-T goeasy Ltd. 4.5% $129.46 -22.55% $5.84 24.8% 10
IFC-T Intact Financial 1.9% $280.17 6.54% $5.32 9.9% 20
L-T Loblaw Companies Limited 1.0% $56.62 19.05% $0.55 15.2% 13
MFC-T Manulife Financial 3.8% $46.85 6.62% $1.76 10.0% 11
MGA-N Magna 3.9% $49.87 19.48% $1.94 2.1% 15
MRU-T Metro Inc. 1.6% $95.01 5.37% $1.48 10.4% 30
RY-T Royal Bank of Canada 3.0% $204.01 18.42% $6.04 7.9% 14
SJ-T Stella-Jones Inc. 1.5% $83.75 14.74% $1.24 10.7% 20
STN-T Stantec Inc. 0.6% $151.44 33.89% $0.89 7.3% 13
T-T Telus 7.9% $20.77 5.81% $1.64 7.0% 21
TD-T TD Bank 3.7% $113.58 48.47% $4.20 2.9% 14
TFII-N TFI International 2.1% $87.34 -34.14% $1.80 12.5% 14
TIH-T Toromont Industries 1.3% $160.98 42.33% $2.08 8.3% 35
TRI-Q Thomson Reuters 1.7% $137.57 -15.28% $2.38 10.2% 31
TRP-T TC Energy Corp. 4.6% $73.26 7.39% $3.40 3.3% 24
WCN-N Waste Connections 0.8% $166.18 -2.20% $1.30 10.7% 15
Averages 3.2% 10.3% 7.1% 21

Note: Stocks ending in “-N or -Q” declare earnings and dividends in US dollars. To achieve currency consistency between dividends and share price for these stocks, we have shown dividends in US dollars and share price in US dollars (these stocks are listed on a US exchange). The dividends for their Canadian counterparts (-T) would be converted into CDN dollars and would fluctuate with the exchange rate.

PAID subscribers enjoy full access to our enhanced weekly newsletter, premium content, and easy-to-follow trade alerts so they can build DGI portfolios alongside ours. This service provides the resources to develop your DGI business plan confidently. We do the work; you stay in control!

It truly is the subscription that pays dividends!

The greatest investment you can make is in yourself. Are you ready to take that step? 

For more articles and the full newsletter, check us out on magicpants.substack.com.

MP Market Review – October 31, 2025

Last updated by BM on November 4, 2025

Summary


Welcome to this week’s MP Market Review – your go-to source for insights and updates on the Canadian dividend growth companies we track on The List! While we’ve expanded our watchlists to include U.S. companies The List-USA, our Canadian lineup remains the cornerstone of our coaching approach.

Don’t miss out on exclusive newsletters and premium content that will help you sharpen your investing strategy. Explore it all at magicpants.substack.com.

Your journey to dividend growth mastery starts here – let’s dive in!

  • Last week, dividend growth of The List was up with an average return of +7.1% YTD (income).
  • Last week, the price of The List was down from the previous week with an average return of +10.0% YTD (capital).
  • Last week, there was one dividend announcement from a company on The List.
  • Last week, there were four earnings reports from companies on The List.
  • This week, fourteen companies from The List will report on earnings.

DGI Clipboard


“The stock market is a device for transferring money from the impatient to the patient.”

– Warren Buffett

7% Income Growth and Counting: The Real Story Behind the DGI Scorecard
Intro


DGI Scorecard Review

In the final newsletter of each month, we feature both our Canadian and American watchlists in the DGI Scorecard section below. A quick glance at the averages at the bottom of each list shows that year-to-date price returns are not spectacular, especially when compared to high-flying AI stocks, gold miners, or tech-heavy indexes. But this should not discourage you.

Remember, these are equally weighted watchlists, not portfolios. They are designed to track high-quality dividend growth companies, not chase short-term trends. More importantly, the year-to-date dividend growth performance of both watchlists continues to impress, averaging over 7% again this year. That is the real story.

For dividend growth investors, the ultimate goal is to own enough high-quality companies that the income your portfolio produces covers your living expenses. At that point, your dividends effectively become your paycheque in retirement, and the best part is that you can look forward to a raise every year as those companies continue to increase their payouts, no matter what the stock market is doing.

While our strategy emphasizes steady income growth, we never lose sight of capital appreciation. The beauty of compounding is that it often works quietly in the background, gaining momentum over time. Its full impact is rarely visible in the short term but becomes increasingly powerful as dividends are reinvested and earnings grow. Patience is essential during these early phases, as compounding tends to reward consistency rather than speed.

We will take a closer look at how this dynamic is unfolding inside our model portfolios when we release our quarterly performance updates later in November.

Takeaway


Even though prices may fluctuate, the dependable growth in our income does not. Stay the course. You will be happy you did.

Become a paid partner, and I’ll show you exactly how I do it. With real money. In real stocks. In addition, gain full access to this post and exclusive, subscriber-only content. We do the work; you stay in control. Subscribe today and take your dividend growth investing to the next level!

DGI Scorecard

 
The List (2025)


The Magic Pants 2025 list includes 29 Canadian dividend growth stocks. Here are the criteria to be considered a candidate on ‘The List’:

  1. Dividend growth streak: 10 years or more.
  2. Market cap: Minimum one billion dollars.
  3. Diversification: Limit of five companies per sector, preferably two per industry.
  4. Cyclicality: Exclude REITs and pure-play energy companies due to high cyclicality.

Based on these criteria, companies are added or removed from ‘The List’ annually on January 1. Prices and dividends are updated weekly.

‘The List’ is not a portfolio but a coaching tool that helps us think about ideas and risk manage our model portfolio. We own some but not all the companies on ‘The List’. In other words, we might want to buy these companies when valuation looks attractive.

Our newsletter provides readers with a comprehensive insight into the implementation and advantages of our Canadian dividend growth investing strategy. This evidence-based, unbiased approach empowers DIY investors to outperform both actively managed dividend funds and passively managed indexes and dividend ETFs over longer-term horizons.

Performance of ‘The List’


Last week, dividend growth was up, with an average return of +7.1% YTD (income).

The price of ‘The List’ was down from the previous week, with an average YTD return of +10.0% (capital).

Last week’s best performers on ‘The List’ were Toromont Industries (TIH-T), up +3.63%.; Magna (MGA-N), up +2.16%; and TD Bank (TD-T) up +1.60%.

Canadian Tire (CTC-A-T) was the worst performer last week, down -6.86%.

SYMBOL COMPANY YLD PRICE YTD % DIV YTD % STREAK
ATD-T Alimentation Couche-Tard Inc. 1.1% $71.28 -9.83% $0.78 8.3% 15
BCE-T Bell Canada 9.0% $32.06 -4.36% $2.87 -28.1% 16
BIP-N Brookfield Infrastructure Partners 5.0% $34.17 7.25% $1.72 6.2% 17
CCL-B-T CCL Industries Inc. 1.6% $78.24 6.28% $1.28 10.3% 23
CNR-T Canadian National Railway 2.6% $134.49 -8.37% $3.55 5.0% 29
CTC-A-T Canadian Tire 4.4% $160.85 4.65% $7.10 1.4% 14
CU-T Canadian Utilities Limited 4.7% $39.28 12.94% $1.83 1.0% 53
DOL-T Dollarama Inc. 0.2% $182.31 30.04% $0.41 18.1% 14
EMA-T Emera 4.4% $66.68 24.57% $2.92 1.2% 18
ENB-T Enbridge Inc. 5.8% $65.40 5.71% $3.77 3.0% 29
ENGH-T Enghouse Systems Limited 5.6% $20.81 -23.10% $1.16 16.0% 18
FNV-N Franco Nevada 0.8% $186.63 54.07% $1.52 5.6% 17
FTS-T Fortis Inc. 3.5% $70.50 18.25% $2.46 3.1% 51
GSY-T goeasy Ltd. 3.5% $168.65 0.89% $5.84 24.8% 10
IFC-T Intact Financial 2.0% $261.63 -0.51% $5.32 9.9% 20
L-T Loblaw Companies Limited 1.0% $55.74 17.20% $0.55 15.2% 13
MFC-T Manulife Financial 3.9% $45.39 3.30% $1.76 10.0% 11
MGA-N Magna 4.1% $47.21 13.10% $1.94 2.1% 15
MRU-T Metro Inc. 1.6% $93.49 3.68% $1.48 10.4% 30
RY-T Royal Bank of Canada 2.9% $205.47 19.27% $6.04 7.9% 14
SJ-T Stella-Jones Inc. 1.6% $79.61 9.07% $1.24 10.7% 20
STN-T Stantec Inc. 0.6% $155.32 37.32% $0.89 7.3% 13
T-T Telus 8.0% $20.51 4.48% $1.64 7.0% 21
TD-T TD Bank 3.6% $115.16 50.54% $4.20 2.9% 14
TFII-N TFI International 2.0% $89.73 -32.34% $1.80 12.5% 14
TIH-T Toromont Industries 1.2% $168.51 48.99% $2.08 8.3% 35
TRI-Q Thomson Reuters 1.6% $153.06 -5.74% $2.38 10.2% 31
TRP-T TC Energy Corp. 4.8% $70.38 3.17% $3.40 3.3% 24
WCN-N Waste Connections 0.8% $167.68 -1.31% $1.30 10.7% 15
Averages 3.2% 10.0% 7.1% 21

Note: Stocks ending in “-N or -Q” declare earnings and dividends in US dollars. To achieve currency consistency between dividends and share price for these stocks, we have shown dividends in US dollars and share price in US dollars (these stocks are listed on a US exchange). The dividends for their Canadian counterparts (-T) would be converted into CDN dollars and would fluctuate with the exchange rate.

PAID subscribers enjoy full access to our enhanced weekly newsletter, premium content, and easy-to-follow trade alerts so they can build DGI portfolios alongside ours. This service provides the resources to develop your DGI business plan confidently. We do the work; you stay in control!

It truly is the subscription that pays dividends!

The greatest investment you can make is in yourself. Are you ready to take that step? 

For more articles and the full newsletter, check us out on magicpants.substack.com.

MP Market Review – October 24, 2025

Last updated by BM on October 28, 2025

Summary


Welcome to this week’s MP Market Review – your go-to source for insights and updates on the Canadian dividend growth companies we track on The List! While we’ve expanded our watchlists to include U.S. companies The List-USA, our Canadian lineup remains the cornerstone of our coaching approach.

Don’t miss out on exclusive newsletters and premium content that will help you sharpen your investing strategy. Explore it all at magicpants.substack.com.

Your journey to dividend growth mastery starts here – let’s dive in!

  • Last week, dividend growth of The List was up with an average return of +7.1% YTD (income).
  • Last week, the price of The List was up from the previous week with an average return of +11.6% YTD (capital).
  • Last week, there was one dividend announcement from a company on The List.
  • Last week, there was one earnings report from companies on The List.
  • This week, four companies from The List will report on earnings.

DGI Clipboard


“Once valuations become unusually rich, disappointingly long-term returns are baked in the cake.”

— John Hussman

How to Get the Most Out of Our Weekly Newsletter
Intro


Your Guide to the Magic Pants Dividend Growth Newsletter

Last week, we introduced “The Retirement Plan You Can Write on a Napkin.” We also pointed out that although our dividend growth investing (DGI) strategy is simple to understand, it is not easy. That is why this newsletter exists: to keep you focused through the noise and emotions that come with disciplined long-term investing.

Each issue is designed to help you stay grounded week to week and calm over the long haul. Here’s what to look for:

  1. The Opening Snapshot

We begin with a clear headline and a quick snapshot of key DGI metrics:

  • Year-to-date dividend and price growth from The List
  • Dividend announcements
  • Earnings updates

Think of it as your fast weekly briefing.

  1. The DGI Clipboard: Where the Coaching Happens

This is the heart of the newsletter. Each week I dig into an investing topic, connect it to our DGI strategy, and share supporting quotes or charts.

It is called the Clipboard because this is where the real coaching happens, just like drawing up plays behind the bench in a hockey game.

  1. The DGI Scorecard: Tracking Our Watchlist

Here we track the performance of The List, highlight the week’s top and bottom performers. On the final week of each month, we also share a similar scorecard for The List-USA, giving you a clear view of trends on both sides of the border.

Key metrics to watch:

  • Starting yield
  • Dividend growth (YTD)
  • Price change (YTD)

If price runs ahead of yield plus dividend growth, valuations may be getting stretched. If it lags, opportunities may be emerging.

Reminder: The List is a teaching tool, not a portfolio.

  1. DGI News: Cutting Through the Noise

Each week I select a few relevant headlines, share the links, and add a quick take. This saves you time and keeps you informed on what the financial media is saying and the markets are doing.

  1. DGI Updates: Company Earnings and Dividend Moves

We finish with updates from companies on The List:

  • Dividend announcements
  • Quarterly earnings recaps
  • Links to full earnings reports

For paid subscribers, this section provides additional research for those wanting to understand the companies we follow a bit better.

Takeaway


This is more than a newsletter. It is your coaching tool for building a growing and reliable income stream while helping you stay disciplined over time.

Become a paid partner, and I’ll show you exactly how I do it. With real money. In real stocks. In addition, gain full access to this post and exclusive, subscriber-only content. We do the work; you stay in control. Subscribe today and take your dividend growth investing to the next level!

DGI Scorecard

 
The List (2025)


The Magic Pants 2025 list includes 29 Canadian dividend growth stocks. Here are the criteria to be considered a candidate on ‘The List’:

  1. Dividend growth streak: 10 years or more.
  2. Market cap: Minimum one billion dollars.
  3. Diversification: Limit of five companies per sector, preferably two per industry.
  4. Cyclicality: Exclude REITs and pure-play energy companies due to high cyclicality.

Based on these criteria, companies are added or removed from ‘The List’ annually on January 1. Prices and dividends are updated weekly.

‘The List’ is not a portfolio but a coaching tool that helps us think about ideas and risk manage our model portfolio. We own some but not all the companies on ‘The List’. In other words, we might want to buy these companies when valuation looks attractive.

Our newsletter provides readers with a comprehensive insight into the implementation and advantages of our Canadian dividend growth investing strategy. This evidence-based, unbiased approach empowers DIY investors to outperform both actively managed dividend funds and passively managed indexes and dividend ETFs over longer-term horizons.

Performance of ‘The List’


Last week, dividend growth was up, with an average return of +7.1% YTD (income).

The price of ‘The List’ was up from the previous week, with an average YTD return of +11.6% (capital).

Even though prices may fluctuate, the dependable growth in our income does not. Stay the course. You will be happy you did.

Last week’s best performers on ‘The List’ were CCL Industries Inc. (CCL-B-T), up +4.85%.; goeasy Ltd. (GSY-T), up +4.55%; and Toromont Industries (TIH-T) up +3.59%.

Franco Nevada (FNV-N) was the worst performer last week, down -6.67%.

SYMBOL COMPANY YLD PRICE YTD % DIV YTD % STREAK
ATD-T Alimentation Couche-Tard Inc. 1.0% $74.47 -5.79% $0.78 8.3% 15
BCE-T Bell Canada 8.6% $33.33 -0.57% $2.87 -28.1% 16
BIP-N Brookfield Infrastructure Partners 5.0% $34.15 7.19% $1.72 6.2% 17
CCL-B-T CCL Industries Inc. 1.6% $81.06 10.11% $1.28 10.3% 23
CNR-T Canadian National Railway 2.7% $133.43 -9.10% $3.55 5.0% 29
CTC-A-T Canadian Tire 4.1% $172.69 12.35% $7.10 1.4% 14
CU-T Canadian Utilities Limited 4.6% $40.20 15.58% $1.83 1.0% 53
DOL-T Dollarama Inc. 0.2% $185.78 32.51% $0.41 18.1% 14
EMA-T Emera 4.2% $69.17 29.22% $2.92 1.2% 18
ENB-T Enbridge Inc. 5.7% $65.65 6.11% $3.77 3.0% 29
ENGH-T Enghouse Systems Limited 5.5% $21.09 -22.06% $1.16 16.0% 18
FNV-N Franco Nevada 0.8% $190.10 56.94% $1.52 5.6% 17
FTS-T Fortis Inc. 3.4% $71.96 20.70% $2.46 3.1% 51
GSY-T goeasy Ltd. 3.5% $166.66 -0.30% $5.84 24.8% 10
IFC-T Intact Financial 2.0% $262.70 -0.10% $5.32 9.9% 20
L-T Loblaw Companies Limited 1.0% $57.95 21.85% $0.55 15.2% 13
MFC-T Manulife Financial 3.9% $45.67 3.94% $1.76 10.0% 11
MGA-N Magna 4.2% $46.21 10.71% $1.94 2.1% 15
MRU-T Metro Inc. 1.6% $94.47 4.77% $1.48 10.4% 30
RY-T Royal Bank of Canada 2.9% $206.89 20.10% $6.04 7.9% 14
SJ-T Stella-Jones Inc. 1.6% $78.46 7.49% $1.24 10.7% 20
STN-T Stantec Inc. 0.6% $156.84 38.66% $0.89 7.3% 13
T-T Telus 7.8% $21.08 7.39% $1.64 7.0% 21
TD-T TD Bank 3.7% $113.35 48.17% $4.20 2.9% 14
TFII-N TFI International 2.0% $90.74 -31.57% $1.80 12.5% 14
TIH-T Toromont Industries 1.3% $162.61 43.78% $2.08 8.3% 35
TRI-Q Thomson Reuters 1.5% $162.60 0.14% $2.38 10.2% 31
TRP-T TC Energy Corp. 4.8% $70.55 3.42% $3.40 3.3% 24
WCN-N Waste Connections 0.7% $176.82 4.07% $1.30 10.7% 15
Averages 3.1% 11.6% 7.1% 21

Note: Stocks ending in “-N or -Q” declare earnings and dividends in US dollars. To achieve currency consistency between dividends and share price for these stocks, we have shown dividends in US dollars and share price in US dollars (these stocks are listed on a US exchange). The dividends for their Canadian counterparts (-T) would be converted into CDN dollars and would fluctuate with the exchange rate.

PAID subscribers enjoy full access to our enhanced weekly newsletter, premium content, and easy-to-follow trade alerts so they can build DGI portfolios alongside ours. This service provides the resources to develop your DGI business plan confidently. We do the work; you stay in control!

It truly is the subscription that pays dividends!

The greatest investment you can make is in yourself. Are you ready to take that step? 

For more articles and the full newsletter, check us out on magicpants.substack.com.

MP Market Review – October 17, 2025

Last updated by BM on October 21, 2025

Summary


Welcome to this week’s MP Market Review – your go-to source for insights and updates on the Canadian dividend growth companies we track on The List! While we’ve expanded our watchlists to include U.S. companies The List-USA, our Canadian lineup remains the cornerstone of our coaching approach.

Don’t miss out on exclusive newsletters and premium content that will help you sharpen your investing strategy. Explore it all at magicpants.substack.com.

Your journey to dividend growth mastery starts here – let’s dive in!

  • Last week, dividend growth of The List stayed the same with an average return of +6.9% YTD (income).
  • Last week, the price of The List was up from the previous week with an average return of +11.3% YTD (capital).
  • Last week, there were no dividend announcements from companies on The List.
  • Last week, there were no earnings reports from companies on The List.
  • This week, one company from The List will report on earnings.

DGI Clipboard


“Never invest in any idea you can’t illustrate with a crayon.”

— Peter Lynch

The Retirement Plan You Can Write On A Napkin
Intro


One of the best parts of having a growing subscriber base is the conversations it creates. When people reach out, I get to hear what’s on their minds, their goals, their questions, and their fears.

Our Timely Ten article last week drew nearly 1,000 views. That tells me our dividend growth investing (DGI) strategy is connecting with many of you.

At the same time, I’ve noticed a familiar theme that always surfaces in markets like this. Some investors are feeling the pressure of “missing out” on the surge in tech and gold stocks and the index performance that comes with it.

That feeling is completely normal. Even the most disciplined long-term investors can find it difficult to stay the course when momentum runs hot. Add in calls from advisors touting short-term ETF performance, and the temptation to chase returns becomes very real.

For those who’ve followed my work for a while, you know my investing journey spans more than forty years. I’ve felt this same pull many times. But what has kept me grounded is a clear, repeatable plan. As I wrote years ago in my original “About” page when I began sharing and coaching this process:

“Many investors believe the best strategy is to chase maximum total return and then sell shares to fund their lifestyle. I tried that approach. It’s harder than it looks.

While you can create your own “dividends” by selling shares, it forces constant buying and selling. Over time, those transactions lead to timing errors, emotional decisions, and costly mistakes.

ETFs didn’t solve it either. They hold too many underperformers, which makes it mathematically impossible to beat the index they track. Over diversification may smooth the ride a little, but it doesn’t protect against losses.

My research eventually led me to dividend growth investing. Instead of selling assets, you collect and grow your income. Dividend growth investors focus on quality, ignore short-term price swings, and let rising dividends do the heavy lifting.

When your income grows steadily, your capital usually follows. That’s the power of cash flow over guesswork.”

Fast forward to today, I’ve taken this timeless concept and layered in some ideas of my own. I like to call it our DGI Napkin Plan, a simple idea with the power to change the way you think about retirement.

Here it is: Focus on high-quality dividend growth companies, buy them at sensible valuations, aim for an average 3% starting yield with at least 7% annual dividend growth, and hold. Initial yield plus dividend growth becomes your estimated capital growth rate.

The math is simple, but compounding turns simple into powerful. Here’s how it looks, starting with $100,000 or $1,000,000 of investment savings.

Source: Magic Pants Wealth-Builder Model Portfolio (CDN) Business Plan

Investing larger amounts of initial capital gets your investment snowball rolling much faster. Here’s an example projection for investing $1,000,000 using the same simple, disciplined DGI approach.

The only other requirement is that you contribute $12,000 per year starting in Year 2. That’s it. No timing the market. No complicated trades. Just a disciplined process that compounds quietly in the background.

If the $100K projection chart looks familiar, that’s because it is. It’s part of the business plan behind our public-facing model portfolios in both Canada and the United States. This is a proven, long-term approach that builds durable wealth decade after decade. It may not feel exciting in the short term, but time and compounding do the heavy lifting.

And here’s the real magic. Year ten isn’t the finish line. It’s just the point where the snowball really starts to accelerate. Both your income and capital keep growing well beyond that.

Takeaway


For many investors, the hardest part of the DGI journey is waiting for compounding to do its quiet work. If that’s you, consider setting up one or two separate investment buckets to channel that urge. Personally, I invest in real estate and precious metals outside my DGI portfolio. This allows me to stay disciplined with my core strategy while still exploring other opportunities on the side.

A word of caution, though: those other buckets often involve market timing and a very different skill set. That’s why, for most of us, DGI remains the most dependable, passive path to building wealth. It’s simple, but not always easy. And that’s exactly why it works.

Real wealth is built quietly, not quickly.

Become a paid partner, and I’ll show you exactly how I do it. With real money. In real stocks. In addition, gain full access to this post and exclusive, subscriber-only content. We do the work; you stay in control. Subscribe today and take your dividend growth investing to the next level!

DGI Scorecard

 
The List (2025)


The Magic Pants 2025 list includes 29 Canadian dividend growth stocks. Here are the criteria to be considered a candidate on ‘The List’:

  1. Dividend growth streak: 10 years or more.
  2. Market cap: Minimum one billion dollars.
  3. Diversification: Limit of five companies per sector, preferably two per industry.
  4. Cyclicality: Exclude REITs and pure-play energy companies due to high cyclicality.

Based on these criteria, companies are added or removed from ‘The List’ annually on January 1. Prices and dividends are updated weekly.

‘The List’ is not a portfolio but a coaching tool that helps us think about ideas and risk manage our model portfolio. We own some but not all the companies on ‘The List’. In other words, we might want to buy these companies when valuation looks attractive.

Our newsletter provides readers with a comprehensive insight into the implementation and advantages of our Canadian dividend growth investing strategy. This evidence-based, unbiased approach empowers DIY investors to outperform both actively managed dividend funds and passively managed indexes and dividend ETFs over longer-term horizons.

Performance of ‘The List’


Last week, dividend growth stayed the same, with an average return of +6.9% YTD (income).

The price of ‘The List’ was up from the previous week, with an average YTD return of +11.3% (capital).

Even though prices may fluctuate, the dependable growth in our income does not. Stay the course. You will be happy you did.

Last week’s best performers on ‘The List’ were TFII-N (TFII-N), up +9.27%.; Loblaw Companies Limited (L-T), up +4.74%; and Thomson Reuters (TRI-Q) up +4.70%.

Intact Financial (IFC-T) was the worst performer last week, down -4.07%.

SYMBOL COMPANY YLD PRICE YTD % DIV YTD % STREAK
ATD-T Alimentation Couche-Tard Inc. 1.0% $74.95 -5.19% $0.78 8.3% 15
BCE-T Bell Canada 8.4% $33.99 1.40% $2.87 -28.1% 16
BIP-N Brookfield Infrastructure Partners 5.0% $34.30 7.66% $1.72 6.2% 17
CCL-B-T CCL Industries Inc. 1.7% $77.31 5.01% $1.28 10.3% 23
CNR-T Canadian National Railway 2.6% $134.05 -8.67% $3.55 5.0% 29
CTC-A-T Canadian Tire 4.1% $173.14 12.64% $7.10 1.4% 14
CU-T Canadian Utilities Limited 4.6% $39.73 14.23% $1.83 1.0% 53
DOL-T Dollarama Inc. 0.2% $182.97 30.51% $0.41 18.1% 14
EMA-T Emera 4.2% $69.10 29.09% $2.92 1.2% 18
ENB-T Enbridge Inc. 5.7% $65.98 6.64% $3.77 3.0% 29
ENGH-T Enghouse Systems Limited 5.7% $20.45 -24.43% $1.16 16.0% 18
FNV-N Franco Nevada 0.7% $203.69 68.16% $1.52 5.6% 17
FTS-T Fortis Inc. 3.4% $72.47 21.55% $2.46 3.1% 51
GSY-T goeasy Ltd. 3.7% $159.40 -4.64% $5.84 24.8% 10
IFC-T Intact Financial 2.1% $258.62 -1.65% $5.32 9.9% 20
L-T Loblaw Companies Limited 0.9% $59.18 24.43% $0.55 15.2% 13
MFC-T Manulife Financial 4.0% $44.34 0.91% $1.76 10.0% 11
MGA-N Magna 4.3% $44.77 7.26% $1.94 2.1% 15
MRU-T Metro Inc. 1.5% $96.62 7.15% $1.48 10.4% 30
RY-T Royal Bank of Canada 3.0% $204.27 18.58% $6.04 7.9% 14
SJ-T Stella-Jones Inc. 1.5% $80.50 10.29% $1.24 10.7% 20
STN-T Stantec Inc. 0.6% $154.08 36.22% $0.89 7.3% 13
T-T Telus 7.6% $21.48 9.42% $1.64 7.0% 21
TD-T TD Bank 3.8% $111.06 45.18% $4.20 2.9% 14
TFII-N TFI International 1.9% $94.55 -28.70% $1.80 12.5% 14
TIH-T Toromont Industries 1.3% $156.97 38.79% $2.08 8.3% 35
TRI-Q Thomson Reuters 1.5% $158.53 -2.37% $2.38 10.2% 31
TRP-T TC Energy Corp. 4.7% $72.10 5.69% $3.40 3.3% 24
WCN-N Waste Connections 0.7% $172.97 1.80% $1.26 7.7% 15
Averages 3.1% 11.3% 6.9% 21

Note: Stocks ending in “-N or -Q” declare earnings and dividends in US dollars. To achieve currency consistency between dividends and share price for these stocks, we have shown dividends in US dollars and share price in US dollars (these stocks are listed on a US exchange). The dividends for their Canadian counterparts (-T) would be converted into CDN dollars and would fluctuate with the exchange rate.

PAID subscribers enjoy full access to our enhanced weekly newsletter, premium content, and easy-to-follow trade alerts so they can build DGI portfolios alongside ours. This service provides the resources to develop your DGI business plan confidently. We do the work; you stay in control!

It truly is the subscription that pays dividends!

The greatest investment you can make is in yourself. Are you ready to take that step? 

For more articles and the full newsletter, check us out on magicpants.substack.com.

MP Market Review – October 10, 2025

Last updated by BM on October 14, 2025

Summary


Welcome to this week’s MP Market Review – your go-to source for insights and updates on the Canadian dividend growth companies we track on The List! While we’ve expanded our watchlists to include U.S. companies The List-USA, our Canadian lineup remains the cornerstone of our coaching approach.

Don’t miss out on exclusive newsletters and premium content that will help you sharpen your investing strategy. Explore it all at magicpants.substack.com.

Your journey to dividend growth mastery starts here – let’s dive in!

  • Last week, dividend growth of The List stayed the same with an average return of +6.9% YTD (income).
  • Last week, the price of The List was down from the previous week with an average return of +10.0% YTD (capital).
  • Last week, there were no dividend announcements from companies on The List.
  • Last week, there were no earnings reports from companies on The List.
  • This week, no companies from The List will report on earnings.
  • This week, no companies from The List will report on earnings.

DGI Clipboard


“Current yield, using its own historic yield as a guide, is, in my view, a fine valuation measure.”

— Tom Connolly

Timely Ten: Where Smart Dividend Growth Investors Are Looking Next
Intro


Our Timely Ten lists remain the fastest way to spot potential value opportunities, which explains why they continue to be the most-read articles every month.

Timely Ten (CDN)

There was little movement at the top of the Canadian list this month. We already own four of the top five names, so patience, not aggression, is the order of the day.

The biggest change came from goeasy Ltd., which dropped on the release of a short report on September 16. We took the opportunity to add to our position in the model portfolio. (You can read our full thesis in the weekend article.)

Enbridge Inc. also moved higher on price weakness and now sits at the tenth spot.

In the lower half of the list, both Waste Connections and Metro Inc. trended upward. We added to our position sizes in both companies. Detailed write-ups will be published over the next two weeks.

Timely Ten (USA)

The standout mover this month was Air Products and Chemicals, climbing from number thirteen to number eight. The company is facing some near-term challenges, but with 44 consecutive years of dividend growth, we are not counting it out. More research is underway.

On the flip side, NextEra Energy jumped 16% in price and fell from number eight to number thirteen on the list. Our patience in building this position in 2023 appears to be paying off.

We are also watching Automatic Data Processing closely. It has climbed from number nineteen to number seventeen in just 30 days and is approaching an attractive valuation zone. As a Dividend King with 50 consecutive years of increases and a history of double-digit annualized returns, it is firmly on our radar to add to the portfolio.

Each month, the Timely Ten lists surface real, actionable ideas. Some require more research, while others are ready to act on today. This disciplined framework keeps us focused on quality and valuation, not market noise.

Here’s a recap on how we select our Timely Ten:

Step three in our process involves monitoring our quality dividend growers regularly, which can become quite challenging depending on the number of companies we track. Fortunately, we rely on ‘The List’ instead of the vast array of stocks in the index, which streamlines our task. Nevertheless, we continually seek methods to enhance our efficiency. Through dividend yield theory, we’ve discovered an approach that has proven remarkably effective in aiding us with our efforts over the years.

Dividend yield theory is a simple and intuitive approach to valuing dividend growth stocks. It suggests that the dividend yield of quality dividend growth stocks tends to revert to the mean over time, assuming that the underlying business model remains stable. In practical terms, if a stock pays a dividend yield above its ten-year average annual yield, its price will likely increase to return the yield to its historical average. Knowing that price and yield go in opposite directions, this theory helps us find stocks poised for a favourable price correction.

We have pre-screened our candidates using the criteria we initially laid out in building our watchlists. This helps us considerably narrow the universe of investable stocks.

  1. Dividend growth streak: 10 years or more.
  2. Market cap: Minimum one billion dollars.
  3. Diversification: Limit of five companies per sector, preferably two per industry.
  4. Cyclicality: Exclude REITs and pure-play energy companies due to high cyclicality.

Next, we rank our Canadian and American watchlists based on how far each stock’s price is below its fair value (Low Price), as determined by dividend yield theory. To find fair value, divide the current dividend (Dividend) by the stock’s historical high yield (High Yield).

Since price and yield move in opposite directions, a lower price results in a higher yield, and vice versa. The ten companies above the thick black line have a current price (Price) below fair value (Low Price). Put simply, these stocks have a current dividend yield higher than their historically high yield. According to dividend yield theory, these companies are sensibly priced and have the highest probability of a price increase in the short term. These are our Timely Ten.

Takeaway


History shows the Timely Ten is fertile ground for finding attractive entry points into high-quality dividend growers. Whether or not you act on the names, the list serves its purpose: to surface opportunities when quality meets value.

When making investment decisions, always prioritize a company’s ‘quality’ over a ‘sensible price’. For more details on our quality indicators, download our Free Guide to Finding Quality Dividend Growth Stocks here.

Become a paid partner, and I’ll show you exactly how I do it. With real money. In real stocks. In addition, gain full access to this post and exclusive, subscriber-only content. We do the work; you stay in control. Subscribe today and take your dividend growth investing to the next level!

DGI Scorecard

 
The List (2025)


The Magic Pants 2025 list includes 29 Canadian dividend growth stocks. Here are the criteria to be considered a candidate on ‘The List’:

  1. Dividend growth streak: 10 years or more.
  2. Market cap: Minimum one billion dollars.
  3. Diversification: Limit of five companies per sector, preferably two per industry.
  4. Cyclicality: Exclude REITs and pure-play energy companies due to high cyclicality.

Based on these criteria, companies are added or removed from ‘The List’ annually on January 1. Prices and dividends are updated weekly.

‘The List’ is not a portfolio but a coaching tool that helps us think about ideas and risk manage our model portfolio. We own some but not all the companies on ‘The List’. In other words, we might want to buy these companies when valuation looks attractive.

Our newsletter provides readers with a comprehensive insight into the implementation and advantages of our Canadian dividend growth investing strategy. This evidence-based, unbiased approach empowers DIY investors to outperform both actively managed dividend funds and passively managed indexes and dividend ETFs over longer-term horizons.

Performance of ‘The List’


Last week, dividend growth stayed the same, with an average return of +6.9% YTD (income).

The price of ‘The List’ was down from the previous week, with an average YTD return of +10.0% (capital).

Even though prices may fluctuate, the dependable growth in our income does not. Stay the course. You will be happy you did.

Last week’s best performers on ‘The List’ were Loblaw Companies Limited (L-T), up +2.93%.; Emera (EMA-T), up +2.71%; and Bell Canada (BCE-T) up +2.64%.

Magna (MGA-N) was the worst performer last week, down -11.14%.

SYMBOL COMPANY YLD PRICE YTD % DIV YTD % STREAK
ATD-T Alimentation Couche-Tard Inc. 1.1% $73.13 -7.49% $0.78 8.3% 15
BCE-T Bell Canada 8.6% $33.46 -0.18% $2.87 -28.1% 16
BIP-N Brookfield Infrastructure Partners 5.0% $34.38 7.91% $1.72 6.2% 17
CCL-B-T CCL Industries Inc. 1.7% $75.82 2.99% $1.28 10.3% 23
CNR-T Canadian National Railway 2.7% $132.24 -9.91% $3.55 5.0% 29
CTC-A-T Canadian Tire 4.2% $167.91 9.24% $7.10 1.4% 14
CU-T Canadian Utilities Limited 4.7% $39.04 12.25% $1.83 1.0% 53
DOL-T Dollarama Inc. 0.2% $174.88 24.74% $0.41 18.1% 14
EMA-T Emera 4.2% $68.61 28.17% $2.92 1.2% 18
ENB-T Enbridge Inc. 5.6% $66.77 7.92% $3.77 3.0% 29
ENGH-T Enghouse Systems Limited 5.6% $20.56 -24.02% $1.16 16.0% 18
FNV-N Franco Nevada 0.7% $204.62 68.93% $1.52 5.6% 17
FTS-T Fortis Inc. 3.4% $71.46 19.86% $2.46 3.1% 51
GSY-T goeasy Ltd. 3.7% $158.29 -5.31% $5.84 24.8% 10
IFC-T Intact Financial 2.0% $269.60 2.52% $5.32 9.9% 20
L-T Loblaw Companies Limited 1.0% $56.50 18.80% $0.55 15.2% 13
MFC-T Manulife Financial 4.0% $44.41 1.07% $1.76 10.0% 11
MGA-N Magna 4.5% $43.54 4.31% $1.94 2.1% 15
MRU-T Metro Inc. 1.6% $93.54 3.74% $1.48 10.4% 30
RY-T Royal Bank of Canada 3.0% $201.20 16.79% $6.04 7.9% 14
SJ-T Stella-Jones Inc. 1.5% $81.27 11.34% $1.24 10.7% 20
STN-T Stantec Inc. 0.6% $153.23 35.47% $0.89 7.3% 13
T-T Telus 7.7% $21.34 8.71% $1.64 7.0% 21
TD-T TD Bank 3.8% $109.78 43.50% $4.20 2.9% 14
TFII-N TFI International 2.1% $86.53 -34.75% $1.80 12.5% 14
TIH-T Toromont Industries 1.3% $157.24 39.03% $2.08 8.3% 35
TRI-Q Thomson Reuters 1.6% $151.42 -6.75% $2.38 10.2% 31
TRP-T TC Energy Corp. 4.6% $73.93 8.37% $3.40 3.3% 24
WCN-N Waste Connections 0.7% $172.85 1.73% $1.26 7.7% 15
Averages 3.2% 10.0% 6.9% 21

Note: Stocks ending in “-N or -Q” declare earnings and dividends in US dollars. To achieve currency consistency between dividends and share price for these stocks, we have shown dividends in US dollars and share price in US dollars (these stocks are listed on a US exchange). The dividends for their Canadian counterparts (-T) would be converted into CDN dollars and would fluctuate with the exchange rate.

PAID subscribers enjoy full access to our enhanced weekly newsletter, premium content, and easy-to-follow trade alerts so they can build DGI portfolios alongside ours. This service provides the resources to develop your DGI business plan confidently. We do the work; you stay in control!

It truly is the subscription that pays dividends!

The greatest investment you can make is in yourself. Are you ready to take that step? 

For more articles and the full newsletter, check us out on magicpants.substack.com.

MP Market Review – October 3, 2025

Last updated by BM on October 7, 2025

Summary


Welcome to this week’s MP Market Review – your go-to source for insights and updates on the Canadian dividend growth companies we track on The List! While we’ve expanded our watchlists to include U.S. companies The List-USA, our Canadian lineup remains the cornerstone of our coaching approach.

Don’t miss out on exclusive newsletters and premium content that will help you sharpen your investing strategy. Explore it all at magicpants.substack.com.

Your journey to dividend growth mastery starts here – let’s dive in!

  • Last week, dividend growth of The List stayed the same with an average return of +6.9% YTD (income).
  • Last week, the price of The List was up from the previous week with an average return of +11.9% YTD (capital).
  • Last week, there were no dividend announcements from companies on The List.
  • Last week, there were no earnings reports from companies on The List.
  • This week, no companies from The List will report on earnings.

DGI Clipboard


“Success in investing has two parts: finding edge and fully taking advantage of it through proper position sizing.

– Michael J. Mauboussin

How to Turn a Good DGI Watchlist Into A Great DGI Portfolio
Intro


YTD Performance: The List +11.9% | Model Portfolio (CDN) +20.0%

Each January, we assemble a curated watchlist of Canadian and American dividend growth companies that we monitor throughout the year. These lists help coach our process, guide new investments, and serve as the foundation for our model portfolios.

We rarely invest outside these lists, but how we weight our investments once they enter the portfolio is what creates the edge.

The List: A Quality Benchmark 

Think of The List as an equal-weighted exchange-traded fund (ETF) made up of Canada’s best dividend growth companies. The performance you see, like this year’s +11.9% gain, assumes equal investment in every stock on January 1.

That is impressive on its own, but our Wealth-Builder Model Portfolio (CDN) has delivered nearly double the return.

The Secret: Position Sizing with Purpose

Before any company from the watchlist earns a place in our model portfolio, it must pass two final hurdles:

  1. Quality – look for only the best of the best when we invest. Stocks must possess as many of our quality indicators as possible.
  2. Valuation – look to buy a quality company that is sensibly priced based on historical fundamentals and valuation metrics.

Once in the portfolio, we apply a position sizing framework. Core holdings, our highest-quality companies, receive larger allocations. Non-core holdings take smaller weights.

This disciplined approach tilts the odds in our favor and amplifies the performance of our best ideas.

As an example: Had we weighted each company equally, our return of our model portfolio this year would have almost mirrored The List at +12.1%. By sizing positions in line with our current portfolio position sizes, the Wealth-Builder Model Portfolio (CDN) would stand at +20.0% YTD.

Source: Magic Pants Wealth-Builder Model Portfolio (CDN) as of October 3, 2025

Why It Matters

Position sizing is the quiet advantage few investors talk about. It magnifies the contribution of your best businesses while minimizing the drag from the rest. Over time, this simple principle compounds into a meaningful performance gap.

Takeaway


Our watchlists are a valuable resource for anyone looking to build or refine a dividend growth investing (DGI) portfolio. They provide a strong foundation of quality, but the real edge comes from disciplined position sizing and valuation-based buying.

Understanding the process is one thing; executing it is another. For investors who want to follow along, receive real-time updates, and access our full model portfolio strategy, become a paid subscriber and see how our edge compounds over time.

Become a paid partner, and I’ll show you exactly how I do it. With real money. In real stocks. In addition, gain full access to this post and exclusive, subscriber-only content. We do the work; you stay in control. Subscribe today and take your dividend growth investing to the next level!

DGI Scorecard

 
The List (2025)


The Magic Pants 2025 list includes 29 Canadian dividend growth stocks. Here are the criteria to be considered a candidate on ‘The List’:

  1. Dividend growth streak: 10 years or more.
  2. Market cap: Minimum one billion dollars.
  3. Diversification: Limit of five companies per sector, preferably two per industry.
  4. Cyclicality: Exclude REITs and pure-play energy companies due to high cyclicality.

Based on these criteria, companies are added or removed from ‘The List’ annually on January 1. Prices and dividends are updated weekly.

‘The List’ is not a portfolio but a coaching tool that helps us think about ideas and risk manage our model portfolio. We own some but not all the companies on ‘The List’. In other words, we might want to buy these companies when valuation looks attractive.

Our newsletter provides readers with a comprehensive insight into the implementation and advantages of our Canadian dividend growth investing strategy. This evidence-based, unbiased approach empowers DIY investors to outperform both actively managed dividend funds and passively managed indexes and dividend ETFs over longer-term horizons.

Performance of ‘The List’


Last week, dividend growth stayed the same, with an average return of +6.9% YTD (income).

The price of ‘The List’ was up from the previous week, with an average YTD return of +11.9% (capital).

Even though prices may fluctuate, the dependable growth in our income does not. Stay the course. You will be happy you did.

Last week’s best performers on ‘The List’ were Stella-Jones Inc. (SJ-T), up +6.18%.; Magna (MGA-N), up +5.11%; and Stantec Inc. (STN-T) up +4.22%.

goeasy Ltd. (GSY-T) was the worst performer last week, down -5.11%.

SYMBOL COMPANY YLD PRICE YTD % DIV YTD % STREAK
ATD-T Alimentation Couche-Tard Inc. 1.0% $74.79 -5.39% $0.78 8.3% 15
BCE-T Bell Canada 8.8% $32.60 -2.74% $2.87 -28.1% 16
BIP-N Brookfield Infrastructure Partners 5.0% $34.17 7.25% $1.72 6.2% 17
CCL-B-T CCL Industries Inc. 1.6% $77.94 5.87% $1.28 10.3% 23
CNR-T Canadian National Railway 2.6% $134.49 -8.37% $3.55 5.0% 29
CTC-A-T Canadian Tire 4.2% $169.60 10.34% $7.10 1.4% 14
CU-T Canadian Utilities Limited 4.7% $38.87 11.76% $1.83 1.0% 53
DOL-T Dollarama Inc. 0.2% $183.58 30.94% $0.41 18.1% 14
EMA-T Emera 4.4% $66.80 24.79% $2.92 1.2% 18
ENB-T Enbridge Inc. 5.4% $69.88 12.95% $3.77 3.0% 29
ENGH-T Enghouse Systems Limited 5.5% $21.13 -21.91% $1.16 16.0% 18
FNV-N Franco Nevada 0.7% $220.18 81.77% $1.52 5.6% 17
FTS-T Fortis Inc. 3.5% $70.14 17.65% $2.46 3.1% 51
GSY-T goeasy Ltd. 3.5% $165.12 -1.22% $5.84 24.8% 10
IFC-T Intact Financial 2.0% $269.11 2.33% $5.32 9.9% 20
L-T Loblaw Companies Limited 1.0% $54.89 15.41% $0.55 15.2% 13
MFC-T Manulife Financial 3.9% $44.57 1.43% $1.76 10.0% 11
MGA-N Magna 4.0% $49.00 17.39% $1.94 2.1% 15
MRU-T Metro Inc. 1.6% $93.07 3.22% $1.48 10.4% 30
RY-T Royal Bank of Canada 2.9% $205.06 19.03% $6.04 7.9% 14
SJ-T Stella-Jones Inc. 1.5% $81.28 11.36% $1.24 10.7% 20
STN-T Stantec Inc. 0.6% $154.20 36.33% $0.89 7.3% 13
T-T Telus 7.5% $21.89 11.51% $1.64 7.0% 21
TD-T TD Bank 3.7% $113.26 48.05% $4.20 2.9% 14
TFII-N TFI International 2.0% $91.16 -31.26% $1.80 12.5% 14
TIH-T Toromont Industries 1.3% $155.72 37.68% $2.08 8.3% 35
TRI-Q Thomson Reuters 1.6% $152.98 -5.79% $2.38 10.2% 31
TRP-T TC Energy Corp. 4.4% $76.89 12.71% $3.40 3.3% 24
WCN-N Waste Connections 0.7% $174.42 2.65% $1.26 7.7% 15
Averages 3.1% 11.9% 6.9% 21

Note: Stocks ending in “-N or -Q” declare earnings and dividends in US dollars. To achieve currency consistency between dividends and share price for these stocks, we have shown dividends in US dollars and share price in US dollars (these stocks are listed on a US exchange). The dividends for their Canadian counterparts (-T) would be converted into CDN dollars and would fluctuate with the exchange rate.

PAID subscribers enjoy full access to our enhanced weekly newsletter, premium content, and easy-to-follow trade alerts so they can build DGI portfolios alongside ours. This service provides the resources to develop your DGI business plan confidently. We do the work; you stay in control!

It truly is the subscription that pays dividends!

The greatest investment you can make is in yourself. Are you ready to take that step? 

For more articles and the full newsletter, check us out on magicpants.substack.com.

MP Market Review – September 26, 2025

Last updated by BM on September 30, 2025

Summary


Welcome to this week’s MP Market Review – your go-to source for insights and updates on the Canadian dividend growth companies we track on The List! While we’ve expanded our watchlists to include U.S. companies The List-USA, our Canadian lineup remains the cornerstone of our coaching approach.

Don’t miss out on exclusive newsletters and premium content that will help you sharpen your investing strategy. Explore it all at magicpants.substack.com.

Your journey to dividend growth mastery starts here – let’s dive in!

  • Last week, dividend growth of The List stayed the same with an average return of +6.9% YTD (income).
  • Last week, the price of The List was down from the previous week with an average return of +10.1% YTD (capital).
  • Last week, there was one dividend announcement from a company on The List.
  • Last week, there were no earnings reports from companies on The List.
  • This week, no companies from The List will report on earnings.

DGI Clipboard


“Setting up and maintaining a simple investing strategy is mechanically easy but psychologically hard. My hope is that by cutting through the inevitable noise that goes along with it, you’ll be a little more disciplined and a lot more successful, which is compounding at its best.”

Tom Bradley, co-founder of Steadyhand Investment Management

Old-Fashioned Lessons That Still Work
Intro


I’ve lost count of how many times I’ve been called old-fashioned for the principles I live by. Whether in business, parenting, or investing, I’ve found it pays to take the best lessons from those who came before us and use them as a foundation for building a productive and successful life.

The pullback in goeasy Ltd. shares this week was a reminder of why a data-driven, historically tested process is so important and why sticking to it matters. Paid subscribers who received my DGI Alert on goeasy saw that I topped up my position after the stock dropped 15%. I don’t know for certain whether the accusations of accounting irregularities have merit, but I feel confident we won’t be talking about them one or two years from now.

Buying quality companies at sensible prices may sound simple, but it’s never easy when the stock price is falling. The discipline to lean in during moments of fear is one of the most valuable lessons I learned early on, and it remains a cornerstone of how dividend growth investing outperforms over time.

Take Toronto-Dominion Bank as an example. A couple of years ago, I wrote an article titled Toronto-Dominion Bank: Time To Supercharge Your Dividend Growth Investing (DGI) Returns when TD was trading near $77. Last Friday it closed above $110. On top of that, our dividend return (growth yield) has already reached 5.4% in just two years, and the compounding is only getting started. Good luck finding that kind of return in on a bond or GIC today.

The investment thesis behind our TD Bank purchase was straightforward: look past the noise surrounding the U.S. banking sector, including credit delinquency fears and uncertainty around the First Horizon acquisition, and focus on TD as a high-quality business trading at a sensible price. More negative headlines followed, but as always, the cream rose to the top.

The Core Lesson

Market narratives are often just noise. Your greatest challenge as an investor is to stay steady when others are unsettled. To keep doing what’s right for you even as the crowd moves the other way. To trust your plan most when you’re tempted to abandon it.

Takeaway


With markets sitting near all-time highs, it’s comforting to know our approach isn’t built on headlines or short-term trends. It’s grounded in timeless principles, tested through history, and shaped by the wisdom of the investing giants who came before us. That foundation, not the noise, guides us forward.

Become a paid partner, and I’ll show you exactly how I do it. With real money. In real stocks. In addition, gain full access to this post and exclusive, subscriber-only content. We do the work; you stay in control. Subscribe today and take your dividend growth investing to the next level!

DGI Scorecard

 
The List (2025)


The Magic Pants 2025 list includes 29 Canadian dividend growth stocks. Here are the criteria to be considered a candidate on ‘The List’:

  1. Dividend growth streak: 10 years or more.
  2. Market cap: Minimum one billion dollars.
  3. Diversification: Limit of five companies per sector, preferably two per industry.
  4. Cyclicality: Exclude REITs and pure-play energy companies due to high cyclicality.

Based on these criteria, companies are added or removed from ‘The List’ annually on January 1. Prices and dividends are updated weekly.

‘The List’ is not a portfolio but a coaching tool that helps us think about ideas and risk manage our model portfolio. We own some but not all the companies on ‘The List’. In other words, we might want to buy these companies when valuation looks attractive.

Our newsletter provides readers with a comprehensive insight into the implementation and advantages of our Canadian dividend growth investing strategy. This evidence-based, unbiased approach empowers DIY investors to outperform both actively managed dividend funds and passively managed indexes and dividend ETFs over longer-term horizons.

Performance of ‘The List’


Last week, dividend growth stayed the same, with an average return of +6.9% YTD (income).

The price of ‘The List’ was down from the previous week, with an average YTD return of +10.1% (capital).

Even though prices may fluctuate, the dependable growth in our income does not. Stay the course. You will be happy you did.

Last week’s best performers on ‘The List’ were Brookfield Infrastructure Partners (BIP-N), up +7.15%.; Emera (EMA-T), up +3.20%; and Canadian Utilities Limited (CU-T) up +2.95%.

goeasy Ltd. (GSY-T) was the worst performer last week, down -14.91%.

SYMBOL COMPANY YLD PRICE YTD % DIV YTD % STREAK
ATD-T Alimentation Couche-Tard Inc. 1.1% $72.64 -8.11% $0.78 8.3% 15
BCE-T Bell Canada 8.9% $32.21 -3.91% $2.87 -28.1% 16
BIP-N Brookfield Infrastructure Partners 5.2% $33.12 3.95% $1.72 6.2% 17
CCL-B-T CCL Industries Inc. 1.6% $79.68 8.23% $1.28 10.3% 23
CNR-T Canadian National Railway 2.7% $129.38 -11.85% $3.55 5.0% 29
CTC-A-T Canadian Tire 4.3% $165.10 7.41% $7.10 1.4% 14
CU-T Canadian Utilities Limited 4.8% $38.42 10.47% $1.83 1.0% 53
DOL-T Dollarama Inc. 0.2% $184.60 31.67% $0.41 18.1% 14
EMA-T Emera 4.4% $65.72 22.77% $2.92 1.2% 18
ENB-T Enbridge Inc. 5.5% $69.09 11.67% $3.77 3.0% 29
ENGH-T Enghouse Systems Limited 5.6% $20.74 -23.36% $1.16 16.0% 18
FNV-N Franco Nevada 0.7% $217.53 79.58% $1.52 5.6% 17
FTS-T Fortis Inc. 3.6% $69.19 16.05% $2.46 3.1% 51
GSY-T goeasy Ltd. 3.4% $174.01 4.10% $5.84 24.8% 10
IFC-T Intact Financial 2.0% $263.60 0.24% $5.32 9.9% 20
L-T Loblaw Companies Limited 1.0% $53.46 12.41% $0.55 15.2% 13
MFC-T Manulife Financial 4.1% $42.89 -2.39% $1.76 10.0% 11
MGA-N Magna 4.2% $46.62 11.69% $1.94 2.1% 15
MRU-T Metro Inc. 1.6% $92.20 2.25% $1.48 10.4% 30
RY-T Royal Bank of Canada 3.0% $203.63 18.20% $6.04 7.9% 14
SJ-T Stella-Jones Inc. 1.6% $76.55 4.88% $1.24 10.7% 20
STN-T Stantec Inc. 0.6% $147.95 30.80% $0.89 7.3% 13
T-T Telus 7.5% $21.83 11.21% $1.64 7.0% 21
TD-T TD Bank 3.8% $110.35 44.25% $4.20 2.9% 14
TFII-N TFI International 2.0% $88.80 -33.04% $1.80 12.5% 14
TIH-T Toromont Industries 1.3% $154.52 36.62% $2.08 8.3% 35
TRI-Q Thomson Reuters 1.5% $157.02 -3.30% $2.38 10.2% 31
TRP-T TC Energy Corp. 4.6% $74.43 9.10% $3.40 3.3% 24
WCN-N Waste Connections 0.7% $172.41 1.47% $1.26 7.7% 15
Averages 3.2% 10.1% 6.9% 21

Note: Stocks ending in “-N or -Q” declare earnings and dividends in US dollars. To achieve currency consistency between dividends and share price for these stocks, we have shown dividends in US dollars and share price in US dollars (these stocks are listed on a US exchange). The dividends for their Canadian counterparts (-T) would be converted into CDN dollars and would fluctuate with the exchange rate.

PAID subscribers enjoy full access to our enhanced weekly newsletter, premium content, and easy-to-follow trade alerts so they can build DGI portfolios alongside ours. This service provides the resources to develop your DGI business plan confidently. We do the work; you stay in control!

It truly is the subscription that pays dividends!

The greatest investment you can make is in yourself. Are you ready to take that step? 

For more articles and the full newsletter, check us out on magicpants.substack.com.

MP Market Review – September 19, 2025

Last updated by BM on September 23, 2025

Summary


Welcome to this week’s MP Market Review – your go-to source for insights and updates on the Canadian dividend growth companies we track on The List! While we’ve expanded our watchlists to include U.S. companies The List-USA, our Canadian lineup remains the cornerstone of our coaching approach.

Don’t miss out on exclusive newsletters and premium content that will help you sharpen your investing strategy. Explore it all at magicpants.substack.com.

Your journey to dividend growth mastery starts here – let’s dive in!

  • Last week, dividend growth of The List stayed the same with an average return of +6.9% YTD (income).
  • Last week, the price of The List was down from the previous week with an average return of +10.8% YTD (capital).
  • Last week, there were no dividend announcements from companies on The List.
  • Last week, there were no earnings reports from companies on The List.
  • This week, no companies from The List will report on earnings.

DGI Clipboard


“However, stock market valuations have reached some truly rarified air. The Shiller cyclically adjusted price-to-earnings ratio is hovering around 37.5. And, as David Rosenberg points out, Over 35 is, “the only cutoff point where every single time [the forward return] is negative.”

Jesse Felder, The Felder Report

Why Overpaying for Dividend Growth Stocks Can Stall Your Wealth


Intro


The quote above speaks to the S&P 500, but the lesson applies no matter where you invest: valuation matters. In our dividend growth investing process, we spend a lot of time emphasizing undervaluation and the importance of buying at a sensible price. For today’s article, though, I want to flip the script and look at the other side of the coin, what can happen when you buy stocks that are overvalued.

Dividend growth investing works because it combines two of the most powerful forces in wealth building: rising income and compounding. The best companies increase their payouts year after year, and over time the snowball effect creates serious results.

But there is a catch. Even the highest-quality dividend grower can deliver disappointing returns if you buy it at the wrong price. Paying too much for a great business is one of the most common mistakes investors make.

Why Quality Alone Is Not Enough

It is tempting to believe that a wide-moat business with a long dividend streak is always worth owning. The problem is that returns depend not only on business quality but also on the valuation you lock in when you buy. If the stock is trading far above its fair value, future returns get squeezed.

A strong dividend record cannot save you from a poor entry point.

The Three Levers of Returns

Three factors drive every dividend growth investment:

  1. Dividend yield at purchase
  2. Future dividend growth
  3. Valuation multiple

If the starting yield is low because the stock is overpriced, the compounding engine is weakened from the start. Worse, when the valuation multiple eventually drifts back to its historical average, you can face years of stagnant or negative price performance.

Imagine a stock that usually yields 3 percent but now yields only 2 percent because the price has run ahead. For that stock to return to its normal yield, the price would need to fall by one-third. That is enough to wipe out several years of dividend growth. 

The Hidden Cost of Overpaying

Buying an overvalued dividend stock does more than hurt your immediate returns. It also carries a heavy opportunity cost. Capital tied up in a stretched valuation is capital that could have been compounding at higher yields elsewhere.

Dividend Yield Theory helps investors avoid this trap. By comparing the current yield to long-term averages, you can quickly spot when a dividend grower has become too expensive.

Investor Psychology at Work

Many investors still pull the trigger on expensive stocks because of behavioral traps:

  • Fear of missing out after a big run
  • Anchoring to recent performance
  • Confirmation bias from hearing only bullish commentary

These biases can push you into thinking that valuation no longer matters. History shows otherwise.

Lessons From the Past

Even legendary Canadian dividend growers have gone through long stretches of poor returns when purchased at extreme valuations. Canadian National Railway (CNR-T) is a good example from the last few years.

The following colours/lines on the FASTgraphs chart shown below represent: 

Black line: Price

Yellow line: Dividend

Orange line: Graham average of usually 15 P/E (price/earnings) for most stocks

Blue line: Normal P/E

Dashed or dotted lines: Estimates only

Green area: Earnings

Green dots: Purchases

CNR-T’s valuation reached its second-highest level in the past decade as of March 2024. For investors who bought at those highs, the road to meaningful returns may take time.

During the subsequent downturn, we have been selectively adding shares (green dots). While the stock has yet to find its bottom, our lower entry points increase the probability of achieving above-average returns once the recovery takes hold.

Fast forward to 2025, and we see a similar story with another quality dividend grower: Metro Inc. (MRU-T). After climbing to a historically high P/E multiple, the stock has begun to retrace. Where it ultimately settles is impossible to predict, but the lesson remains the same as with CNR-T. Valuation matters. By waiting patiently and only buying when the price makes sense, we tilt the odds in our favor. That was exactly our approach in 2023, when Metro’s P/E ratio came close to its lowest point of the decade (green dot), giving us a clear opportunity.

At present, we hold a modest 2% position in MRU-T, leaving us with plenty of dry powder to deploy when valuations once again align with historical fundamentals. This disciplined process of buying quality companies only at sensible prices remains at the heart of our dividend growth investing strategy.

Investors who buy at historical highs can endure long periods of weak performance while waiting for valuations to reset, even though dividends kept rising.

A Smarter Way Forward

Here are four practical ways to avoid the overvaluation trap:

  1. Check the yield against history. If today’s yield is far below the 10- or 20-year average, be cautious.
  2. Be patient. Great companies usually come back into range.
  3. Keep a watchlist. Track your favorite names so you are ready when value returns.

Spread your buys. Invest gradually instead of all at once to reduce timing risk.

Takeaway


Dividend growth investing rewards patience and discipline. Quality matters, but price matters too. Overpaying locks in a weak starting yield, sets you up for valuation compression, and blocks capital from compounding elsewhere.

The winning formula is simple: combine quality with value. Buy dividend growers when they are attractively priced and let time and compounding do the rest.

Become a paid partner, and I’ll show you exactly how I do it. With real money. In real stocks. In addition, gain full access to this post and exclusive, subscriber-only content. We do the work; you stay in control. Subscribe today and take your dividend growth investing to the next level!

DGI Scorecard

 
The List (2025)


The Magic Pants 2025 list includes 29 Canadian dividend growth stocks. Here are the criteria to be considered a candidate on ‘The List’:

  1. Dividend growth streak: 10 years or more.
  2. Market cap: Minimum one billion dollars.
  3. Diversification: Limit of five companies per sector, preferably two per industry.
  4. Cyclicality: Exclude REITs and pure-play energy companies due to high cyclicality.

Based on these criteria, companies are added or removed from ‘The List’ annually on January 1. Prices and dividends are updated weekly.

‘The List’ is not a portfolio but a coaching tool that helps us think about ideas and risk manage our model portfolio. We own some but not all the companies on ‘The List’. In other words, we might want to buy these companies when valuation looks attractive.

Our newsletter provides readers with a comprehensive insight into the implementation and advantages of our Canadian dividend growth investing strategy. This evidence-based, unbiased approach empowers DIY investors to outperform both actively managed dividend funds and passively managed indexes and dividend ETFs over longer-term horizons.

Performance of ‘The List’


Last week, dividend growth stayed the same, with an average return of +6.9% YTD (income).

The price of ‘The List’ was down from the previous week, with an average YTD return of +10.8% (capital).

Even though prices may fluctuate, the dependable growth in our income does not. Stay the course. You will be happy you did.

Last week’s best performers on ‘The List’ were Franco Nevada (FNV-N), up +6.75%.; Toromont Industries (TIH-T), up +3.78%; and TD Bank (TD-T) up +1.95%.

Thomson Reuters (TRI-Q) was the worst performer last week, down -6.06%.

SYMBOL COMPANY YLD PRICE YTD % DIV YTD % STREAK
ATD-T Alimentation Couche-Tard Inc. 1.1% $73.62 -6.87% $0.78 8.3% 15
BCE-T Bell Canada 9.0% $32.00 -4.53% $2.87 -28.1% 16
BIP-N Brookfield Infrastructure Partners 5.6% $30.91 -2.98% $1.72 6.2% 17
CCL-B-T CCL Industries Inc. 1.6% $79.82 8.42% $1.28 10.3% 23
CNR-T Canadian National Railway 2.8% $128.66 -12.35% $3.55 5.0% 29
CTC-A-T Canadian Tire 4.3% $164.70 7.15% $7.10 1.4% 14
CU-T Canadian Utilities Limited 4.9% $37.32 7.30% $1.83 1.0% 53
DOL-T Dollarama Inc. 0.2% $189.66 35.28% $0.41 18.1% 14
EMA-T Emera 4.6% $63.68 18.96% $2.90 0.7% 18
ENB-T Enbridge Inc. 5.5% $68.36 10.49% $3.77 3.0% 29
ENGH-T Enghouse Systems Limited 5.4% $21.36 -21.06% $1.16 16.0% 18
FNV-N Franco Nevada 0.7% $213.93 76.61% $1.52 5.6% 17
FTS-T Fortis Inc. 3.6% $67.94 13.96% $2.46 3.1% 51
GSY-T goeasy Ltd. 2.9% $204.51 22.34% $5.84 24.8% 10
IFC-T Intact Financial 2.0% $271.58 3.27% $5.32 9.9% 20
L-T Loblaw Companies Limited 1.0% $55.47 16.63% $0.55 15.2% 13
MFC-T Manulife Financial 4.0% $43.57 -0.84% $1.76 10.0% 11
MGA-N Magna 4.1% $46.94 12.46% $1.94 2.1% 15
MRU-T Metro Inc. 1.6% $93.94 4.18% $1.48 10.4% 30
RY-T Royal Bank of Canada 3.0% $203.14 17.92% $6.04 7.9% 14
SJ-T Stella-Jones Inc. 1.6% $77.92 6.75% $1.24 10.7% 20
STN-T Stantec Inc. 0.6% $151.24 33.71% $0.89 7.3% 13
T-T Telus 7.5% $21.93 11.72% $1.64 7.0% 21
TD-T TD Bank 3.9% $108.39 41.69% $4.20 2.9% 14
TFII-N TFI International 1.9% $93.45 -29.53% $1.80 12.5% 14
TIH-T Toromont Industries 1.4% $152.64 34.96% $2.08 8.3% 35
TRI-Q Thomson Reuters 1.5% $162.51 0.08% $2.38 10.2% 31
TRP-T TC Energy Corp. 4.7% $72.46 6.22% $3.40 3.3% 24
WCN-N Waste Connections 0.7% $173.97 2.39% $1.26 7.7% 15
Averages 3.2% 10.8% 6.9% 21

Note: Stocks ending in “-N or -Q” declare earnings and dividends in US dollars. To achieve currency consistency between dividends and share price for these stocks, we have shown dividends in US dollars and share price in US dollars (these stocks are listed on a US exchange). The dividends for their Canadian counterparts (-T) would be converted into CDN dollars and would fluctuate with the exchange rate.

PAID subscribers enjoy full access to our enhanced weekly newsletter, premium content, and easy-to-follow trade alerts so they can build DGI portfolios alongside ours. This service provides the resources to develop your DGI business plan confidently. We do the work; you stay in control!

It truly is the subscription that pays dividends!

The greatest investment you can make is in yourself. Are you ready to take that step? 

For more articles and the full newsletter, check us out on magicpants.substack.com.

We buy quality individual dividend growth stocks when they are sensibly priced and hold for the growing income.