MP Market Review – October 28, 2022
Last updated by BM on October 31, 2022
Summary
- This article is part of our weekly series (MP Market Review) highlighting the performance and activity from the previous week related to the financial markets and Canadian dividend growth companies we follow on ‘The List’.
- Last week, ‘The List’ was up again with a minus -4.2% YTD price return (capital). Dividend growth of ‘The List’ remains at +10.3% YTD, demonstrating the rise in income over the last year.
- One company on ‘The List’ announced a dividend increase last week.
- Last week, there were four earnings reports from companies on ‘The List’.
- Seven companies on ‘The List’ are due to report earnings this week.
- Are you looking to build an income portfolio of your own? When you become a premium subscriber, you get exclusive access to the MP Wealth-Builder Model Portfolio (CDN) and subscriber-only content. Start building real wealth today! Learn More
“If earnings not paid out in dividends are all successfully reinvested, then these earnings should produce dividends later; if not, then they are money lost. In short, a stock is worth only what you can get out of it.”
– John Burr Williams, The Theory of Investment Value
Once the Bank of Canada increased interest rates 50 basis points instead of 75, the market took off. It seems that ‘not so bad news’ is now good news!
Despite the green on your screen last week, what has fundamentally changed about the outlook for the Canadian economy?
Let’s take a closer look at the four companies on ‘The List’ that reported Q3 earnings last week and see if there is something to be gleaned from the reports.
Canadian National Railway (CNR-T) had a strong start in delivering the Canadian grain crop to market and seems to be hitting on all cylinders for the rest of 2022, increasing guidance and easily meeting expectations.
Canadian Utilities Limited (CU-T) exceeded expectations and is excited about its recent acquisition of Suncor’s wind and solar assets. The purchase is expected to be earnings and cash flow accretive in the first year of operations.
TFI International (TFII-N) seemed to blow expectations out of the water but the stock quickly retreated and was the worst performer on ‘The List’ last week. Not even an announcement about a 30% increase in their 2023 dividend could save the stock price from falling.
Fortis (FTS-T) does what it normally does, executing on its long-term capital plan, and meeting expectations quarter after quarter and raising its dividend year after year (49 years and counting).
From what we can tell, it was (TFII-N)’s outlook that may have spooked the market. “TFI International’s favorable positioning should enable continued solid results over the remainder of this year and into 2023 assuming no significant degradation in economic conditions.” (TFII-N) is making a big assumption here, and the market wasn’t buying in. They also mentioned in their earnings report that an economic recession is probable, and that would have an adverse effect on their operating companies.
While (CNR-T), (CU-T) and (FTS-T) are aware that the economy is slowing and costs are increasing (inflation), they don’t see that outcome materially impacting their bottom line at this point.
With seven more companies on ‘The List’ reporting this week, we should get a better idea on how good the bad news will be.
Performance of ‘The List’
At the end of the post is a snapshot of ‘The List’ from last Friday’s close. Feel free to click on the ‘The List’ menu item above for a sortable version.
Last week, ‘The List’ was up again with a minus -4.2% YTD price return (capital). Dividend growth of ‘The List’ remains at +10.3% YTD, demonstrating the rise in income over the last year.
The best performers last week on ‘The List’ were Magna (MGA-N), up +10.32%; Brookfield Infrastructure Partners (BIP-N), up +8.43%; and Stantec Inc. (STN-T), up +6.87%.
TFI International (TFII-N), was the worst performer last week, down -2.66%.
Recent News
Investors seem relieved central banks are pivoting on interest rates. They shouldn’t be. (Globe & Mail)
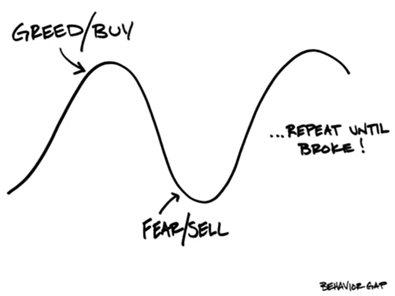
“For now, investors should be patient. When will stocks become truly attractive again? When inflation finally begins falling in earnest and central banks begin mulling interest rate cuts, not just slower hikes. We are not there yet.”
The author mentions that an economic downturn is nearly certain before the end of 2023. He also cautions us to be aware of bear market bounces as periods of market euphoria can take a while to unwind. It is not uncommon for the cycle to play out over years instead of months.
Seven companies on ‘The List’ are due to report earnings this week.
Toromont Industries (TIH-T) will release its third-quarter 2022 results on Tuesday, November 1, 2022, after markets close.
Brookfield Infrastructure Partners (BIP-N) will release its third-quarter 2022 results on Wednesday, November 2, 2022, before markets open.
Waste Connections (WCN-N) will release its third-quarter 2022 results on Wednesday, November 2, 2022, after markets close.
Bell Canada (BCE-T) will release its third-quarter 2022 results on Thursday, November 3, 2022, before markets open.
Telus (T-T) will release its third-quarter 2022 results on Friday, November 4, 2022, before markets open.
Enbridge Inc. (ENB-T) will release its third-quarter 2022 results on Friday, November 4, 2022, before markets open.
Magna (MGA-N) will release its third-quarter 2022 results on Friday, November 4, 2022, before markets open.
Dividend Increases
One company on ‘The List’ announced a dividend increase last week.
TFI International (TFII-N) on Thursday said it will be increasing its 2023 quarterly dividend from $0.27 to $0.35 per share, payable January 13, 2023, to shareholders of record on December 30, 2022.
This represents a dividend increase of +30%, marking the 12th straight year of dividend growth for this trucking and logistics company.
Earnings Releases
Last week, four companies on ‘The List’ reported their Q3 Fiscal 2022 earnings. Let’s begin with our favourite railroad.
Canadian National Railway (CNR-T)
“Our back to basics approach continues to drive strong results. CN’s team of railroaders is doing a great job in delivering service to our customers and value for our shareholders. We remain focused on disciplined execution of our integrated operating plan to maximize the effectiveness and efficiency of our incredible three-coast network. We have a busy fourth quarter, with a strong start in the Canadian grain crop, and we are resourced for the months ahead. We are pleased to be raising our 2022 outlook to reflect our performance.”
– Tracy Robinson, President and Chief Executive Officer, CN
Highlights:
- Record revenues of C$4,513 million, an increase of C$922 million or 26%, mainly due to higher fuel surcharge revenue driven by higher fuel prices, freight rate increases and the positive translation impact of a weaker Canadian dollar.
- Record operating income of C$1,932 million, an increase of 44%, or an increase of 31% on an adjusted basis.
- Diluted EPS of C$2.13, a decrease of 10%, mainly due to a merger termination fee received in the third quarter of 2021.
- Diluted EPS increased by 40% on an adjusted basis, which represents a quarterly record.
- Operating ratio, defined as operating expenses as a percentage of revenues, of 57.2%, an improvement of 5.5-points, or an improvement of 1.8-points on an adjusted basis.
- Free cash flow for the first nine months of 2022 was C$2,924 million compared to C$2,034 million for the same period in 2021.
- Injury frequency rate decreased by 29% and the accident rate decreased by 19%.
- Car velocity improved by 5% and dwell improved by 9%.
- Fuel efficiency improved by 1% to 0.838 US gallons of locomotive fuel consumed per 1,000 gross ton miles (GTMs).
- Origin train performance averaged 87%, an improvement of 12% compared to 78% for the same period in 2021.
Outlook:
CN is now expecting to deliver approximately 25% of adjusted diluted EPS growth (compared to its April 26, 2022 target of 15-20%) and free cash flow of approximately C$4.2 billion in 2022 (compared to its April 26, 2022 target range of C$3.7 billion – C$4.0 billion). CN continues to target an operating ratio below 60% and a ROIC of approximately 15% in 2022.
See the full Earnings Release here
Canadian Utilities Limited (CU-T)
“I’m happy to say all of our businesses across the board have continued to perform well, contributing to the overall success of our consolidated business as we delivered another strong quarter of results.”
– Executive Vice President and Chief Financial Officer, Brian Shkrobot
Highlights:
- Invested $374 million in capital projects of which 78 per cent was invested in regulated utilities and 22 per cent mainly in Energy Infrastructure.
- Subsequent to quarter-end, on October 5, 2022, Canadian Utilities announced it has entered into a definitive agreement with Suncor Energy Inc. to acquire a portfolio of assets that includes a 252-MW suite of operational wind facilities and a more than 1,500-MW development pipeline of wind and solar projects in Alberta and Ontario for a purchase price of approximately $730 million, subject to closing adjustments. This investment drives meaningful progress towards our previously announced goal of owning, developing or managing more than 1,000-MW of renewable energy by 2030 and is expected to be earnings and cash flow accretive in the first year of operations. The transaction is expected to close in the first quarter of 2023 and is subject to regulatory approvals and closing conditions.
- Announced a $9 million AUD recoverable grant had been awarded from the New South Wales Government to help fund pre-investment activities in the development of the 325-MW Central West Pumped Storage Hydro project in Australia. A final investment decision on project construction is expected in 2023.
- In August 2022, the Government of the Northwest Territories announced it is providing Northland Utilities, a 50/50 joint-venture partnership between ATCO Ltd. and Denendeh Investments, with up to $300,000 to support the installation of two public electric vehicle (EV) fast-charger stations in Yellowknife. This collaboration is the first step in the planned EV charging corridor between Yellowknife and the Alberta border.
Outlook:
“Our core utility and long-term contracted assets provide the stability needed to pursue our energy transition strategy, and our recent renewable generation acquisition marks a meaningful step forward in this journey. This strategy remains critical to the success of our business long term, and to society more broadly, as the push to decarbonize the global energy system continues to gain momentum.”
– Executive Vice President and Chief Financial Officer, Brian Shkrobot
See the full Earnings Release here
TFI International (TFII-N)
“TFI International continued to perform throughout the quarter even as broader macro uncertainty spread, producing robust financial results including a 69% year-over-year increase in adjusted operating income despite non-recurring charges, and a 73% increase in free cash flow … Our ability to rapidly adjust capacity to match shifting demand is just one driver of the strong operating ratios reported today across our business segments.”
– Chief Executive Officer, Alain Bedard
Highlights:
- Third quarter operating income of $318.4 million increased 66% from $191.6 million the same quarter last year, benefitting from contributions from acquisitions made over the past year and strong execution across the organization including an asset-light approach and cost reductions, and gain on the sale of business to Heartland of $75.7 million, offset by a non-recurring charge of $11.4 million charge reflecting the settlement of a legal claim in California in the Company’s Logistics segment.
- Net income of $245.2 million increased 86% compared to $131.6 million in Q3 2021, including the aforementioned charges of $11.4 million in Q3 2022. Diluted earnings per share (diluted “EPS”) of $2.72 approximately doubled compared to $1.38 in Q3 2021.
- Adjusted net income , a non-IFRS measure, of $181.2 million increased 30% compared to $138.9 million in Q3 2021, including the aforementioned charges of $11.4 million Q3 2022.
- Adjusted diluted EPS , a non-IFRS measure, of $2.01 increased 38% compared to $1.46 in Q3 2021.
- Net cash from operating activities of $337.8 million increased 60% compared to $211.2 million in Q3 2021.
- Free cash flow , a non-IFRS measure, of $292.1 million increased 73% from $168.7 million in Q3 2021.
- The Company’s reportable segments performed as follows:
- Package and Courier operating income increased 42% to $33.9 million;
- Less-Than-Truckload operating income increased 5% to $100.5 million;
- Truckload operating income increased 73% to $96.6 million; and
- Logistics operating income decreased 13% to $29.0 million due to the aforementioned charge of $11.4 million.
- During the third quarter TFI International repurchased and cancelled 2,101,814 shares for $198.8 million.
- On September 15, 2022, the Board of Directors of TFI declared a quarterly dividend of $0.27 per share, compared to the $0.23 per share dividend declared in Q3 2021, a 17% increase.
- On October 27, 2022, the Board of Directors of TFI approved a $0.35 per share quarterly dividend, a 30% increase over the previous quarterly dividend of $0.27 per share, effective as of the next regular payment.
- The Company has applied to the Toronto Stock Exchange to renew the normal course issuer bid (“NCIB”). If the renewal is approved, the Company will be allowed to repurchase for cancellation up to 6,370,000 common shares.
- On September 1, 2022, the Company announced the completion of the sale of CFI’s Truckload, Temp Control and Mexican non-asset logistics business (herein referred to as “CFI” collectively) to Heartland Express, Inc. for $525 million, resulting in a gain on sale of business of $75.7 million. In addition to customary closing adjustments, Heartland Express paid TFI International an additional $24 million for TFI to retain pre-closing accident and workers’ compensation claims.
- During the quarter, TFI International acquired Transport St-Amour, HO-RO Trucking Company, St-Michel Logistique, and LLL Transport and subsequent to quarter end completed the acquisition of Quevrac Ltee.
Outlook:
“North American economic growth has continued to slow due to a variety of factors including rising interest rates, higher inflation including elevated energy prices, labor shortages, continued global supply chain challenges, higher commodity prices and slower growth in most international markets. TFI
International’s diversity across industrial and consumer end markets and across many modes of transportation, along with the Company’s disciplined approach to operations, helped generate solid results during the third quarter. Nonetheless, macro uncertainty persists and an increasing number of economists see the possibility of economic recession ahead.
TFI International’s business has proven resilient in the face of recent macro challenges and management remains vigilant in its monitoring for new potential risks, including elevated energy prices, supply chain disruption, driver availability along with higher wages, and additional COVID-19 variants and the potential economic disruption they could cause. Factors such as these may cause additional rounds of declining freight volumes and higher costs, adversely affect TFI’s operating companies and the markets they serve. Additional uncertainties include but are not limited to geopolitical risk such as the ongoing war in Ukraine, policy changes surrounding international trade, environmental mandates and changes to the tax code in any jurisdictions in which TFI International operates.
Barring a more significant economic downturn, management believes the Company is well positioned for continued solid operational and financial performance due to its strong financial foundation and cash flow generation that allow for strategic investment in the business, its lean cost structure, and a longstanding focus on profitability, efficiency, network density, customer service, optimizing pricing, driver retention, and capacity rationalization. TFI continues to have material synergy opportunities related to the 2021 acquisition of TForce Freight, and the Company also has meaningful opportunities to enhance performance within most of its other operations. In addition, TFI’s diverse industrial exposure through specialized TL and LTL should continue to benefit from a shift toward domestic manufacturing as a result of reduced imports due to global supply chain issues. TFI is also well positioned to benefit over the long term from the expansion of e-commerce, which provides both growth and margin expansion opportunities for its P&C and Logistics business segments.
TFI International’s favorable positioning should enable continued solid results over the remainder of this year and into 2023 assuming no significant degradation in economic conditions. Longer term, regardless of the operating environment, management’s goal is to build shareholder value through consistent adherence to its operating principles, including customer focus, an asset-light approach, and continual efforts to enhance efficiencies. In addition, TFI International values free cash flow generation and strong liquidity with a conservative balance sheet that features a high portion of attractive fixed-rate spreads and limited near-term debt maturities. This strong financial footing allows the Company to prudently invest in the business and pursue select, accretive acquisitions while returning excess capital to shareholders.”
See the full Earnings Release here
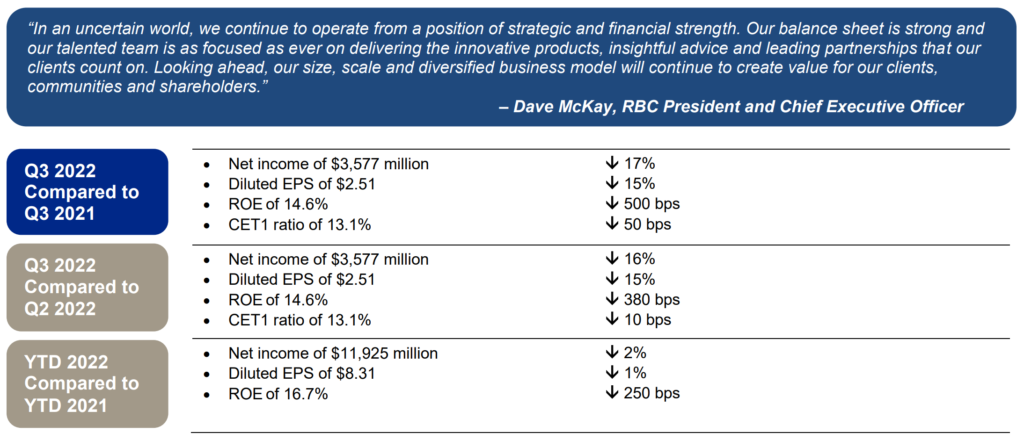
Fortis Inc. (FTS-T)
“During the third quarter, our utilities delivered earnings growth in line with our expectations, and continued to execute capital investments consistent with plan. Our low-risk organic growth strategy remains a key fundamental during these volatile macroeconomic times.”
– President and Chief Executive Officer, David Hutchens
Highlights:
- Third quarter net earnings of $326 million, or $0.68 per common share, up from $295 million, or $0.63 per common share in 2021
- Adjusted third quarter net earnings per common share of $0.71, up from $0.64 in 2021
- Invested capital expenditures2 of $2.9 billion through September; $4.0 billion annual capital plan on track
- Released 2023-2027 capital plan of $22.3 billion, representing 6.2% rate base growth; no discrete equity funding required
- Increased fourth quarter common share dividend by approximately 6%, marking 49 years of consecutive increases
- Announced annual dividend growth guidance of 4-6%; guidance period extended through 2027
Outlook:
“Fortis continues to enhance shareholder value through the execution of its capital plan, the balance and strength of its diversified portfolio of utility businesses, and growth opportunities within and proximate to its service territories. While energy price volatility, global supply chain constraints and rising inflation are issues of potential concern that continue to evolve, the Corporation does not currently expect there to be a material impact on its operations or financial results in 2022.
Fortis is executing on the transition to a cleaner energy future and is on track to achieve its corporate-wide target to reduce greenhouse gas (“GHG”) emissions by 75% by 2035. Upon achieving this target, 99% of the Corporation’s assets will support energy delivery and renewable, carbon-free generation. The Corporation’s additional 2050 net-zero direct GHG emissions target reinforces Fortis’ commitment to decarbonize over the long-term, while preserving customer reliability and affordability.
The Corporation’s $22.3 billion five-year capital plan is expected to increase midyear rate base from $34.0 billion in 2022 to $46.1 billion by 2027, translating into a five-year compound annual growth rate of 6.2%.
Beyond the five-year capital plan, additional opportunities to expand and extend growth include: further expansion of the electric transmission grid in the United States to facilitate the interconnection of cleaner energy including infrastructure investments associated with the Inflation Reduction Act of 2022 and the MISO LRTP; climate adaptation and grid resiliency investments; renewable gas solutions as well as liquefied natural gas infrastructure in British Columbia; and the acceleration of cleaner energy infrastructure investments across our jurisdictions.
Fortis expects its long-term growth in rate base will drive earnings that support dividend growth and reduce the Corporation’s dividend payout ratio over time to be in line with historical levels. The dividend growth guidance of 4-6% annually through 2027 will also provide the flexibility to fund more capital with internally generated funds and is premised on the assumptions listed under “Forward-Looking Information”.”
See the full Earnings Release here
Below is a snapshot of ‘The List’ from last Friday’s close. For a sortable version of ‘The List’, please click on The List menu item.
‘The List’ is not meant to be a template for investors to copy exactly. Instead, its purpose is to provide investment ideas and a real-time illustration of dividend growth investing in action. It is not a ‘Buy List’ nor does it reflect the composition or returns of our Magic Pants Wealth-Builder (CDN) Portfolio. It is only a starting point for our analysis and discussion.
The List (2022)
Last updated by BM on October 28, 2022
*Note: The following graph is wide, you can scroll to the right on your device to see more of the data.
| SYMBOL | COMPANY | YLD | PRICE | YTD % | DIV | YTD % | STREAK |
|---|---|---|---|---|---|---|---|
| AQN-N | Algonquin Power & Utilities | 6.4% | $11.00 | -23.3% | $0.70 | 5.4% | 11 |
| ATD-T | Alimentation Couche-Tard Inc. | 0.7% | $61.45 | 17.9% | $0.44 | 18.1% | 12 |
| BCE-T | Bell Canada | 5.9% | $61.88 | -6.1% | $3.64 | 4.0% | 13 |
| BIP-N | Brookfield Infrastructure Partners | 3.9% | $36.51 | -10.4% | $1.44 | 5.9% | 14 |
| CCL-B-T | CCL Industries | 1.5% | $66.13 | -2.4% | $0.96 | 14.3% | 20 |
| CNR-T | Canadian National Railway | 1.8% | $162.04 | 4.6% | $2.93 | 19.1% | 26 |
| CTC-A-T | Canadian Tire | 3.8% | $153.80 | -16.0% | $5.85 | 24.5% | 11 |
| CU-T | Canadian Utilities Limited | 4.9% | $36.03 | -1.6% | $1.78 | 1.0% | 50 |
| DOL-T | Dollarama Inc. | 0.3% | $82.33 | 29.8% | $0.22 | 9.2% | 11 |
| EMA-T | Emera | 5.2% | $51.51 | -17.7% | $2.68 | 4.1% | 15 |
| ENB-T | Enbridge Inc. | 6.5% | $53.13 | 7.2% | $3.44 | 3.0% | 26 |
| ENGH-T | Enghouse Systems Limited | 2.4% | $30.14 | -34.3% | $0.72 | 16.3% | 15 |
| FNV-N | Franco Nevada | 1.0% | $124.76 | -8.3% | $1.28 | 10.3% | 14 |
| FTS-T | Fortis | 4.1% | $52.97 | -12.4% | $2.17 | 4.3% | 48 |
| IFC-T | Intact Financial | 1.9% | $207.08 | 26.5% | $4.00 | 17.6% | 17 |
| L-T | Loblaws | 1.4% | $113.91 | 10.9% | $1.54 | 12.4% | 10 |
| MGA-N | Magna | 3.2% | $56.14 | -31.2% | $1.80 | 4.7% | 12 |
| MRU-T | Metro | 1.5% | $72.02 | 7.4% | $1.10 | 12.2% | 27 |
| RY-T | Royal Bank of Canada | 3.9% | $125.57 | -8.2% | $4.96 | 14.8% | 11 |
| SJ-T | Stella-Jones Inc. | 1.9% | $42.00 | 3.2% | $0.80 | 11.1% | 17 |
| STN-T | Stantec Inc. | 1.0% | $67.94 | -3.2% | $0.71 | 6.8% | 10 |
| TD-T | TD Bank | 4.1% | $87.71 | -11.7% | $3.56 | 12.7% | 11 |
| TFII-N | TFI International | 1.2% | $88.81 | -19.8% | $1.08 | 12.5% | 11 |
| TIH-T | Toromont Industries | 1.5% | $103.59 | -8.9% | $1.52 | 15.2% | 32 |
| TRP-T | TC Energy Corp. | 6.0% | $59.52 | -0.4% | $3.57 | 4.4% | 21 |
| T-T | Telus | 4.6% | $28.78 | -3.3% | $1.33 | 6.2% | 18 |
| WCN-N | Waste Connections | 0.7% | $132.83 | -0.9% | $0.92 | 8.9% | 12 |
| Averages | 3.0% | -4.2% | 10.3% | 18 |