MP Market Review – January 30, 2026
Last updated by BM on February 3, 2026
Summary
This is not a stock-picking newsletter.
It’s a behind-the-scenes look at how a dividend growth portfolio is built, maintained, and improved over time.
Welcome to this week’s MP Market Review. Each week, we track the Canadian dividend growth companies on The List, our curated watchlist of businesses designed to produce rising income. While we also publish a U.S. edition monthly, Canada remains our training ground.
Our objective is simple: grow dividend income by 7–10%+ annually while delivering capital appreciation that matches or exceeds the TSX Composite in Canada and the S&P 500 for our U.S. investors over a full market cycle.
What you’re about to read isn’t theory. It’s the real-time application of a dividend growth strategy using real money, with a clear objective: growing income first and letting capital growth follow.
Markets generate a lot of noise. We ignore most of it.
Instead, we track a small set of metrics that tell us whether our dividend growth strategy is working in real time. No forecasts. No opinions. Just results.
Here they are:
- Dividend income from The List: +2.9% year-to-date
- Capital value: -1.6% year-to-date
- Dividend announcements last week: Four
- Earnings reports last week: Three
- Earnings reports this week: One
DGI Clipboard
“After a decade or so, with dividend growth, you could end up beating the market with just dividend returns.”
– Building Wealth with Dividend Stocks, Joseph Tigue, p. 66
The Quiet Way Dividends Turn Stocks into “Bondified” Cash Machines

Intro
“The hardest truth about investing:
You won’t feel rich when your portfolio hits six figures.
You’ll still check prices.
You’ll still worry about corrections.
You’ll still wonder if you’re doing it right.
But one morning, dividends will cover your grocery bill. Then your car payment. Then your mortgage.
That’s when everything changes.
You start to understand that you should have started income investing sooner.
Not because you feel wealthy. Because you feel free.”
Great quote from a fellow Substack author, Investing Lawyer.
Another volatile week in the markets. Aren’t you glad we don’t care what the market is doing in the short run? We focus on what actually matters: dividend growth.
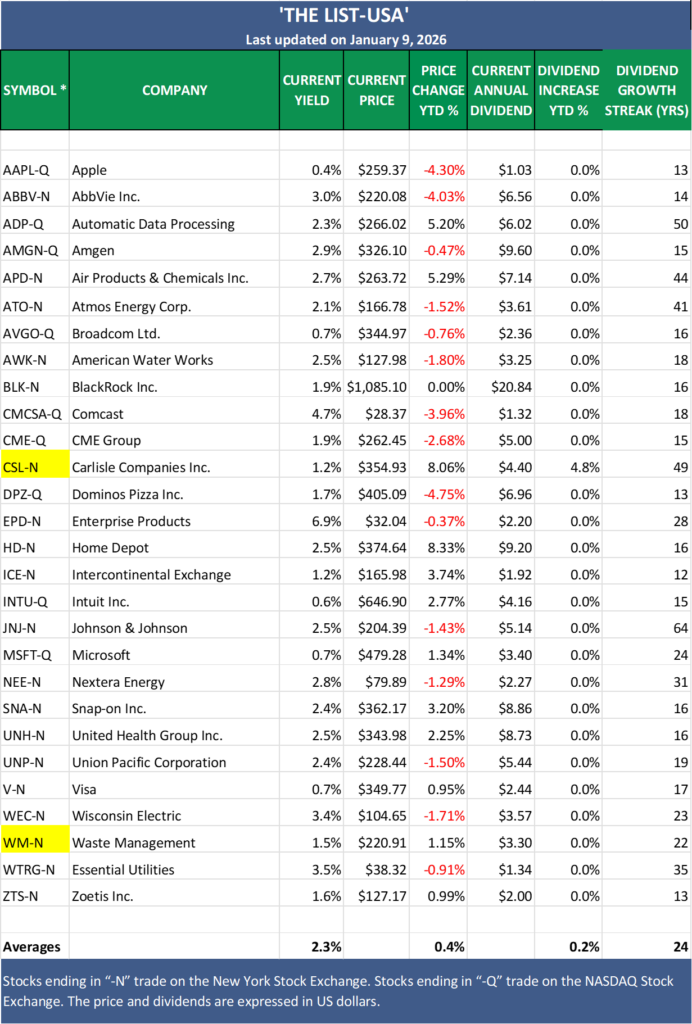
Last week brought another round of dividend increases from the quality businesses we own and track on both sides of the border. Below are the latest updates to our Canadian watchlist (weekly) and U.S. watchlist (monthly). Prices may be going nowhere in early 2026, but dividends are doing exactly what matters: growing with every earnings report. Income leads. Price follows. Always has.
Our Canadian list has already delivered 2.9% dividend growth for 2026, while the U.S. list is off to an even stronger start at 5.0%. There’s still plenty of earnings season ahead, but this is the quiet advantage of dividend growth investing. Annual income growth of 7–10% isn’t a forecast. It’s a repeatable outcome. Most companies announce increases in the first quarter, with a few following later in the year. Some even raise dividends more than once.
When markets get volatile, many advisors respond by shifting clients into fixed income to “smooth the ride.” We take a different view. Over time, the dividend return from high-quality dividend growers alone can outperform fixed income. The only requirement is patience and a willingness to let compounding do the heavy lifting.
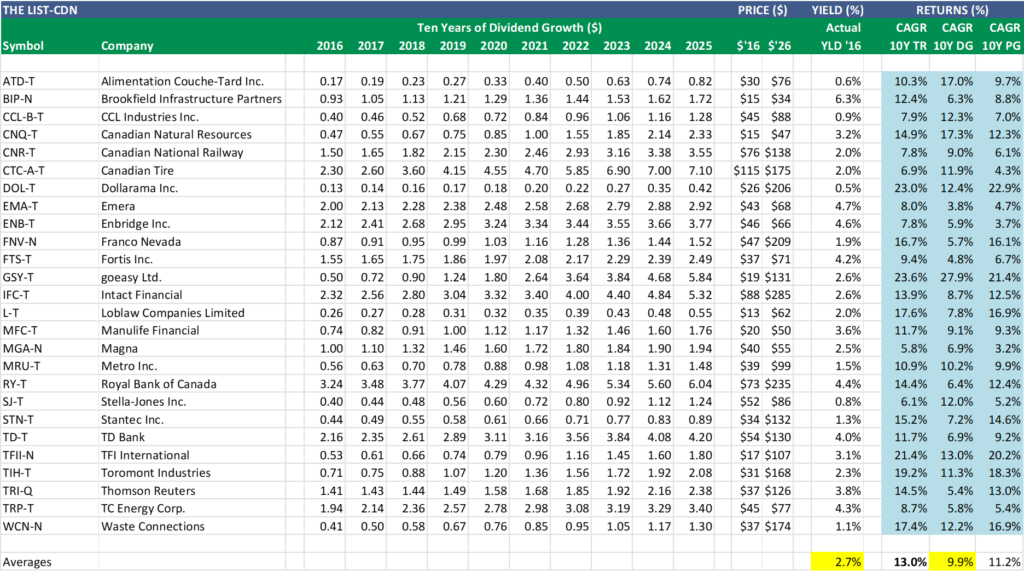
Below is a report from The List, showing a decade of dividend growth and the dividend return each company is now delivering, what we call growth yield. We don’t use growth yield as a valuation tool. We use it to prove that growth has already happened and to assess how likely it is to continue. A 7.1% dividend return after ten years, without the volatility, would satisfy most fixed-income investors.

This dividend return is what one of my mentors, Tom Connolly, calls “bondified.” After a decade or so, high-quality dividend growth stocks begin to behave like fixed income, delivering stable, rising cash flow with an expanding margin of safety from the original purchase price. The difference is that traditional bonds lock in yesterday’s income, while dividend growth stocks raise it. And while the income compounds quietly in the background, price tends to move higher as well. Ten years in, the investment isn’t just larger, it’s safer as retirement progresses.
As an added bonus, if recent trends persist, the five-year dividend growth rate gives us a reliable way to estimate future dividend returns.

Based on current yields and historical growth rates, this equal-weighted watchlist is on track to deliver an estimated 8.6% annual dividend return over the next decade, before any help from price appreciation.
For context, last week’s newsletter showed that The List generated an average annualized total return of 13.0% over the same period. Income did most of the work. Price simply followed.
Takeaway
If price volatility rattles you, remember this. With dividend growth investing, your income only goes one way. Up.
Become a paid partner, and I’ll show you exactly how I do it. With real money. In real stocks. In addition, gain full access to this post and exclusive, subscriber-only content. We do the work; you stay in control. Subscribe today and take your dividend growth investing to the next level!
DGI Scorecard
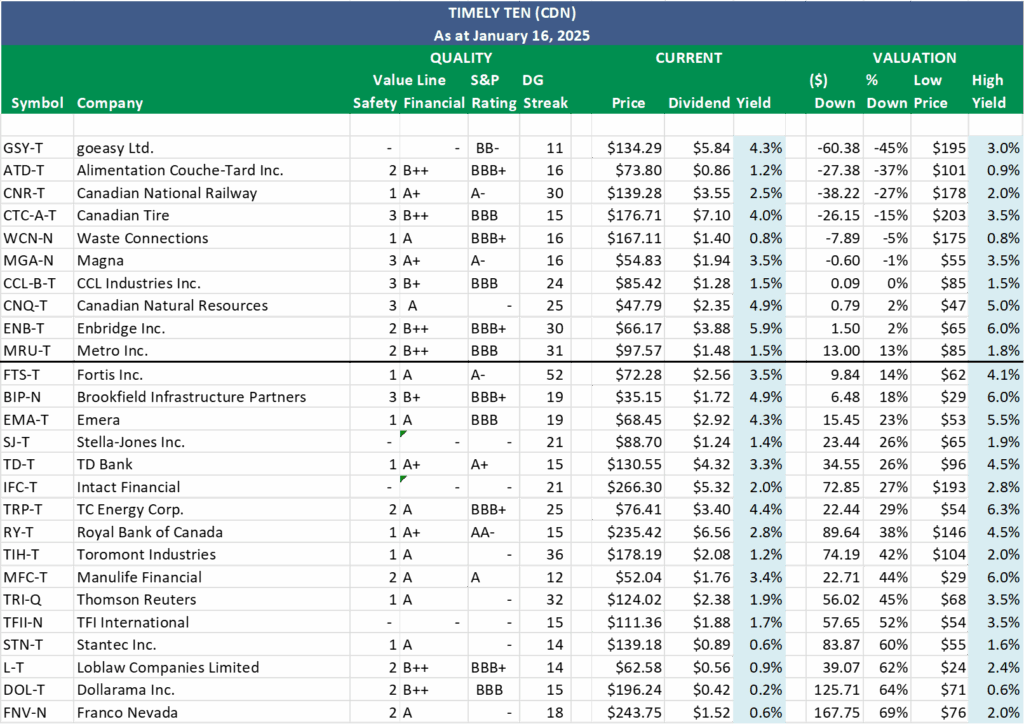
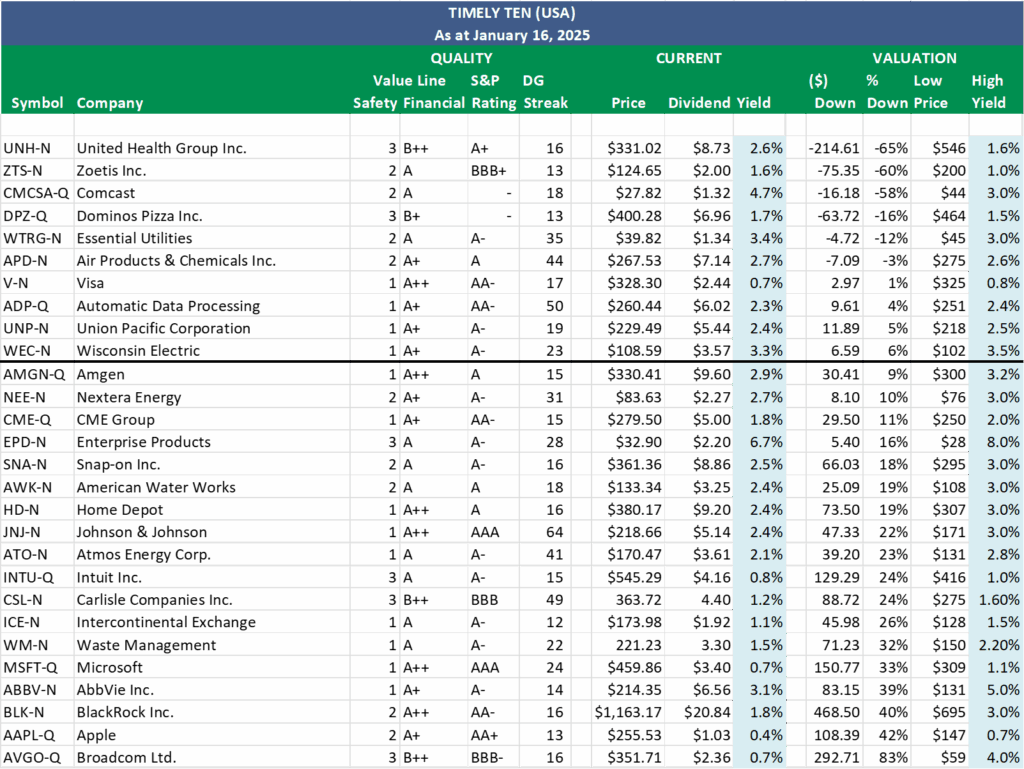
The Magic Pants 2026 list (The List) includes 26 Canadian dividend growth stocks and our new American watchlist (The List-USA) contains 28 companies. Here are the criteria to be considered a candidate on our watchlists:
- Dividend growth streak: 10 years or more.
- Market cap: Minimum one billion dollars.
- Diversification: Limit of five companies per sector, preferably two per industry.
- Cyclicality: Exclude REITs and pure-play energy companies due to high cyclicality.
Based on these criteria, companies are added or removed from ‘The List’ annually on January 1. Prices and dividends are updated weekly.
‘The List’ is not a portfolio but a coaching tool that helps us think about ideas and risk manage our model portfolio. We own some but not all the companies on ‘The List’. In other words, we might want to buy these companies when valuation looks attractive.
Our newsletter provides readers with a comprehensive insight into the implementation and advantages of our Canadian dividend growth investing strategy. This evidence-based, unbiased approach empowers DIY investors to outperform both actively managed dividend funds and passively managed indexes and dividend ETFs over longer-term horizons.
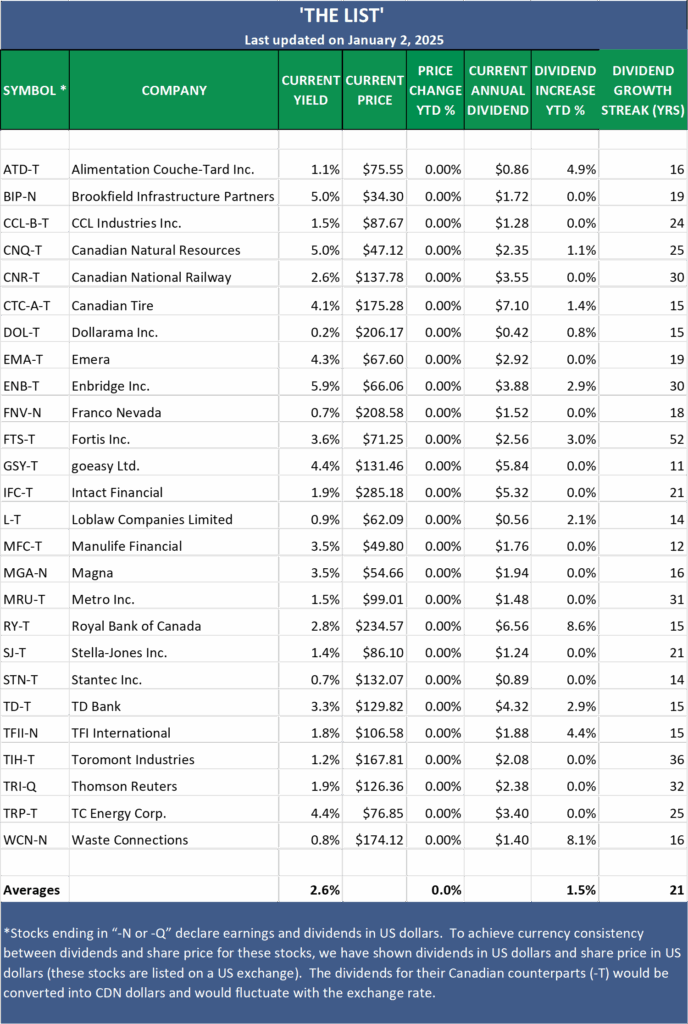
Performance of ‘The List’
Dividend growth of The List is starting to climb with an average increase YTD of +2.9% (income). These are dividends announced late last year and early in 2026.
The price of The List went down last week and now stands at -1.6% YTD (capital).
Top Performers Last Week:
- TC Energy Corp. (TRP-T), up +3.54%.
- Stella-Jones Inc. (SJ-T), up +3.01%.
- Brookfield Infrastructure Partners (BIP-N), up +2.55%.
Worst Performer Last Week:
- Thomson Reuters (TRI-Q), down -10.35%.

Note: Stocks ending in “-N or -Q” declare earnings and dividends in US dollars. To achieve currency consistency between dividends and share price for these stocks, we have shown dividends in US dollars and share price in US dollars (these stocks are listed on a US exchange). The dividends for their Canadian counterparts (-T) would be converted into CDN dollars and would fluctuate with the exchange rate.

PAID subscribers enjoy full access to our enhanced weekly newsletter, premium content, and easy-to-follow trade alerts so they can build DGI portfolios alongside ours. This service provides the resources to develop your DGI business plan confidently. We do the work; you stay in control!
It truly is the subscription that pays dividends!
The greatest investment you can make is in yourself. Are you ready to take that step?
For more articles and the full newsletter, check us out on magicpants.substack.com.