Posted by BM on April 30, 2021
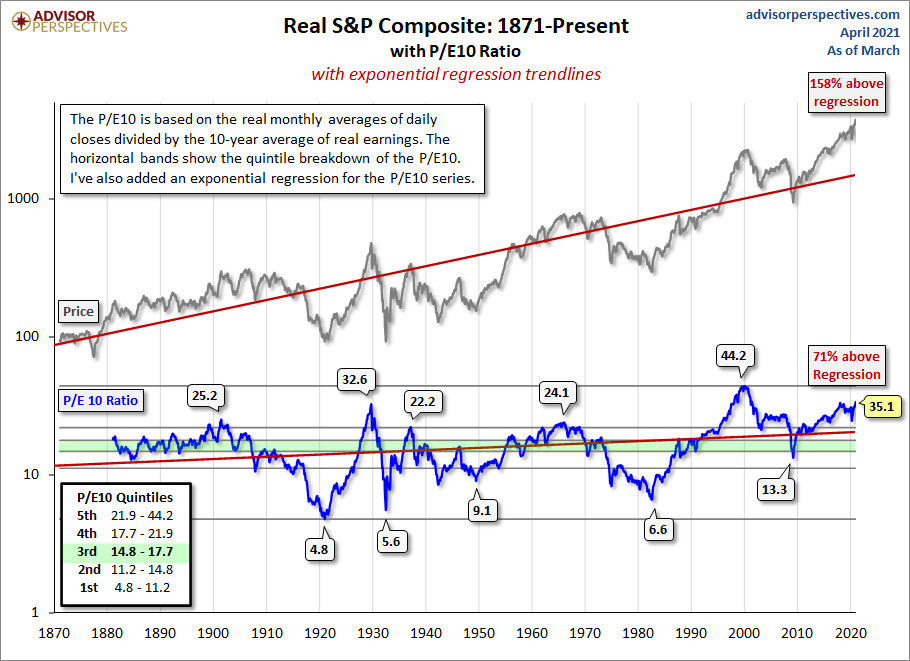
CAPE is the current price of a stock divided by the average of the last ten years of earnings. We think it is a truer P/E as it smooths out profits…the effects of economic cycles. Ben Graham liked a longer-term trailing P/E as well. Like all our value indicators we are looking for expensiveness. Lower CAPE is better.
“The P/E 10 ratio is a valuation measure generally applied to broad equity indices that use real per-share earnings over 10 years. The P/E 10 ratio also uses smoothed real earnings to eliminate the fluctuations in net income caused by variations in profit margins over a typical business cycle.
Conventional short-term Price to Earnings (P/E) ratios can sometimes be useless as a value indicator in periods of extreme market volatility. This happens when earnings fall faster than price.
Legendary economist and value investor Benjamin Graham noticed the same bizarre P/E behavior during the Roaring Twenties and subsequent market crash. Graham collaborated with David Dodd to devise a more accurate way to calculate the market’s value, which they discussed in their 1934 classic book, Security Analysis. They attributed the illogical P/E ratios to temporary and sometimes extreme fluctuations in the business cycle. Their solution was to divide the price by a multi-year average of earnings and suggested 5, 7 or 10-years. Yale professor and Nobel laureate Robert Shiller, the author of Irrational Exuberance, has popularized the concept to a wider audience of investors and has selected the 10-year average of “real” (inflation-adjusted) earnings as the denominator. Shiller refers to this ratio as the Cyclically Adjusted Price Earnings Ratio, abbreviated as CAPE, or the more precise P/E10, which is our preferred abbreviation.

Having metrics (CAPE) and graphical representations such as above helps us as investors quickly grasp the expensiveness of markets in general or businesses within the market.
One of the great quotes I hear all the time is from one of my mentors, Chuck Carnevale, who often precedes many of his ‘valuation’ videos with the phrase “It’s a market of stocks not a stock market.”
We can review the CAPE of ‘The List’ (our ‘market of stocks’) and see if we can find any ideas. CAPE-The List-04-23-2021
There is always value to be found in the market by seeking out and analyzing individual stocks. It is however prudent to remember that when the market’s CAPE is extremely high, those opportunities may not be as plentiful and an investor should be more cautious.
In my next post on valuation, I will use the FASTgraphs tool (developed by Chuck Carnevale) to quickly analyze our dividend growth stocks. All of our ‘value indicators’ (Yield Difference, Graham Number and CAPE) are ‘graphically displayed’ to give us a quick understanding of the businesses fundamentals and valuation.

