Posted by BM on May 10, 2021
I have written three articles on value indicators over the past month, and each have their merits when it comes to screening for fairly valued dividend growth stocks. I will now use a tool that combines all of these indicators into one graphical representation of valuation. That tool is the Fundamental Analysis Software Tool (FASTgraphs).
One of my mentors, Chuck Carnevale, is the inventor of this tool and I highly recommend a subscription to any serious investor. In this article, I will use FASTgraphs to quickly screen for fairly valued stocks on ‘The List’ so that we can take a deeper look into fundamentals.
We use earnings yield as our initial screen. Earnings yield is the annual earnings of a stock, individual company, or market index compared to the price. Earnings Yield = Annual Earnings Per Share / Stock Price. Another way to think of it is that for every dollar you invest in a stock you would expect to get a return equal to the earnings yield. Earnings yield is good for evaluating potential returns across companies with similar characteristics (dividend growth companies) and other forms of investments. For example, a bond paying 6% would be similar to a stock with an earnings yield of 6% at the time of purchase.
Our screen at the time of writing this article brings up seven companies with an earnings yield of at least 6.5% which we will set as the minimum return we are looking for.

Source: FASTgraphs
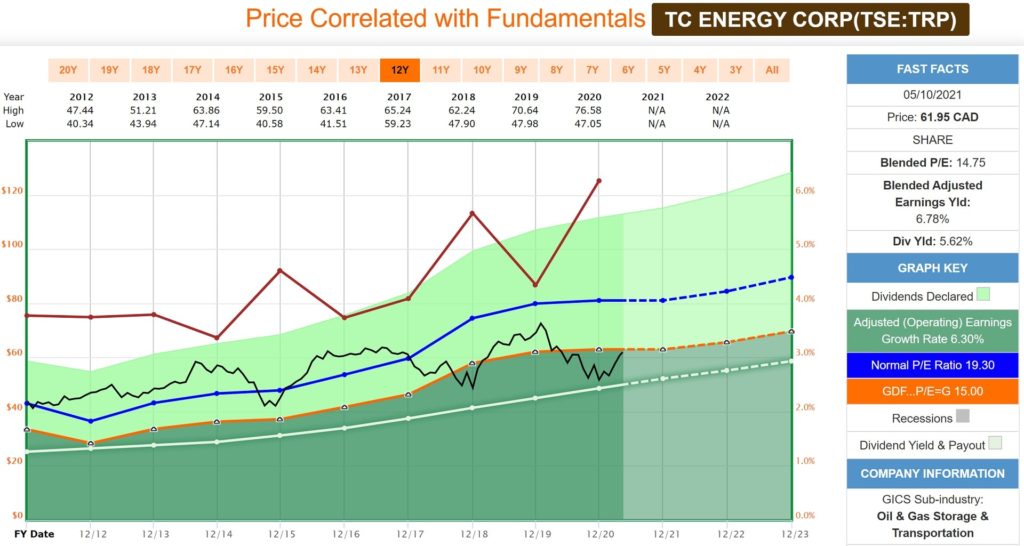
For the purposes of this article I am going to review TC Energy (TRP). The same valuation process could be used on any stock in our list.

Source: FASTgraphs
When we look at a FASTgraph for one of our stocks we can select what we want to see. Here I have selected five fundamentals. Dividend Payout Ratio (White Line), Graham Valuation P/E of 15 (Orange Line), Normal P/E (Blue Line), Price (Black Line) and Dividend Yield (Red Line). I have also selected a ten-year time period with two years of future estimates to help give us a more complete picture of how this company performs over a longer time horizon.
So what do we see that will help us with understanding this stocks historical valuation and whether it is fairly valued now?
The first thing we notice is that the earnings have been growing over the last decade. We can see this from the upward sloping Orange and Blue lines. The Dividend Payout Ratio (White Line) has also been increasing at a similar rate to earnings growth. This is important as you do not want a company paying dividends from money they don’t have.
We also see that the Black Line (Price) can fluctuate quite a bit. Buying this stock when it is above its Normal P/E (Blue Line) will not get you the same return as if you bought below the Orange Line. As dividend growth investors we know that dividends alone can provide us with good returns be we are always looking to maximize our Price growth as well. Buying at fair value is the best way to do this.
Finally, we will look at the historical Dividend Yield (Red Line). As can be expected, when the price of the stock falls, it’s dividend yield will rise. Buying when yields are above their historical averages means you are purchasing more income for less money (Dividend Yield Theory). TRP’s dividend yield is currently near its highest level in the last decade.
Our initial FASTgraphs review highlights TC Energy as a good candidate to analyze further as it trades below its historical 10-year average P/E (Blue Line) and has a dividend yield that is above its historical average (Red Line). The stock also appears to be close to its Graham Price as shown by its proximity to the Orange Line.
In subsequent articles we will delve even deeper into fundamentals using our FASTgraphs tool before we will decide to enter or add to our TC Energy position.

