Posted by BM on June 14, 2021
We spend a lot of time reviewing historical returns and metrics as dividend growth investors. This is important as it gives you a better idea of the nature of the company you are investing in (cyclical or not) and when historically has been a good time to purchase the stock. Trying to estimate the future however tends to more difficult.
In previous posts we looked at the FASTgraphs ‘Estimating’ tab for a comprehensive approach to predicting the future growth of our stocks. If you are looking for something quicker or confirmation on what you learned from your FASTgraphs analysis, here are a couple of other options.
A lot of dividend growth investors use the simple Yield + Growth formula to quickly arrive at a decision on whether to enter a position. If starting yield is 4% and growth is 6% then you can reasonably expect to make a 10% return on your investment. Where this formula fails, at least in the short run, is when the current valuation is abnormally high. A stock, with the above metrics, that trades at a current valuation of a 20 P/E when it’s average is 15 is more likely than not to generate a lower annual return over the next few years simply because it’s current valuation is too high. The market will eventually price the stock closer to its average P/E and your short-term returns will suffer.
John Bogle, the founder of the Vanguard Group, has a better methodology for estimating future returns. What I like about Bogle’s formula is that it back tests well and seems to align with the dividend growth stocks we invest in.
Jack Bogle’s expected return formula:
Future Market Returns = Dividend Yield + Earnings Growth +/- Change in P/E Ratio
Bogle calls the first two components, Yield + Growth, investment aspects of the investment return and the last component, +/- Change in P/E Ratio, the speculative return – what will people pay for a dollar’s worth of earnings.
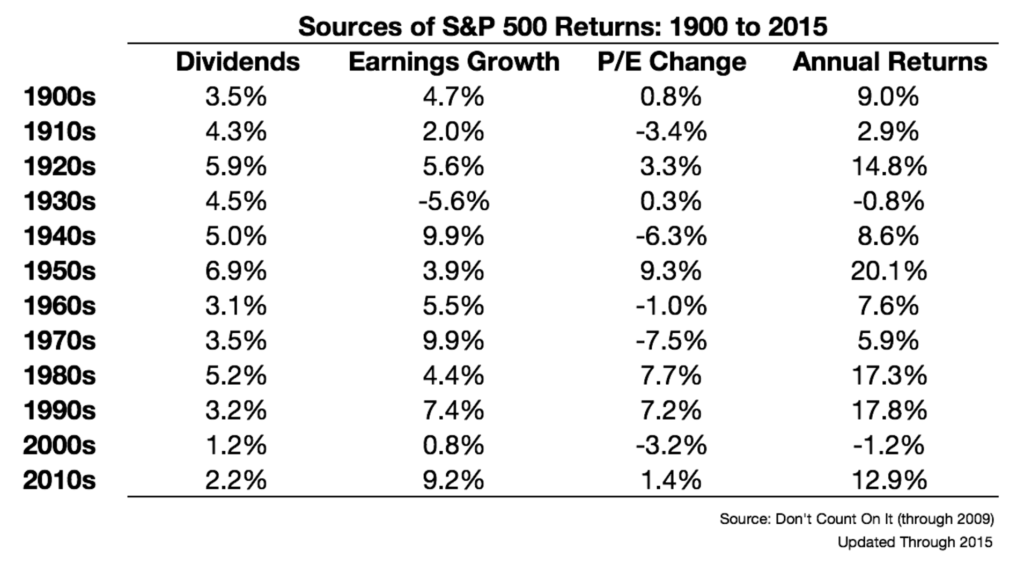
In his book ‘Don’t Count On It’ Bogle provides a long-term look at how this formula has played out by decade going all the way back to 1900.

This data is quite interesting because it gets to the core of what we do as dividend growth investors. Yield and Growth are stalwarts in our dividend growth philosophy and have done well over the years. The data then suggests that if we hold long enough or buy when P/E’s are more reasonable we can avoid most of the sub-par annual returns in Bogle’s chart.
Tom Connolly calls the speculative return component (P/E Change) the ‘Excitement Factor’. A high P/E means people are excited about stocks and a lower P/E the opposite. The most important takeaway in Bogle’s chart is just how much the ‘Excitement Factor’ affects annual returns. Paying attention to this key component can make the difference between average and above average returns going forward, especially in the short term.

