MP Market Review – April 3, 2026
Last updated by BM on April 7, 2026
Summary
This is not a stock-picking newsletter.
It’s a behind-the-scenes look at how a dividend growth portfolio is built, maintained, and improved over time.
Welcome to this week’s MP Market Review. Each week, we track the Canadian dividend growth companies on The List, our curated watchlist of businesses designed to produce rising income. While we also publish a U.S. edition monthly, Canada remains our training ground.
Our objective is simple: grow dividend income by 7–10%+ annually while delivering capital appreciation that matches or exceeds the TSX Composite in Canada and the S&P 500 for our U.S. investors over a full market cycle.
What you’re about to read isn’t theory. It’s the real-time application of a dividend growth strategy using real money, with a clear objective: growing income first and letting capital growth follow.
Markets generate a lot of noise. We ignore most of it.
Instead, we track a small set of metrics that tell us whether our dividend growth strategy is working in real time. No forecasts. No opinions. Just results.
Here they are:
- Dividend income from The List: +6.4% year-to-date
- Capital value: +0.7% year-to-date
- Dividend announcements last week: One
- Earnings reports last week: One
- Earnings reports this week: None
DGI Clipboard
“A true investor buys for the dividend return and understands that yield growth will drive total return.”
– Tom Connolly
“Our increasing income comes from our companies directly, not the market.”
-Tom Connolly
“Dividend growth is the hidden magic in plain sight. We hold because after ten years, our yield is at least 5%, on average 7% and often about 10%.”
– Tom Connolly
“Why would you hold fixed income on purpose when you can have a growing income in retirement? Perhaps because you believed your wealth manager’s guff.”
-Tom Connolly

Dividend Return: The Investment Return You Can Actually Control
My mentor, Tom Connolly didn’t hold back on how he felt about dividend return (growth yield). I included some of his best quotes above.
It is hard to stay focused and patient as a DIY investor. Markets move. Headlines scream. Prices fall. And in those moments, all the talk about temperament, discipline, and process gets tested.
Most investors think they understand these ideas. Very few actually live them.
At Magic Pants, we approach investing differently. We are not chasing price. We are building income. And more specifically, we are building dividend return.
That distinction matters.
Dividend return is the portion of your total return that comes from cash paid to you by the business. It is real. It is measurable. And most importantly, it grows over time when you own the right companies.
Capital return, on the other hand, is unpredictable in the short term. It depends on sentiment, multiples, and narratives. You cannot control it.
But dividend return? That is where you focus.
Here is what that looks like in practice.
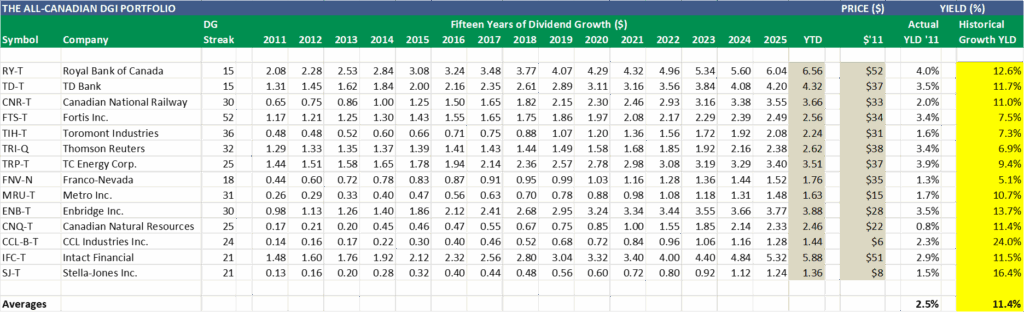
In 2011, an equal-weighted basket of high-quality Canadian dividend growers, what we now call the All-Canadian DGI Portfolio, yielded about 2.5%.
Today, that same basket yields 11.4% on original cost (YTD dividend/$11 price).
Let’s translate that into something tangible.
A $1,000,000 investment back then would now be generating $114,000 in annual income today. And that income is not static. It continues to grow year after year.
That is the difference between chasing yield and building it.
Nothing fancy happened. No trading. No forecasting. No guessing.
Just ownership of quality businesses that continued to grow earnings and raise dividends year after year.
That is the quiet superpower of dividend growth investing.
While the market debates interest rates and economic cycles, your income keeps climbing. Slowly at first. Then all at once.
And here is where most investors miss the point.
They anchor to today’s yield instead of focusing on tomorrow’s income.
They look at a 2–3% yield and think it is not enough.
What they fail to see is what that yield becomes after a few years of consistent growth.
This is why we say:
Dividends lead. Prices follow.
As earnings grow, dividends grow. As dividends grow, the market eventually reprices the business higher. The capital return shows up later.
But the income? That shows up every quarter.
So when markets get volatile, remember what you actually own.
You do not own a ticker symbol.
You own a stream of growing cash flow.
Takeaway
Our job is simple.
Buy quality companies.
Pay sensible prices.
Build positions over time.
Reinvest the income.
Then step aside and let the income snowball do the heavy lifting.
That is dividend return.
And over time, it changes everything.
Looking for a helping hand in the market? Members of Magic Pants Dividend Growth Investing get exclusive ideas and guidance to navigate any climate.
The Magic Pants model portfolios (Canadian and American) are real-money dividend growth portfolios funded with actual capital and executed in live accounts. Every position shown is owned, sized, and tracked in real time using our disciplined DGI process.
Become a paid subscriber, and I’ll show you exactly how I do it. In addition, gain full access to this post and exclusive, subscriber-only content. We do the work; you stay in control.
DGI Scorecard
The Magic Pants 2026 list (The List) includes 26 Canadian dividend growth stocks and our new American watchlist (The List-USA) contains 28 companies. Here are the criteria to be considered a candidate on our watchlists:
- Dividend growth streak: 10 years or more.
- Market cap: Minimum one billion dollars.
- Diversification: Limit of five companies per sector, preferably two per industry.
- Cyclicality: Exclude REITs and pure-play energy companies due to high cyclicality.
Based on these criteria, companies are added or removed from ‘The List’ annually on January 1. Prices and dividends are updated weekly.
‘The List’ is not a portfolio but a coaching tool that helps us think about ideas and risk manage our model portfolio. We own some but not all the companies on ‘The List’. In other words, we might want to buy these companies when valuation looks attractive.
Our newsletter provides readers with a comprehensive insight into the implementation and advantages of our Canadian dividend growth investing strategy. This evidence-based, unbiased approach empowers DIY investors to outperform both actively managed dividend funds and passively managed indexes and dividend ETFs over longer-term horizons.
Performance of ‘The List’
The dividend growth of The List stayed the same last week, with an average YTD increase of 6.4% (income).
The price of The List was up last week and now stands at +0.7% YTD (capital).
Top Performers Last Week:
- Franco Nevada (FNV-N), up +10.17%.
- Waste Connections (WCN-N), up +6.43%.
- TFI International (TFII-N), up +6.35%.
Worst Performer Last Week:
- Canadian Natural Resources (CNQ-T), down -4.77%.
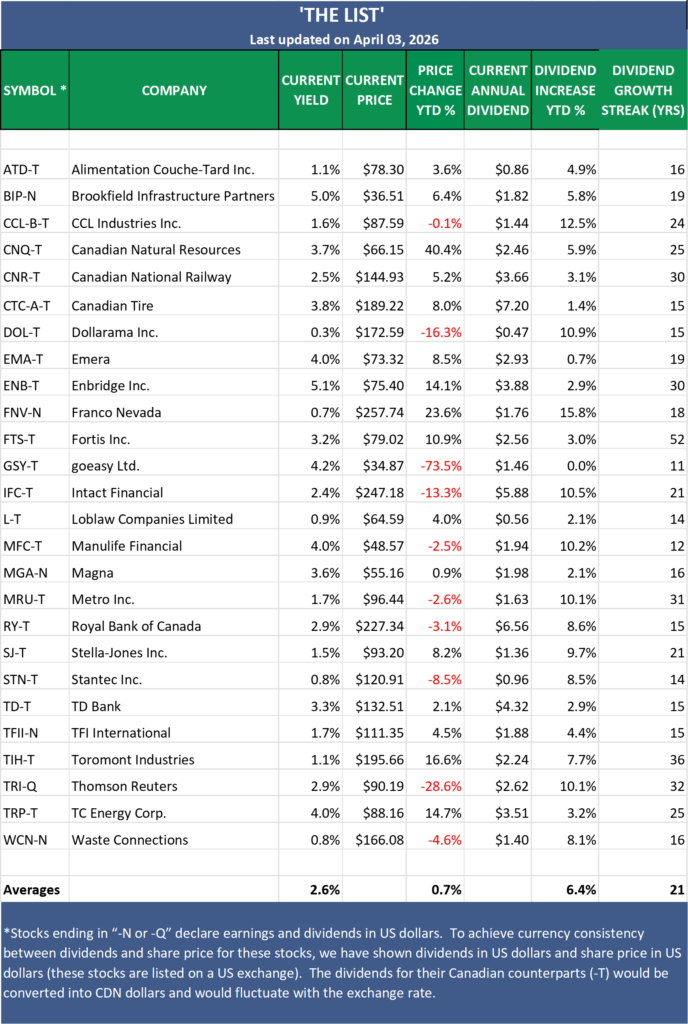
Note: Stocks ending in “-N or -Q” declare earnings and dividends in US dollars. To achieve currency consistency between dividends and share price for these stocks, we have shown dividends in US dollars and share price in US dollars (these stocks are listed on a US exchange). The dividends for their Canadian counterparts (-T) would be converted into CDN dollars and would fluctuate with the exchange rate.
PAID subscribers enjoy full access to our enhanced weekly newsletter, premium content, and easy-to-follow trade alerts so they can build DGI portfolios alongside ours. This service provides the resources to develop your DGI business plan confidently. We do the work; you stay in control!
It truly is the subscription that pays dividends!
The greatest investment you can make is in yourself. Are you ready to take that step?
For more articles and the full newsletter, check us out on magicpants.substack.com.
