MP Market Review – January 23, 2026
Last updated by BM on January 27, 2026
Summary
This is not a stock-picking newsletter.
It’s a behind-the-scenes look at how a dividend growth portfolio is built, maintained, and improved over time.
Welcome to this week’s MP Market Review. Each week, we track the Canadian dividend growth companies on The List, our curated watchlist of businesses designed to produce rising income. While we also publish a U.S. edition monthly, Canada remains our training ground.
Our objective is simple: grow dividend income by 7–10%+ annually while delivering capital appreciation that matches or exceeds the TSX Composite in Canada and the S&P 500 for our U.S. investors over a full market cycle.
What you’re about to read isn’t theory. It’s the real-time application of a dividend growth strategy using real money, with a clear objective: growing income first and letting capital growth follow.
Markets generate a lot of noise. We ignore most of it.
Instead, we track a small set of metrics that tell us whether our dividend growth strategy is working in real time. No forecasts. No opinions. Just results.
Here they are:
- Dividend income from The List: +1.5% year-to-date
- Capital value: +1.1% year-to-date
- Dividend announcements last week: None
- Earnings reports last week: None
- Earnings reports this week: Three
DGI Clipboard
“In the short run, speculative return, the change in the price investors are willing to pay for a dollar of earnings, drives the market. But in the long run, it reverts to the mean. Only investment return is sustainable.”
— John Bogle, speech at the CFA Institute, 2001
When Income Grows, Returns Follow. Here’s the Proof.

Intro
Every year, when I publish our new watchlists, I run the same simple exercise. I do it to show new investors just how predictable the long-term returns of quality dividend growth stocks can be when you look across a full market cycle.
John Bogle, the founder of Vanguard and a pioneer of index investing, gave investors a powerful way to understand long-term stock returns:
Total Return = Investment Return + Speculative Return
This formula separates what actually builds wealth from what merely creates short-term noise.
Investment Return is the part you can measure and rely on. It has two components:
- Dividend yield: the cash income paid to shareholders
- Earnings growth: how fast the company’s profits grow over time
If a company pays a 3% dividend and grows earnings at 6% per year, the investment return is about 9%. No forecasting. No market timing. Just business performance.
Speculative Return comes from changes in valuation. When investors are willing to pay more for a dollar of earnings, prices rise. When enthusiasm fades, prices fall, even if the business itself is doing well. Bogle warned investors not to depend on this part of the equation because it is unstable and often reverses over time.
This framework fits perfectly with dividend growth investing.
As dividend growth investors, we focus almost entirely on investment return. We look for high-quality businesses with growing earnings and a long history of raising dividends. We care far less about what the market might do next year and far more about what the company is producing today.
Dividend growth and earnings growth are closely linked. They often have similar growth rates. A company cannot raise its dividend for decades unless profits are also rising.
Here’s the exercise I run using our watchlist, The List. I take:
- The average dividend yield from ten years ago
- The actual annualized dividend growth over the past decade
Then I apply Bogle’s formula.
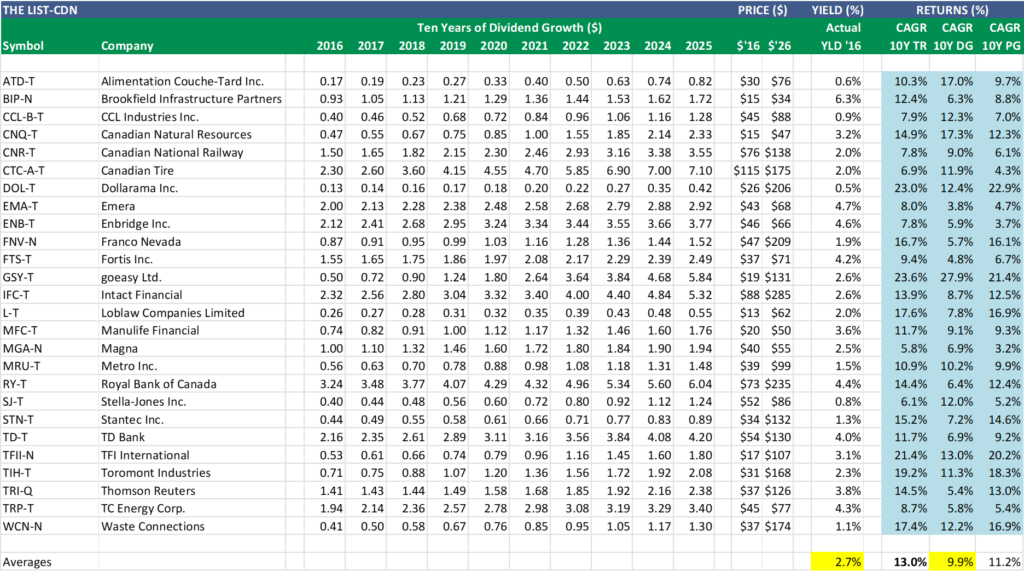
The result? Adding those two numbers together produces an investment return of 12.6%. That accounts for nearly all of the total return, suggesting that The List was, on average, sensibly priced back in 2016, with only about 0.4% coming from speculation over the next ten years. The actual annualized total return was 13.0%.
Here’s the good news: we can do even better by following our process. A 13% annualized return would satisfy most investors, but this result assumes equal weighting and a single lump-sum investment on January 1, 2016. That’s not how we operate. We wait for sensible prices, act only when valuation is on our side, and size positions according to business quality. Patience, valuation, and discipline are not constraints. They are our edge.
Takeaway
This is the quiet advantage of dividend growth investing. When income grows, returns stop being a mystery.
Now ask yourself how much of recent index returns are coming from business growth and how much are coming from speculation. If you want to go deeper, the Globe & Mail article linked in the DGI News section below adds valuable perspective.
Become a paid partner, and I’ll show you exactly how I do it. With real money. In real stocks. In addition, gain full access to this post and exclusive, subscriber-only content. We do the work; you stay in control. Subscribe today and take your dividend growth investing to the next level!
DGI Scorecard
The Magic Pants 2026 list (The List) includes 26 Canadian dividend growth stocks and our new American watchlist (The List-USA) contains 28 companies. Here are the criteria to be considered a candidate on our watchlists:
- Dividend growth streak: 10 years or more.
- Market cap: Minimum one billion dollars.
- Diversification: Limit of five companies per sector, preferably two per industry.
- Cyclicality: Exclude REITs and pure-play energy companies due to high cyclicality.
Based on these criteria, companies are added or removed from ‘The List’ annually on January 1. Prices and dividends are updated weekly.
‘The List’ is not a portfolio but a coaching tool that helps us think about ideas and risk manage our model portfolio. We own some but not all the companies on ‘The List’. In other words, we might want to buy these companies when valuation looks attractive.
Our newsletter provides readers with a comprehensive insight into the implementation and advantages of our Canadian dividend growth investing strategy. This evidence-based, unbiased approach empowers DIY investors to outperform both actively managed dividend funds and passively managed indexes and dividend ETFs over longer-term horizons.
Performance of ‘The List’
Dividend growth of The List starts the year with an average increase YTD of +1.5% (income). These are dividends already announced for 2026.
The price of The List stayed the same last week up +1.1% YTD (capital).
Top Performers Last Week:
- Franco Nevada (FNV-N), up +4.92%.
- Canadian Natural Resources (CNQ-T), up +4.16%.
- Alimentation Couche-Tard Inc. (ATD-T), up +3.52%.
Worst Performer Last Week:
- goeasy Ltd. (GSY-T), down -3.52%.
| SYMBOL | COMPANY | YLD | PRICE | YTD % | DIV | YTD % | STREAK |
|---|---|---|---|---|---|---|---|
| ATD-T | Alimentation Couche-Tard Inc. | 1.1% | $76.87 | 1.75% | $0.86 | 4.9% | 16 |
| BIP-N | Brookfield Infrastructure Partners | 4.9% | $35.25 | 2.77% | $1.72 | 0.0% | 19 |
| CCL-B-T | CCL Industries Inc. | 1.5% | $87.10 | -0.65% | $1.28 | 0.0% | 24 |
| CNQ-T | Canadian Natural Resources | 4.8% | $49.47 | 4.99% | $2.35 | 1.1% | 25 |
| CNR-T | Canadian National Railway | 2.6% | $136.78 | -0.73% | $3.55 | 0.0% | 30 |
| CTC-A-T | Canadian Tire | 4.0% | $175.92 | 0.37% | $7.10 | 1.4% | 15 |
| DOL-T | Dollarama Inc. | 0.2% | $192.22 | -6.77% | $0.42 | 0.8% | 15 |
| EMA-T | Emera | 4.3% | $68.29 | 1.02% | $2.92 | 0.0% | 19 |
| ENB-T | Enbridge Inc. | 5.9% | $66.05 | -0.02% | $3.88 | 2.9% | 30 |
| FNV-N | Franco Nevada | 0.6% | $255.75 | 22.61% | $1.52 | 0.0% | 18 |
| FTS-T | Fortis Inc. | 3.5% | $72.19 | 1.32% | $2.56 | 3.0% | 52 |
| GSY-T | goeasy Ltd. | 4.5% | $129.16 | -1.75% | $5.84 | 0.0% | 11 |
| IFC-T | Intact Financial | 2.0% | $259.79 | -8.90% | $5.32 | 0.0% | 21 |
| L-T | Loblaw Companies Limited | 0.9% | $62.96 | 1.40% | $0.56 | 2.1% | 14 |
| MFC-T | Manulife Financial | 3.5% | $50.65 | 1.71% | $1.76 | 0.0% | 12 |
| MGA-N | Magna | 3.6% | $53.23 | -2.62% | $1.94 | 0.0% | 16 |
| MRU-T | Metro Inc. | 1.5% | $99.38 | 0.37% | $1.48 | 0.0% | 31 |
| RY-T | Royal Bank of Canada | 2.8% | $232.71 | -0.79% | $6.56 | 8.6% | 15 |
| SJ-T | Stella-Jones Inc. | 1.4% | $88.63 | 2.94% | $1.24 | 0.0% | 21 |
| STN-T | Stantec Inc. | 0.6% | $137.56 | 4.16% | $0.89 | 0.0% | 14 |
| TD-T | TD Bank | 3.3% | $130.37 | 0.42% | $4.32 | 2.9% | 15 |
| TFII-N | TFI International | 1.7% | $109.26 | 2.51% | $1.88 | 4.4% | 15 |
| TIH-T | Toromont Industries | 1.2% | $179.29 | 6.84% | $2.08 | 0.0% | 36 |
| TRI-Q | Thomson Reuters | 1.9% | $123.40 | -2.34% | $2.38 | 0.0% | 32 |
| TRP-T | TC Energy Corp. | 4.4% | $77.11 | 0.34% | $3.40 | 0.0% | 25 |
| WCN-N | Waste Connections | 0.8% | $170.22 | -2.24% | $1.40 | 8.1% | 16 |
| Averages | 2.6% | 1.1% | 1.5% | 21 |
Note: Stocks ending in “-N or -Q” declare earnings and dividends in US dollars. To achieve currency consistency between dividends and share price for these stocks, we have shown dividends in US dollars and share price in US dollars (these stocks are listed on a US exchange). The dividends for their Canadian counterparts (-T) would be converted into CDN dollars and would fluctuate with the exchange rate.
PAID subscribers enjoy full access to our enhanced weekly newsletter, premium content, and easy-to-follow trade alerts so they can build DGI portfolios alongside ours. This service provides the resources to develop your DGI business plan confidently. We do the work; you stay in control!
It truly is the subscription that pays dividends!
The greatest investment you can make is in yourself. Are you ready to take that step?
For more articles and the full newsletter, check us out on magicpants.substack.com.
