Last updated by BM on October 1, 2024
Summary
This is a weekly installment of our MP Market Review series, which provides updates on the financial markets and Canadian dividend growth companies we monitor on ‘The List’.
- This week learn why dividend growth is the true hedge when it comes to owning inflation.
- Last week, dividend growth of ‘The List’ stayed the course and has increased by +8.8% YTD (income).
- Last week, the price of ‘The List’ was up with a return of +13.5% YTD (capital).
- Last week, there was one dividend announcement from a company on ‘The List’.
- Last week, there were no earnings reports from companies on ‘The List’.
- This week, no companies on ‘The List’ are due to report earnings.
DGI Clipboard
“Inflation may have become the oldest form of government finance. It may also have been the oldest form of political confidence game used by leaders to exact tribute from constituents, older even than taxes, and inflation has kept those honored places in human affairs to this day…For at least four thousand years of recorded history, man has known inflation.”
-Jens O. Parsson, Dying of Money
How to Own Inflation: Why Dividend Growth is the True Hedge
Many of us mistakenly attribute inflation to rising prices alone, often believing it’s driven by the greed of businesses. However, the true cause of inflation is the expansion of the money supply by the governement. As more money enters circulation and is spent repeatedly, consumer demand rises, pushing up the cost of goods—essentially, too much money chasing too few goods.
Federal governments, particularly those with significant debt, increase the money supply to bring on inflation which will reduce the real value of their debt and boost tax revenue. Given the current state of government balance sheets, it’s reasonable to expect higher inflation will become more common in the future.
So, why discuss inflation in the context of dividend growth investing? Because it can have a profound impact on your retirement planning.
The chart below illustrates how much more you’ll need in 10, 20, or 30 years to cover $75,000 in expenses today at various inflation rates.
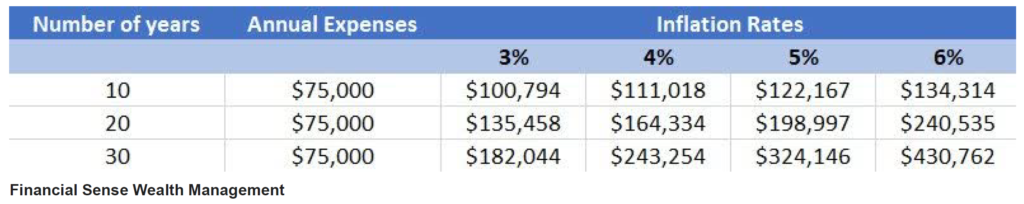
Even at 3% inflation, you will need 25% more capital in ten years to pay your expenses. How are you going to get there?
One of the biggest misconceptions in retirement planning is the idea that, as you age, you should shift away from equities and into more fixed-income investments like Bonds. This outdated strategy is often referred to as the “Age Rule.”
The “Age Rule” suggests you subtract your age from 100 to determine the percentage of your portfolio that should be in stocks. For example, at age 65, it recommends 35% in stocks and 65% in bonds and cash. By age 80, your stock allocation would drop to just 20%.
Now, let’s examine what happens to a $100,000 Bond over 10, 20, or 30 years, as inflation steadily erodes its purchasing power.
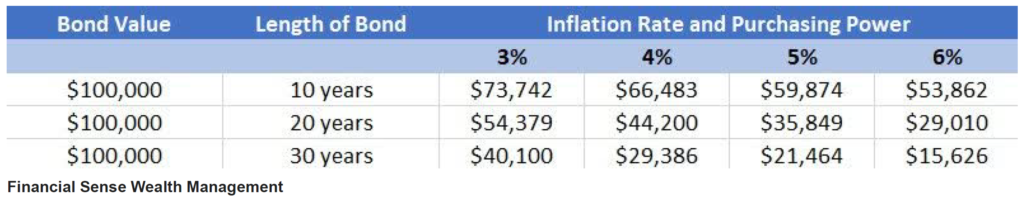
Do you see the problem here? Your purchasing power on the initial $100,000 investment in Bonds is being eroded over time. In ten years, when you get your initial $100,000 back, your Bond is worth only $73,742 in inflation adjusted dollars. It gets even worse if inflation ticks higher.
With your expenses going up due to inflation and the purchasing power of your capital going down what is a retiree to do?
You need to “own inflation.”
In investing, “owning inflation” means holding assets that either benefit from rising inflation or shield you from its impact. Since inflation steadily erodes the purchasing power of money, it’s crucial to invest in assets that appreciate in value or generate increasing income as inflation rises. This helps preserve and grow your wealth over time.
Two ways dividend growth investors “own inflation” are:
- Own stocks of companies with pricing power: Companies that can pass on rising costs to consumers through price increases (like consumer staples or utilities) tend to perform well during inflationary periods.
- Own companies with a history of growing dividends. As the companies increase their dividends over time, the income keeps up with or exceeds inflation.
Let’s look at one of our quality dividend growers bought ten years ago for contrast to our Bond example above. We will use ten-year data from Fortis Inc. (a utility) as an example.


Investing that same $100,000 in Fortis Inc. shares, not only provides you with rising income from dividends to pay your expenses and combat inflation, but the value of your investment appreciates. For instance, Fortis Inc.’s share price grew from $30 to over $60, your capital more than doubles to over $200,000. Fortis Inc. has been providing a growing dividend for over 50 years so you can back test the previous forty years to see the same scenario play out decade after decade.
By building a portfolio of dividend growth stocks like Fortis Inc., you harness the benefits of price appreciation and rising dividends, preserving and increasing your purchasing power over time. That is how you own inflation and secure your retirement.
In my view, a dividend growth strategy is one of the best inflation hedges available, helping you not only keep pace with inflation but also build substantial wealth.
DGI Scorecard
The List (2024)
The Magic Pants 2024 list includes 28 Canadian dividend growth stocks. Here are the criteria to be considered a candidate on ‘The List’:
- Dividend growth streak: 10 years or more.
- Market cap: Minimum one billion dollars.
- Diversification: Limit of five companies per sector, preferably two per industry.
- Cyclicality: Exclude REITs and pure-play energy companies due to high cyclicality.
Based on these criteria, companies are added or removed from ‘The List’ annually on January 1. Prices and dividends are updated weekly.
‘The List’ is not a portfolio; it is a coaching tool that helps us think about ideas and risk manage our model portfolio. We own some but not all the companies on ‘The List’.
Our newsletter provides readers with a comprehensive insight into the implementation and advantages of our Canadian dividend growth investing strategy. This evidence-based, unbiased approach empowers DIY investors to outperform both actively managed dividend funds and passively managed indexes and dividend ETFs over longer-term horizons.
For those interested in something more, please upgrade to a paid subscriber; you get the enhanced weekly newsletter, access to premium content, full privileges on the new Substack website magicpants.substack.com and DGI alerts whenever we make stock transactions in our model portfolio.
Performance of ‘The List’
Last week, dividend growth of ‘The List’ stayed the course and has now increased by +8.8% YTD (income).
Last week, the price return of ‘The List’ was up with a return of +13.5% YTD (capital).
Even though prices may fluctuate, the dependable growth in our income does not. Stay the course. You will be happy you did.
Last week’s best performers on ‘The List’ were Canadian Utilities Limited (CU-T), up +4.38%; Brookfield Infrastructure Partners (BIP-N), up +4.14%; and Enghouse Systems Limited (ENGH-T), up +3.61%.
TFI International (TFII-T) was the worst performer last week, down -5.15%.
| SYMBOL | COMPANY | YLD | PRICE | YTD % | DIV | YTD % | STREAK |
|---|---|---|---|---|---|---|---|
| ATD-T | Alimentation Couche-Tard Inc. | 0.9% | $75.32 | -1.9% | $0.70 | 17.4% | 14 |
| BCE-T | Bell Canada | 8.4% | $47.54 | -12.3% | $3.99 | 3.1% | 15 |
| BIP-N | Brookfield Infrastructure Partners | 4.6% | $35.19 | 14.7% | $1.62 | 5.9% | 16 |
| CCL-B-T | CCL Industries Inc. | 1.4% | $81.72 | 41.3% | $1.16 | 9.4% | 22 |
| CNR-T | Canadian National Railway | 2.1% | $157.34 | -5.7% | $3.38 | 7.0% | 28 |
| CTC-A-T | Canadian Tire | 4.3% | $161.20 | 16.3% | $7.00 | 1.4% | 13 |
| CU-T | Canadian Utilities Limited | 5.0% | $36.01 | 12.1% | $1.81 | 0.9% | 52 |
| DOL-T | Dollarama Inc. | 0.3% | $136.85 | 44.0% | $0.35 | 29.5% | 13 |
| EMA-T | Emera | 5.4% | $53.64 | 5.6% | $2.88 | 3.2% | 17 |
| ENB-T | Enbridge Inc. | 6.7% | $55.03 | 13.7% | $3.66 | 3.1% | 28 |
| ENGH-T | Enghouse Systems Limited | 3.0% | $33.30 | -2.0% | $1.00 | 18.3% | 17 |
| FNV-N | Franco Nevada | 1.1% | $125.51 | 14.0% | $1.44 | 5.9% | 16 |
| FTS-T | Fortis Inc. | 3.9% | $61.57 | 12.3% | $2.39 | 4.4% | 50 |
| IFC-T | Intact Financial | 1.9% | $261.13 | 28.4% | $4.84 | 10.0% | 19 |
| L-T | Loblaw Companies Limited | 1.1% | $177.74 | 38.3% | $1.92 | 10.0% | 12 |
| MFC-T | Manulife Financial | 4.0% | $39.93 | 38.3% | $1.60 | 9.6% | 10 |
| MGA-N | Magna | 4.4% | $42.73 | -23.0% | $1.90 | 3.3% | 14 |
| MRU-T | Metro Inc. | 1.6% | $84.84 | 23.8% | $1.34 | 10.7% | 29 |
| RY-T | Royal Bank of Canada | 3.4% | $167.84 | 26.2% | $5.72 | 7.1% | 13 |
| SJ-T | Stella-Jones Inc. | 1.3% | $87.34 | 14.0% | $1.12 | 21.7% | 19 |
| STN-T | Stantec Inc. | 0.8% | $108.55 | 3.7% | $0.83 | 7.8% | 12 |
| T-T | Telus | 6.8% | $22.66 | -4.5% | $1.53 | 7.1% | 20 |
| TD-T | TD Bank | 4.8% | $85.68 | 1.2% | $4.08 | 6.3% | 13 |
| TFII-N | TFI International | 1.2% | $137.86 | 5.1% | $1.60 | 10.3% | 13 |
| TIH-T | Toromont Industries | 1.5% | $130.66 | 15.8% | $1.92 | 11.6% | 34 |
| TRI-N | Thomson Reuters | 1.3% | $169.76 | 18.4% | $2.16 | 10.2% | 30 |
| TRP-T | TC Energy Corp. | 6.1% | $63.18 | 20.8% | $3.84 | 3.2% | 23 |
| WCN-N | Waste Connections | 0.6% | $177.34 | 19.7% | $1.14 | 8.6% | 14 |
| Averages | 3.1% | 13.5% | 8.8% | 21 |
Note: Stocks ending in “-N” declare earnings and dividends in US dollars. To achieve currency consistency between dividends and share price for these stocks, we have shown dividends in US dollars and share price in US dollars (these stocks are listed on a US exchange). The dividends for their Canadian counterparts (-T) would be converted into CDN dollars and would fluctuate with the exchange rate.
Check us out on magicpants.substack.com for more info in this week’s issue….
