Last updated by BM on October 16, 2024
Summary
This is a weekly installment of our MP Market Review series, which provides updates on the financial markets and Canadian dividend growth companies we monitor on ‘The List’.
- This week, we discuss The Art of Pruning: Letting Winners Run While Trimming Excess Growth.
- Last week, dividend growth of ‘The List’ ticked upwards and has increased by +8.9% YTD (income).
- Last week, the price of ‘The List’ was also up with a return of +13.3% YTD (capital).
- Last week, there were no dividend announcements from companies on ‘The List’.
- Last week, there were no earnings reports from companies on ‘The List’.
- This week, no companies on ‘The List’ are due to report earnings.
DGI Clipboard
“Selling your winners and holding your losers is like cutting the flowers and watering the weeds.”
– Peter Lynch
The Art of Pruning: Letting Winners Run While Trimming Excess Growth

Intro
Now that we’re halfway through our initial capital deployment in our business plan, we will soon see some of our stocks approach and surpass our maximum position size thresholds. One of our quality dividend growers has grown by over 40% since our purchases in late 2022 and 2023. As Mr. Lynch correctly points out, we don’t like to cut our flowers too early, but history has shown us that ‘pruning’ works just fine.
Selling Guidelines
We take a patient, long-term investment horizon when we invest and expect to hold the stock for decades, keeping portfolio turnover low. Portfolio turnover will be minimal, so selling will be rare. We will only sell a company under the following conditions:
- if the safety of the dividend payment has come into question
- the company’s long-term earnings power appears to have become impaired
- the stock’s valuation reaches seemingly excessive levels, or we find a more attractive idea
Based on the first two conditions, we won’t be selling any of the companies in our model portfolio. However, we will consider ‘pruning’ positions if valuations become excessively high.
Let’s take a closer look at one of the top performers in our portfolio—Royal Bank (RY-T)—to evaluate whether its recent success has pushed it into overvalued territory. To make this assessment, we rely on two valuation metrics: historical fundamentals and dividend yield theory. These tools help us gauge whether the stock’s current price has outpaced its intrinsic value or drifted too far from long-term averages.
Historical Fundamentals
The company’s operating results will determine a stock’s price in the long run.
Analyzing a company’s historical fundamentals tells you much about how the business has been valued over a longer time frame. Many of the stocks we invest in have a ‘narrow valuation corridor,’ which means the stock price follows a path that rarely deviates from its historical trading range. A company’s P/E (Price to Adjusted Operating Earnings), OCF (Price to Operating Cash Flow), EBITDA (Price to Earnings Before Interest Taxes and Amortization), and Sales (Price to Sales) ranges tell us a lot about how a company has been traditionally valued.
Purchasing at the bottom of these ranges or selling at the top has helped us manage our entry and exit points to enhance returns.
We use the Fundamental Analyzer Software Tool (FASTgraphs) to visualize how a company has been historically valued. We like to see it trading within its typical ‘valuation corridor’ based on a ten-to-twelve-year timeline. This gives us a clearer picture of how the stock is traded in different economic cycles.
Adjusted Operating Earnings
The following colours/lines on the FASTgraphs chart shown below represent:
Black line: Price
White line: Dividend
Orange line: Graham average of usually 15 P/E (price/earnings) for most stocks
Blue line: Normal P/E
Dashed or dotted lines: Estimates only
Green area: Earnings
Green dots: Purchases
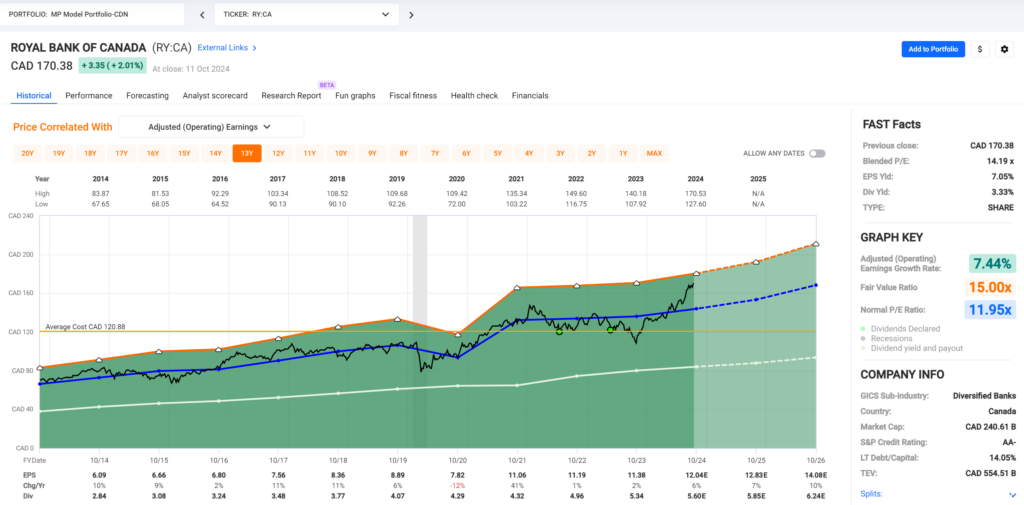
Royal Bank’s price (Black Line) has historically traded very close to its Normal P/E Ratio of 11.95 (Blue Line). Its current Blended P/E is at its highest point in ten years, 14.19. Based on its historical adjusted operating earnings, RY-T is showing signs of overvaluation.
Dividend Yield Theory
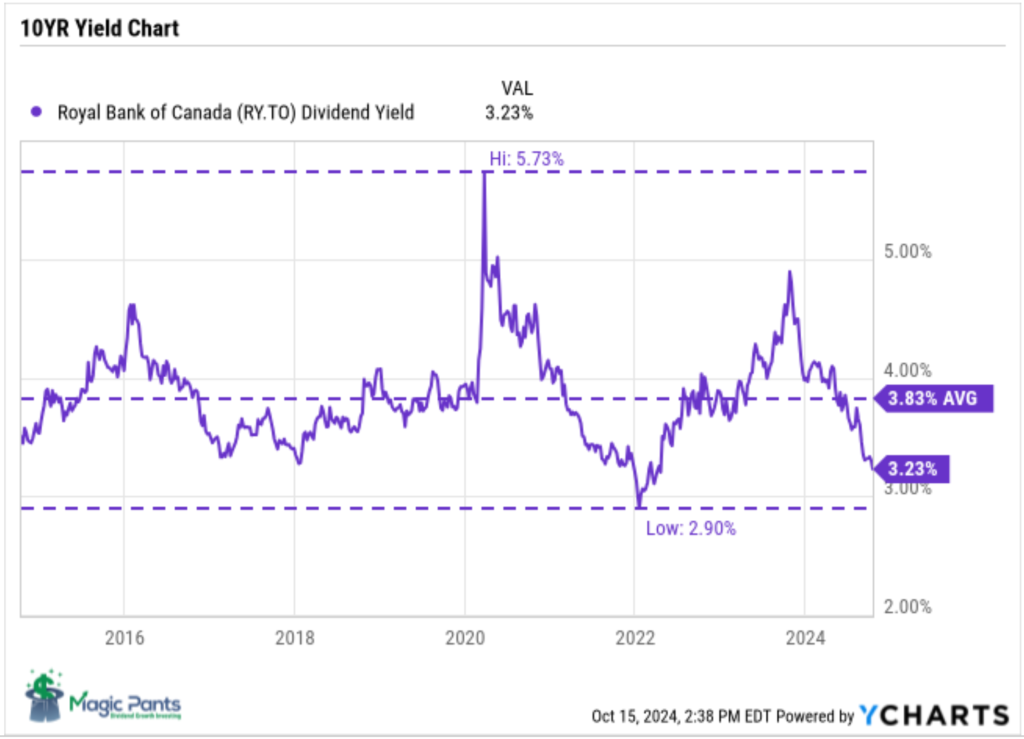
The dividend yield theory is a simple and intuitive approach to valuing dividend growth stocks. It suggests that the dividend yield of quality dividend growth stocks tends to revert to the mean over time, assuming that the underlying business model remains stable.
In practical terms, if a stock pays a dividend yield above its ten-year average annual yield, its price will likely increase to return the yield to its historical average. The opposite is true should the current yield be below the historical average.
Royal Bank’s yield has now fallen well below its historical average, signaling overvaluation at today’s price.
Wrap Up
These valuation metrics make Royal Bank shares appear overvalued, increasing the probability of a price pullback.
There’s real merit in letting winners run, and I’m not suggesting selling all your Royal Bank (RY-T) shares at this point. However, if you need to free up cash for other opportunities or have already reached your target allocation, selectively ‘pruning’ stocks with elevated valuations—like RY-T—aligns with our established selling guidelines.
DGI Scorecard
The List (2024)
The Magic Pants 2024 list includes 28 Canadian dividend growth stocks. Here are the criteria to be considered a candidate on ‘The List’:
- Dividend growth streak: 10 years or more.
- Market cap: Minimum one billion dollars.
- Diversification: Limit of five companies per sector, preferably two per industry.
- Cyclicality: Exclude REITs and pure-play energy companies due to high cyclicality.
Based on these criteria, companies are added or removed from ‘The List’ annually on January 1. Prices and dividends are updated weekly.
‘The List’ is not a portfolio; it is a coaching tool that helps us think about ideas and risk manage our model portfolio. We own some but not all the companies on ‘The List’.
Our newsletter provides readers with a comprehensive insight into the implementation and advantages of our Canadian dividend growth investing strategy. This evidence-based, unbiased approach empowers DIY investors to outperform both actively managed dividend funds and passively managed indexes and dividend ETFs over longer-term horizons.
For those interested in something more, please upgrade to a paid subscriber; you get the enhanced weekly newsletter, access to premium content, full privileges on the new Substack website magicpants.substack.com and DGI alerts whenever we make stock transactions in our model portfolio.
Performance of ‘The List’
Last week, dividend growth of ‘The List’ was up and has now increased by +8.9% YTD (income).
Last week, the price return of ‘The List’ was up with a return of +13.3% YTD (capital).
Even though prices may fluctuate, the dependable growth in our income does not. Stay the course. You will be happy you did.
Last week’s best performers on ‘The List’ were Dollarama Inc. (DOL-T), up +4.38%; Stantec Inc. (STN-T), up +4.02%; and Canadian National Railway (CNR-T), up +3.51%.
TD Bank (TD-T) was the worst performer last week, down -9.28%.
| SYMBOL | COMPANY | YLD | PRICE | YTD % | DIV | YTD % | STREAK |
|---|---|---|---|---|---|---|---|
| ATD-T | Alimentation Couche-Tard Inc. | 1.0% | $72.27 | -5.8% | $0.70 | 17.4% | 14 |
| BCE-T | Bell Canada | 8.8% | $45.45 | -16.1% | $3.99 | 3.1% | 15 |
| BIP-N | Brookfield Infrastructure Partners | 4.8% | $34.04 | 10.9% | $1.62 | 5.9% | 16 |
| CCL-B-T | CCL Industries Inc. | 1.4% | $81.34 | 40.6% | $1.16 | 9.4% | 22 |
| CNR-T | Canadian National Railway | 2.1% | $159.43 | -4.5% | $3.38 | 7.0% | 28 |
| CTC-A-T | Canadian Tire | 4.4% | $158.95 | 14.7% | $7.00 | 1.4% | 13 |
| CU-T | Canadian Utilities Limited | 5.1% | $35.59 | 10.8% | $1.81 | 0.9% | 52 |
| DOL-T | Dollarama Inc. | 0.2% | $144.03 | 51.6% | $0.35 | 29.5% | 13 |
| EMA-T | Emera | 5.7% | $50.63 | -0.3% | $2.88 | 3.2% | 17 |
| ENB-T | Enbridge Inc. | 6.5% | $56.56 | 16.9% | $3.66 | 3.1% | 28 |
| ENGH-T | Enghouse Systems Limited | 3.2% | $31.23 | -8.1% | $1.00 | 18.3% | 17 |
| FNV-N | Franco Nevada | 1.2% | $123.57 | 12.2% | $1.44 | 5.9% | 16 |
| FTS-T | Fortis Inc. | 4.0% | $59.74 | 8.9% | $2.39 | 4.4% | 50 |
| IFC-T | Intact Financial | 1.8% | $264.00 | 29.8% | $4.84 | 10.0% | 19 |
| L-T | Loblaw Companies Limited | 1.1% | $177.41 | 38.0% | $1.92 | 10.0% | 12 |
| MFC-T | Manulife Financial | 3.8% | $41.82 | 44.8% | $1.60 | 9.6% | 10 |
| MGA-N | Magna | 4.6% | $41.40 | -25.4% | $1.90 | 3.3% | 14 |
| MRU-T | Metro Inc. | 1.6% | $84.10 | 22.8% | $1.34 | 10.7% | 29 |
| RY-T | Royal Bank of Canada | 3.4% | $170.38 | 28.1% | $5.72 | 7.1% | 13 |
| SJ-T | Stella-Jones Inc. | 1.2% | $92.66 | 21.0% | $1.12 | 21.7% | 19 |
| STN-T | Stantec Inc. | 0.7% | $116.83 | 11.6% | $0.83 | 7.8% | 12 |
| T-T | Telus | 6.9% | $22.28 | -6.1% | $1.53 | 7.1% | 20 |
| TD-T | TD Bank | 5.2% | $78.48 | -7.3% | $4.08 | 6.3% | 13 |
| TFII-N | TFI International | 1.1% | $139.27 | 6.2% | $1.60 | 10.3% | 13 |
| TIH-T | Toromont Industries | 1.4% | $133.89 | 18.7% | $1.92 | 11.6% | 34 |
| TRI-N | Thomson Reuters | 1.3% | $167.26 | 16.7% | $2.16 | 12.5% | 30 |
| TRP-T | TC Energy Corp. | 6.1% | $62.81 | 20.1% | $3.84 | 3.2% | 23 |
| WCN-N | Waste Connections | 0.6% | $181.40 | 22.4% | $1.14 | 8.6% | 14 |
| Averages | 3.2% | 13.3% | 8.9% | 21 |
Note: Stocks ending in “-N” declare earnings and dividends in US dollars. To achieve currency consistency between dividends and share price for these stocks, we have shown dividends in US dollars and share price in US dollars (these stocks are listed on a US exchange). The dividends for their Canadian counterparts (-T) would be converted into CDN dollars and would fluctuate with the exchange rate.
Check us out on magicpants.substack.com for more info in this week’s issue….
