Last updated by BM on May 20, 2024
Summary
This is a weekly installment of our MP Market Review series, which provides updates on the financial markets and Canadian dividend growth companies we monitor on ‘The List’.
- A further analysis of the top stock picks in our ‘Timely Ten’ in this week’s newsletter.
- Last week, dividend growth of ‘The List’ stayed the same and has increased by +8.6% YTD (income).
- Last week, price return of ‘The List’ was up with a return of +5.7% YTD (capital).
- Last week, there were no dividend announcements from companies on ‘The List’.
- Last week, there was one earnings report from a company on ‘The List’.
This week, no companies on ‘The List’ are due to report earnings.
DGI Clipboard
“The desirability of a business with outstanding economic characteristics can be ruined by the price you pay.”
-Charlie Munger
Quality and Value: Analyzing the Top Picks from the ‘Timely Ten’

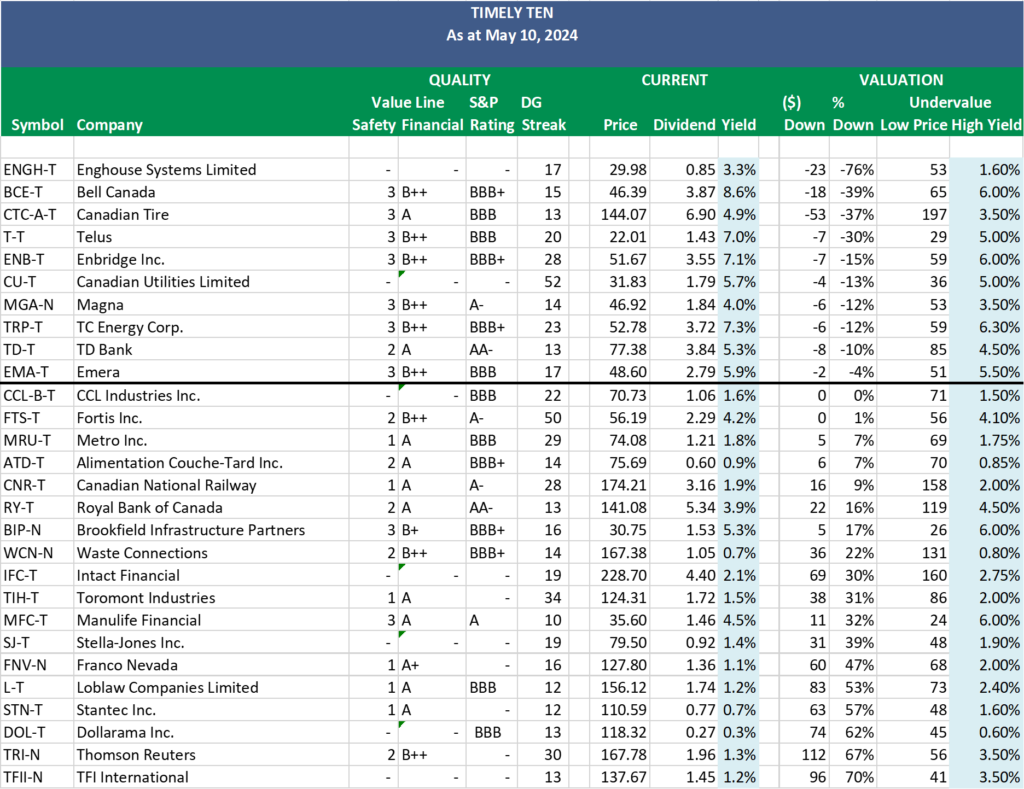
Last week, we identified the ‘Timely Ten’ companies on ‘The List’ that were reasonably priced based on dividend yield theory. This week, we will delve deeper into this group of stocks and explore what determines a quality company to see if there are any investable candidates. The stocks above the black line make up the ‘Timely Ten.’

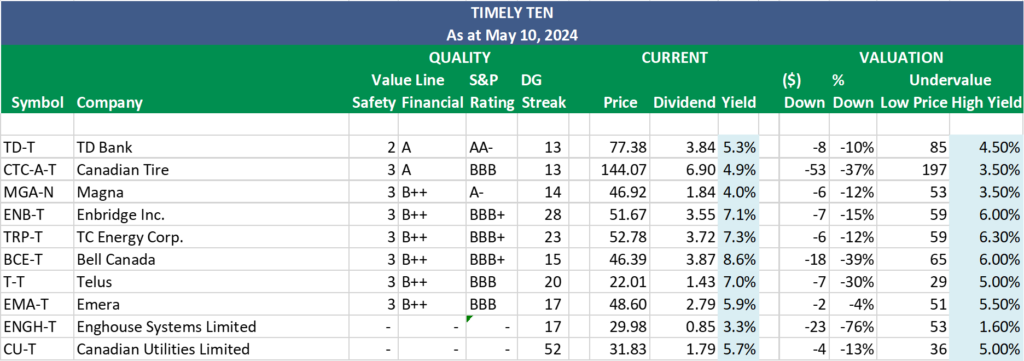
We find independent research from services that sell information for a living to be helpful in further assessing quality. Value Line (VL) and S&P ratings can typically be found with some digging. We also like to compare them alongside the dividend growth streak (DG Streak) in case we need a tiebreaker. In the chart below, we sort our ‘Timely Ten’ using these variables.

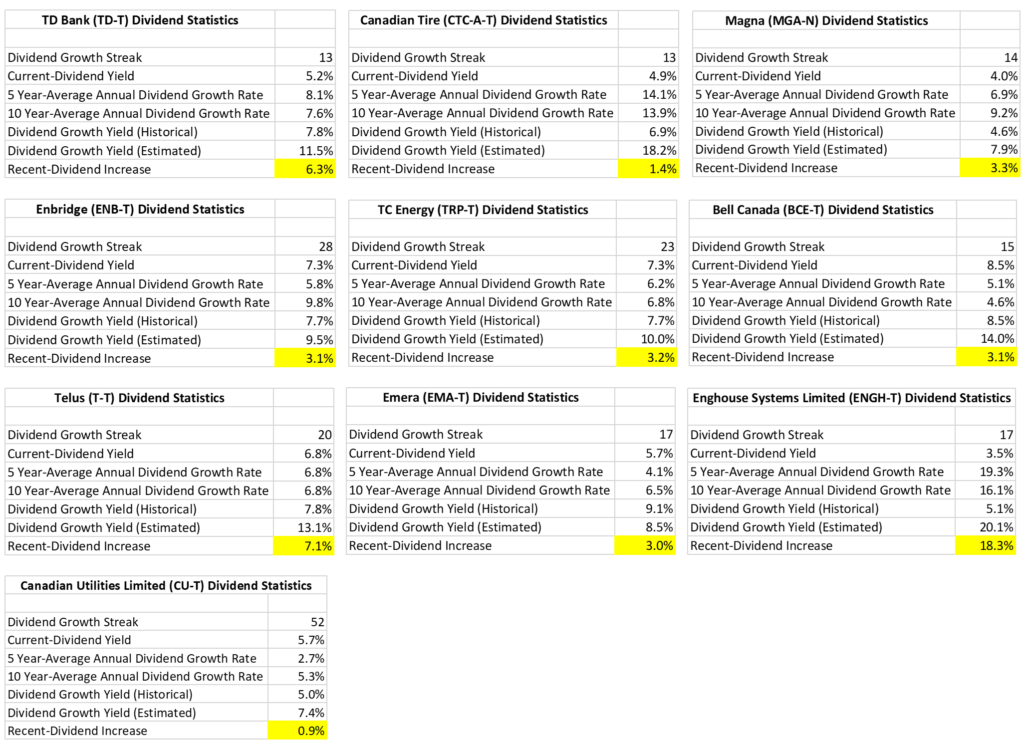
We then take our candidates and compare their dividend statistics. A company we invest in rarely satisfies all of our criteria, but the more ‘indicators’ we check off, the higher the quality of the business:
- Dividend Growth Streak
- Current Dividend Yield
- Dividend Growth Rates (5YR and 10YR)
- Historical Growth Yield
- Estimated Forward Growth Yield
- Recent Dividend Increase

The stocks from ‘The List’ we follow generally exhibit above-average dividend quality. After all, they are on ‘The List’ to begin with. One stat I have highlighted in this group of companies is the ‘Recent Dividend Increase’.
Quality dividend growth companies typically announce dividend increases because they believe in the company’s short-term prospects. The extent of the increase reflects management’s confidence level. For instance, Canadian Tire and Canadian Utilities have opted for nominal increases, likely to maintain their dividend growth streaks despite lower confidence. They would not be good candidates if I was investing now.
Among the ‘Timely Ten,’ TD Bank (TD-T), Telus (T-T), and Enghouse Systems Limited (ENGH-T) have recently increased their dividends in line with historical averages, making them stand out and worthy of closer examination.
Our next step is to analyze why these companies have been under pressure and assess whether these issues are temporary or longer-term.
Enghouse Systems Limited (ENGH-T)
Enghouse Systems’ EPS has declined at a compound annual rate of 11% over the last three years. This decline is slower than the 21% annual reduction in the share price, suggesting that the EPS drop has disappointed the market and made investors hesitant. A significant concern is the potential impact of AI on Enghouse’s customer experience management interests.
TD Bank (TD-T)
TD Bank’s recent troubles began with media reports of alleged fentanyl money laundering. Analysts are uncertain about the severity of potential fines from the US Department of Justice.
Telus (T-T)
Telus faces multiple challenges, primarily due to increased competition in the Canadian wireless industry. Like any telecom, Telus has to borrow heavily to fund its network investments, making it vulnerable to rising interest rates. In 2023, Telus spent $1.27 billion in net interest costs, a significant increase from $847 million in 2022. Although Telus shares rallied earlier this year on expectations of aggressive rate cuts in 2024, persistent inflation has tempered these hopes.
Next, we review earnings reports. TD Bank and Telus both beat earnings expectations in their most recent Q1 earnings results. Only Enghouse Systems Limited beat earnings from the same period a year ago. Management in all three companies seems optimistic about the future in their guidance.
Conclusion
TD Bank and Enghouse Systems both face significant uncertainties. Telus, on the other hand, appears to have stabilized with its latest earnings report. Deciding which company to invest in now depends significantly on your risk tolerance.
DGI Scorecard
The List (2024)
The Magic Pants 2024 list includes 28 Canadian dividend growth stocks. Here are the criteria to be considered a candidate on ‘The List’:
- Dividend growth streak: 10 years or more.
- Market cap: Minimum one billion dollars.
- Diversification: Limit of five companies per sector, preferably two per industry.
- Cyclicality: Exclude REITs and pure-play energy companies due to high cyclicality.
Based on these criteria, companies are added or removed from ‘The List’ annually on January 1. Prices and dividends are updated weekly.
While ‘The List’ is not a standalone portfolio, it functions admirably as an initial guide for those seeking to broaden their investment portfolio and attain superior returns in the Canadian stock market. Our newsletter provides readers with a comprehensive insight into the implementation and advantages of our Canadian dividend growth investing strategy. This evidence-based, unbiased approach empowers DIY investors to outperform both actively managed dividend funds and passively managed indexes and dividend ETFs over longer-term horizons.
For those interested in something more, please upgrade to a paid subscriber; you get the enhanced weekly newsletter, access to premium content, full privileges on the new Substack website magicpants.substack.com and DGI alerts whenever we make stock transactions in our model portfolio.
Performance of ‘The List’
Last week, dividend growth of ‘The List’ stayed the same and has increased by +8.6% YTD (income).
Last week, ‘The List’ ‘s price return was up, with a +5.7% YTD (capital).
Even though prices may fluctuate, the dependable growth in our income does not. Stay the course. You will be happy you did.
Last week’s best performers on ‘The List’ were Stella-Jones Inc. (SJ-T), up +4.33%; Emera (EMA-T), up +3.77%; and Dollarama Inc. (DOL-T), up +3.75%.
Enghouse Systems Limited (ENGH-T) was the worst performer last week, down -3.34%.
| SYMBOL | COMPANY | YLD | PRICE | YTD % | DIV | YTD % | STREAK |
|---|---|---|---|---|---|---|---|
| ATD-T | Alimentation Couche-Tard Inc. | 0.9% | $75.41 | -1.8% | $0.70 | 17.4% | 14 |
| BCE-T | Bell Canada | 8.5% | $46.76 | -13.7% | $3.99 | 3.1% | 15 |
| BIP-N | Brookfield Infrastructure Partners | 5.3% | $30.65 | -0.1% | $1.62 | 5.9% | 16 |
| CCL-B-T | CCL Industries Inc. | 1.6% | $71.69 | 23.9% | $1.16 | 9.4% | 22 |
| CNR-T | Canadian National Railway | 2.0% | $173.19 | 3.8% | $3.38 | 7.0% | 28 |
| CTC-A-T | Canadian Tire | 4.9% | $144.17 | 4.0% | $7.00 | 1.4% | 13 |
| CU-T | Canadian Utilities Limited | 5.7% | $31.84 | -0.9% | $1.81 | 0.9% | 52 |
| DOL-T | Dollarama Inc. | 0.3% | $122.76 | 29.2% | $0.35 | 29.5% | 13 |
| EMA-T | Emera | 5.7% | $50.43 | -0.7% | $2.87 | 3.0% | 17 |
| ENB-T | Enbridge Inc. | 7.3% | $50.04 | 3.4% | $3.66 | 3.1% | 28 |
| ENGH-T | Enghouse Systems Limited | 3.5% | $28.98 | -14.7% | $1.00 | 18.3% | 17 |
| FNV-N | Franco Nevada | 1.1% | $128.48 | 16.7% | $1.44 | 5.9% | 16 |
| FTS-T | Fortis Inc. | 4.3% | $55.49 | 1.2% | $2.36 | 3.3% | 50 |
| IFC-T | Intact Financial | 2.1% | $229.63 | 12.9% | $4.84 | 10.0% | 19 |
| L-T | Loblaw Companies Limited | 1.2% | $157.48 | 22.5% | $1.92 | 10.0% | 12 |
| MFC-T | Manulife Financial | 4.4% | $36.34 | 25.8% | $1.60 | 9.6% | 10 |
| MGA-N | Magna | 4.0% | $47.49 | -14.4% | $1.90 | 3.3% | 14 |
| MRU-T | Metro Inc. | 1.8% | $74.71 | 9.0% | $1.34 | 10.7% | 29 |
| RY-T | Royal Bank of Canada | 3.8% | $145.34 | 9.2% | $5.52 | 3.4% | 13 |
| SJ-T | Stella-Jones Inc. | 1.4% | $82.94 | 8.3% | $1.12 | 21.7% | 19 |
| STN-T | Stantec Inc. | 0.8% | $108.56 | 3.7% | $0.83 | 7.8% | 12 |
| T-T | Telus | 6.8% | $22.59 | -4.8% | $1.53 | 7.1% | 20 |
| TD-T | TD Bank | 5.2% | $77.95 | -8.0% | $4.08 | 6.3% | 13 |
| TFII-N | TFI International | 1.2% | $133.21 | 1.5% | $1.60 | 10.3% | 13 |
| TIH-T | Toromont Industries | 1.6% | $123.22 | 9.2% | $1.92 | 11.6% | 34 |
| TRI-N | Thomson Reuters | 1.3% | $171.02 | 19.3% | $2.16 | 10.2% | 30 |
| TRP-T | TC Energy Corp. | 7.3% | $52.95 | 1.2% | $3.84 | 3.2% | 23 |
| WCN-N | Waste Connections | 0.7% | $167.59 | 13.1% | $1.14 | 8.6% | 14 |
| Averages | 3.4% | 5.7% | 8.6% | 21 |
Note: Stocks ending in “-N” declare earnings and dividends in US dollars. To achieve currency consistency between dividends and share price for these stocks, we have shown dividends in US dollars and share price in US dollars (these stocks are listed on a US exchange). The dividends for their Canadian counterparts (-T) would be converted into CDN dollars and would fluctuate with the exchange rate.
Check us out on magicpants.substack.com for more info in this week’s issue….

