Last updated by BM on May 15, 2023
Summary
- This is a weekly installment of our MP Market Review series, which provides updates on the financial markets and Canadian dividend growth companies we monitor on ‘The List’.
- Last week, ‘The List’ was flat with a YTD price return of +7.3% (capital). Dividend growth remained the same and is now at +8.4% YTD, highlighting growth in income over the past year.
- Last week, no dividend increases from companies on ‘The List’.
- Last week, seven earnings reports from companies on ‘The List’.
- No companies on ‘The List’ are due to report earnings this week.
- If you’re interested in creating your own dividend growth income portfolio, consider subscribing to our premium service, which grants you access to the MP Wealth-Builder Model Portfolio (CDN) and exclusive subscriber-only content. Learn More

Introduction
“You have a pair of pants. In the left pocket, you have $100. You take $1 out of the left pocket and put it in the right pocket. You now have $101. There is no diminution of dollars in your left pocket. That is one magic pair of pants.”
This ‘magic pants’ analogy was from a Seeking Alpha article on dividend investing I read about a decade ago and was one of the catalysts for me to take a closer look at this type of investing and see if it truly was magical.
After conducting additional research, I have shifted towards utilizing a dividend growth investing (DGI) strategy as my primary investment approach. While I maintain portfolios consisting of high-quality dividend growers from both the United States and Canada, I have opted to concentrate on Canadian (CDN) dividend growth companies in this blog. This is due to several reasons, including a smaller pool of DGI companies to track, a lack of coverage for the DGI strategy by the North American investment media, and a tendency for those who do cover DGI to narrowly focus on only a handful of sectors (Energy and Financials).
While ‘The List’ is not a portfolio in itself, it serves as an excellent initial reference for individuals seeking to diversify their investments and attain higher returns in the Canadian stock market. Through our blog, we provide weekly updates on ‘The List’ and offer valuable perspectives and real-life examples of the dividend growth investing strategy in practice. This helps readers gain a deeper understanding of how to implement and benefit from this investment approach.
DGI Thoughts
“Investing is not a game where the guy with the 160 IQ beats the guy with the 130 IQ.”
– Warren Buffett
Q1 2023 earnings season for companies on ‘The List’ is now behind us. Check out the earnings calendar results at the bottom of ‘The List’ page.
Next week we will send all Subscribers the yearly review of our MP Wealth-Builder Model Portfolio (CDN). Despite negative results from the benchmarks we track, the portfolio generated positive income and capital returns in its inaugural year (May 1, 2022-April 30, 2023).
Here is a glimpse at some of our best purchases from 2022:

We are making good progress towards achieving the income goals set out in our business plan, which serves as a comprehensive roadmap for our model portfolio. If you haven’t joined us as a Subscriber yet and haven’t been receiving our timely DGI Alerts, informing you about the purchase of our reliable dividend-growing stocks and the reasons behind them, what are you waiting for?
If our strategy and approach to dividend growth can safeguard your investment capital while generating increasing income and capital growth in the current economic climate, there’s a strong likelihood that it can do so in virtually any market. Don’t miss out on this opportunity.
If you have not yet joined as a subscriber of the blog to receive DGI Alerts on the activity and content related to our model portfolio, it’s not too late. Click Here.
Recent News
Canadian Tire results show consumer shift from discretionary purchases (Globe & Mail)
Canadian Tire has been under consideration for some time, but we have not yet identified the ideal opportunity to invest. The company’s performance in the last quarter was particularly challenging, with a mild winter and a fire incident at one of their distribution centers. As the economy experiences a slowdown, consumers have become more cautious in their spending habits. As a result, we are waiting for either a positive shift in the economy or a significant margin of safety before deciding to initiate a position in Canadian Tire.
With utilities recovering from a 2022 beating, this is my go-to stock (Globe & Mail)
The stock covered in this article has been paying a growing dividend for almost 50 years! You rarely hear about it when markets are roaring, but it continues to provide market beating returns decade after decade when purchased at a sensible price. One of the original four dividend growers I bought way back in 2012 in the mid $30 dollar range.
To receive breaking news about companies on ‘The List’ follow us on Twitter @MagicPants_DGI.
The List (2023)
Last updated by BM on May 12, 2023
The Magic Pants List contains 27 Canadian dividend growth stocks. ‘The List’ contains Canadian companies that have raised their dividend yearly for at least the last ten years and have a market cap of over a billion dollars. Below is each stock’s symbol, name, current yield, current price, price return year-to-date, current dividend, dividend growth year-to-date and current dividend growth streak. Companies on ‘The List’ are added or subtracted once a year, on January 1. After that, ‘The List’ is set for the next twelve months. Prices and dividends are updated weekly.
| SYMBOL | COMPANY | YLD | PRICE | YTD % | DIV | YTD % | STREAK |
|---|---|---|---|---|---|---|---|
| AQN-N | Algonquin Power & Utilities | 5.9% | $8.61 | 27.9% | $0.51 | -29.0% | 12 |
| ATD-T | Alimentation Couche-Tard Inc. | 0.8% | $66.68 | 10.9% | $0.56 | 19.1% | 13 |
| BCE-T | Bell Canada | 6.0% | $64.17 | 6.5% | $3.82 | 5.0% | 14 |
| BIP-N | Brookfield Infrastructure Partners | 4.4% | $35.85 | 5.2% | $1.44 | 6.3% | 15 |
| CCL-B-T | CCL Industries | 1.6% | $68.01 | 17.2% | $1.06 | 10.4% | 21 |
| CNR-T | Canadian National Railway | 1.9% | $163.41 | 0.3% | $3.16 | 7.8% | 27 |
| CTC-A-T | Canadian Tire | 4.1% | $168.28 | 14.8% | $6.90 | 17.9% | 12 |
| CU-T | Canadian Utilities Limited | 4.5% | $39.47 | 6.8% | $1.79 | 1.0% | 51 |
| DOL-T | Dollarama Inc. | 0.3% | $84.46 | 5.8% | $0.27 | 23.8% | 12 |
| EMA-T | Emera | 4.7% | $58.99 | 12.1% | $2.76 | 3.0% | 16 |
| ENB-T | Enbridge Inc. | 6.8% | $52.11 | -2.3% | $3.55 | 3.2% | 27 |
| ENGH-T | Enghouse Systems Limited | 2.4% | $35.32 | -1.1% | $0.85 | 18.2% | 16 |
| FNV-N | Franco Nevada | 0.9% | $156.72 | 13.4% | $1.36 | 6.3% | 15 |
| FTS-T | Fortis | 3.7% | $61.55 | 11.2% | $2.26 | 4.1% | 49 |
| IFC-T | Intact Financial | 2.2% | $199.57 | 1.9% | $4.40 | 10.0% | 18 |
| L-T | Loblaws | 1.4% | $123.45 | 2.6% | $1.74 | 10.3% | 11 |
| MGA-N | Magna | 3.5% | $52.56 | -8.6% | $1.84 | 2.2% | 13 |
| MRU-T | Metro | 1.5% | $78.56 | 4.1% | $1.21 | 10.0% | 28 |
| RY-T | Royal Bank of Canada | 4.1% | $129.89 | 1.5% | $5.28 | 6.5% | 12 |
| SJ-T | Stella-Jones Inc. | 1.6% | $58.58 | 18.2% | $0.92 | 15.0% | 18 |
| STN-T | Stantec Inc. | 1.0% | $78.91 | 20.8% | $0.77 | 8.5% | 11 |
| TD-T | TD Bank | 4.7% | $82.33 | -6.1% | $3.84 | 7.9% | 12 |
| TFII-N | TFI International | 1.3% | $107.00 | 6.9% | $1.40 | 29.6% | 12 |
| TIH-T | Toromont Industries | 1.6% | $105.66 | 8.1% | $1.68 | 10.5% | 33 |
| TRP-T | TC Energy Corp. | 6.6% | $55.94 | 5.0% | $3.69 | 3.4% | 22 |
| T-T | Telus | 5.2% | $27.74 | 5.4% | $1.43 | 7.3% | 19 |
| WCN-N | Waste Connections | 0.7% | $143.89 | 9.2% | $1.02 | 7.4% | 13 |
| Averages | 3.1% | 7.3% | 8.4% | 19 |
Six Canadian stocks on ‘The List’ declare earnings and dividends in US dollars and are inter-listed on a US exchange in US dollars. The simplest way to display dividend and price metrics for these stocks is to show their US exchange symbols along with their US dividends and price. The stocks I am referring to have a -N at the end of their symbols. You can still buy their Canadian counterparts (-T), but your dividends will be converted into CDN dollars and will fluctuate based on the exchange rate.
Note: When the dividend and share price currency match, the calculation is straightforward. But it’s not so simple when the dividend is declared in one currency, and the share price is quoted in another. Dividing the former by the latter would produce a meaningless result because it’s a case of apples and oranges. To calculate the yield properly, you must express the dividend and share price in the same currency.
Performance of ‘The List’
Feel free to click on this link, ‘The List’ for a sortable version from our website.
Last week, ‘The List’ was flat with a YTD price return of +7.3% (capital). Dividend growth remained the same and is now at +8.4% YTD, highlighting growth in income over the past year.
The best performers last week on ‘The List’ were Stella-Jones Inc. (SJ-T), up +7.74%; CCL Industries (CCL-B-T), up +6.18%; and Waste Connections (WCN-N), up +2.18%.
Canadian Tire (CTC-A-T) was the worst performer last week, down -3.65%.
Dividend Increases
“The growth of dividend paying ability is of significance in the determination of a stock’s quality, or general safety…”
– Arnold Bernhard (the founder of Value Line)
“As a dividend increase is a positive sign of a company’s financial strength, the safest purchase, after research, is a stock with a recent dividend increase.”
– Tom Connolly (the founder of dividendgrowth.ca)
Last week, no dividend increases from companies on ‘The List’.
Earnings Releases
Benjamin Graham once remarked that earnings are the principal factor driving stock prices.
Each quarter we will provide readers with weekly earnings updates of stocks on ‘The List’ during the calendar earnings season. Q1 2023 earnings season is now over!
The updated earnings calendar can be found here.
Earnings growth and dividend growth tend to go hand in hand, so this information can tell us a lot about the future dividend growth of our quality companies. Monitoring our dividend growers periodically is part of the process, and reading the quarterly earnings releases is a good place to start.
No earnings reports from companies on ‘The List’ this week
Last week, seven earnings report from companies on ‘The List’.
Stella-Jones Inc. (SJ-T) released its first-quarter fiscal 2023 results on Wednesday, May 10, 2023, before markets opened.
“The Company had an excellent start to the year, propelled by the momentum of our growth in 2022. Our record results in Q1 featured strong sales, higher EBITDA and margin, and were marked by an out-performance of our utility poles product category, which saw a 29% organic sales increase. Our first quarter results also reflected steady sales growth in railway ties, aligned with our expectations for this product category, and an anticipated pullback in residential lumber sales compared to 2022.
Stella-Jones’ performance in the first quarter further evidenced our ongoing proactivity in securing fibre supply and increasing pole production capacity, and our financial strength to support growth. We are executing on our plan to grow our infrastructure-related businesses, and deliver on our commitment to return capital to shareholders. As we continue to invest in our business and seek expansion opportunities, we are fulfilling or exceeding the objectives laid out in our 3-year plan and I am proud of our business for continuously delivering such a high standard of service to our customers.”
– President and Chief Executive Officer, Eric Vachon
Highlights:
- Sales of $710 million for the first quarter
- Strong 18% organic sales growth in infrastructure-related businesses
- Record EBITDA of $120 million, or a margin(1) of 16.9%, up from 13.5% in Q1 2022
- Net income of $60 million, or $1.03 per share, up 41% from EPS in Q1 2022
Outlook:
The Company continues to be favourably positioned to meet or exceed the financial objectives set for 2024, as summarized in the table below. Driven by the out-performance of utility poles, sales in 2024 are now expected to exceed the target range. By 2024, utility poles sales are projected to grow at a compound annual rate of 20% from 2022 and the Company’s EBITDA margin is expected to exceed the 15% target by approximately 100 basis points.
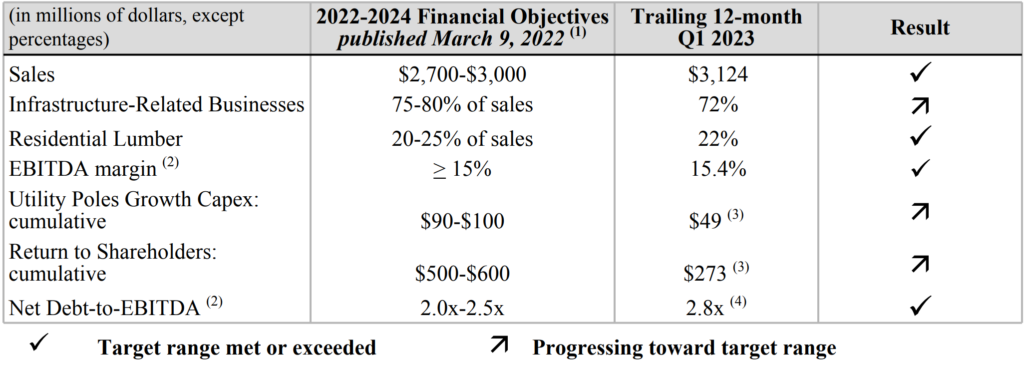
Source: (SJ-T) Q1-2023 News Release
CCL Industries (CCL-B-T) released its first-quarter fiscal 2023 results on Wednesday, May 10, 2023, after markets closed.
“I am pleased to report first quarter results ahead of internal expectations. The CCL Segment and Checkpoint both posted organic sales growth and solid improvements in profitability while Avery had an outstanding quarter. Innovia results improved sequentially compared to the fourth quarter of 2022 but were below prior year first quarter. This all summed to a 10.6% increase in adjusted basic earnings to $0.94 per Class B share(3) , compared to the first quarter of 2022.”
– President and Chief Executive Officer, Geoffrey T. Martin
Highlights:
- Per Class B share: $0.94 adjusted basic earnings up 10.6%; $0.94 basic earnings up 11.9%; currency translation positive $0.05 per share
- Sales increased 8.6% on 1.4% organic growth, 3.0% acquisitions and 4.2% positive currency translation
- Operating income improved 12.7%, with a 15.6% operating margin up 60 bps
Outlook:
- Core CCL business units’ outlook stable overall
- CCL Design: expect some recovery in Q2 as China has a full quarter
- CCL Secure will be below Q2 22
- Avery back to school season started very early Q2 22, will not repeat in 2023…..so tough comps for Q2, easier for Q3
- Checkpoint: apparel market conditions unlikely to improve much until H2 23, MAS outlook stable with easier comps
- Innovia volume continues to be impacted by weak label materials industry demand, inflationary pressures and inventory cost squeeze both easing
- Modest FX tailwind
Source: (CCL-B-T) Q1-2023 News Release
Intact Financial (IFC-T) released its first-quarter fiscal 2023 results on Wednesday, May 10, 2023, after markets closed.
“The business delivered another strong quarter, with a mid-teens operating ROE and solid results in all geographies. Since closing the RSA acquisition, we have been active in improving performance and de-risking the transaction. The UK&I segment is now well along the path to outperformance, and we expect it to reach a low-90s combined ratio by the end of 2024, a year ahead of schedule. I remain confident in the outlook for Intact as a whole, and our strong balance sheet positions us to capture opportunities as they arise.”
– Chief Executive Officer, Charles Brindamour
Highlights:
- Operating DPW growth of 4% in Q1-2023 despite the exit of UK personal lines motor, mainly reflecting rate actions in supportive market conditions
- Combined ratio of 87.4% (91.9% undiscounted), reflected solid underwriting performance in all geographies
- Net operating income per share up 4% to $3.06 on premium growth, higher investment yields and increased distribution income
- EPS decreased to $2.06, due in part to non-recurring UK personal lines motor exit expenses, while ROE was 15.4%
- BVPS decreased 6% from Q4-2022 to $77.72, largely reflecting the UK pension de-risking actions
- Balance sheet remained strong with a total capital margin of $2.8 billion, and debt-to-total capital ratio on track to return towards 20% by year end 2023
Outlook:
- Over the next twelve months, we expect firm-to-hard insurance market conditions to continue in most lines of business, driven by inflation, natural disasters, and a hard reinsurance market.
- In Canada, we expect firm market conditions to continue in personal property. Personal auto premiums are expected to grow by mid-to-high single-digits in response to inflation and evolving driving patterns.
- In commercial and specialty lines across all geographies, we continue to expect hard market conditions in most lines of business.
- In the UK&I, the personal property market has begun to firm but further rate increases are required to deal with inflationary pressures, natural disasters and a hard reinsurance market.
Source: (IFC-T) Q1-2023 News Release
Stantec (STN-T) released its first-quarter fiscal 2023 results on Wednesday, May 10, 2023, after markets closed.
“Our first quarter results reflect the strong market positioning of our business as we continue to build on favorable macro themes and momentum coming out of last year. 2023 is shaping up to be another very strong year for Stantec and we are well positioned to deliver on our outlook for the year.”
– President and Chief Executive Officer, Gord Johnston
Highlights:
- Net revenue of $1.2 billion, an increase of 17.0% over Q1 2022
- Adjusted diluted EPS1 of $0.73, up 19.7% over Q1 2022
- Backlog of $6.2 billion, up 5.6% since December 31, 2022 and 14.8% over Q1 2022
- Full year guidance for 2023 reaffirmed
Outlook:
We reaffirm our guidance provided in the Outlook section of our 2022 Annual Report (incorporated here by reference). Our annual targets were based on the assumption of continued public sector spending in alignment with announced programs and acts, and only modest transitory recessions in key geographies.
We expect that net revenue growth will increase 7% to 11%, with net revenue organic growth in the mid- to highsingle digits. Organic growth in the US is expected to be in the high single digits to low double digits, driven by momentum from our record-high US backlog and project opportunities arising from announced programs and acts. In Canada, we expect to maintain high levels of activity, moderating to organic growth in the low single digits. Organic growth in Global is expected to achieve mid- to high-single digits, driven by continued high levels of activity in our UK Water business and demand and stimulus in environmental services and infrastructure sectors.
We expect to deliver on our annual targets on adjusted EBITDA and adjusted net income margins and growth in adjusted diluted EPS through our continued discipline in the management of administration and marketing costs, investments in the commercialization of new innovations and technologies, and implementation of our 2023 Real Estate Strategy.
While our Q1 2023 net revenue and adjusted diluted EPS growth exceeded our target annual ranges, our expectations for the full year remain unchanged. Further, our adjusted EBITDA and adjusted net income margins for Q1 2023 are below our targeted annual ranges due to the typical slowdown in the first quarter related to winter weather conditions and holiday schedules. We remain confident we will achieve our annual targets by the end of the fiscal year.
Source: (STN-T) Q1-2023 News Release
Canadian Tire (CTC-A-T) released its first-quarter fiscal 2023 results on Thursday, May 11, 2023, before markets opened.
“Our Q1 financial results were impacted by a number of factors. Our Retail segment was impacted by the fire at our A.J. Billes distribution centre, as well as unseasonably mild winter weather and a slow start to spring in several regions of Canada. The Financial Services business historically makes a significant contribution to Canadian Tire Corporation’s performance in the first quarter, and this quarter was no different. The strength of our teams and our diligent focus on our Better Connected strategy leaves us confident in our ability to deliver long term returns for shareholders and value to our customers.”
– President and Chief Executive Officer, Greg Hicks
Highlights:
- Revenue was $3,707.2 million compared to $3,837.4 million in the same period last year; excluding the change in accounting estimate, Revenue (excluding Petroleum) decreased 4.9%. Financial Services segment revenue growth partially offset the Retail segment decline, mainly due to the anticipated lower revenue at Canadian Tire Retail.
- Consolidated income before income taxes was $66.6 million, a decrease of $228.3 million compared to the prior year, due in part to costs of $67.7 million relating to the distribution centre fire. Normalized income before income taxes was $134.3 million.
- Diluted EPS was $0.13 compared to $3.03 in the prior year; Normalized diluted EPS was $1.00, down $2.06, or down $2.72 excluding the $0.66 favourable impact of the change in accounting estimate2, mainly attributable to a decline in earnings in the Retail segment.
Outlook:
The $3.4 billion of strategic investments, announced in conjunction with the strategy, will create better customer experiences and deeper customer connections. These investments are being allocated to:
- Enhancing the omnichannel customer experience by better connecting digital and physical channels and rolling out a new “Concept Connect” to Canadian Tire stores;
- Strengthening supply chain fulfillment infrastructure and automation; and
- Modernizing IT infrastructure and driving efficiency in how CTC operates.
In conjunction with the announcement of its strategic plan, CTC also established the following financial aspirations for fiscal years 2022 to 2025:
- 4+ percent annual average comparable sales growth over the four-year period;
- Diluted EPS of $26.00+ by 2025; and
- Retail Return on Invested Capital (“ROIC”) of approximately 15+ percent by 2025.
Source: (CTC-A-T) Q1-2023 News Release
Algonquin Power & Utilities (AQN-N) drelease its first-quarter fiscal 2023 results on Thursday, May 11, 2023, before markets opened.
“In the first quarter of 2023, we achieved operational milestones in line with our targets. In our regulated business, we achieved an increased operating profit reflecting planned execution and constructive rate case outcomes. In our renewables business, we advanced our project pipeline and achieved overall financial performance consistent with our expectations.”
– President, Arun Banskota
Highlights:
- Termination of Acquisition of Kentucky Power Company on April 17, 2023.
- Adjusted EBITDA of $341.0 million, an increase of 3%;
- Adjusted Net Earnings of $119.9 million, a decrease of 15%; and
- Adjusted Net Earnings per common share of $0.17, a decrease of 19%, in each case on a year-over-year basis.
Outlook:
Reiterate Estimated 2023 Adjusted Net Earnings Per Common Share
- The Company reiterates its previously-disclosed estimate of Adjusted Net Earnings per common share for the 2023 fiscal year within a range of $0.55-$0.61.
Organic Capital Investment Expectations Maintained
- With the Kentucky Power Transaction Termination, the Company expects to spend approximately $1 billion on capital investment opportunities in the 2023 fiscal year. Of this amount, approximately $700 million is expected to be spent by the Regulated Services Group and approximately $300 million is expected to be spent by the Renewable Energy Group.
Remain Focused on Optimizing Balance Sheet
- The Company remains committed to a BBB credit rating and does not expect any new equity financings through 2024.
Source: (AQN-N) Q1-2023 News Release
Emera Inc. (EMA-T) released its first-quarter fiscal 2023 results on Friday, May 12, 2023, before markets opened.
“We are off to a solid start in 2023, continuing our track record of delivering for customers and providing predictable, reliable earnings growth for our shareholders. Across Emera, our teams are executing on a $3 billion capital plan in support of our strategy, focused on a responsible and balanced energy transition for our customers.”
– President and Chief Executive Officer, Scott Balfour
Highlights:
- Quarterly adjusted earnings per share (“EPS”) of $0.99 increased $0.07 or 8% compared to $0.92 in Q1 2022 resulting from higher marketing and trading margin at Emera Energy Services (“EES”) and higher earnings at New Mexico Gas Company (“NMGC”). This was partially offset by lower contributions from Tampa Electric Company (“TEC”) and Nova Scotia Power and higher interest expense throughout the business.
- Quarterly reported net income increased by $198 million to $560 million compared to $362 million in Q1 2022 and quarterly reported EPS increased by $0.69 to $2.07 from $1.38 in Q1 2022 primarily due to higher mark-to-market (“MTM”) gains at EES.
- The commissioning of the Labrador Island Link (“LIL”) in April was another important step in a transformative energy project that has already delivered more than one million megawatt hours of hydro energy over the Maritime Link and will continue to deliver clean, reliable energy to Nova Scotians for years to come.
Outlook:
There have been no material changes in Emera’s business overview and outlook from the Company’s 2022 annual MD&A.
Source: (EMA-T) Q1-2023 News Release
