Last updated by BM on March 13, 2023
Summary
- This is a weekly installment of our MP Market Review series, which provides updates on the financial markets and Canadian dividend growth companies we monitor on ‘The List’.
- Last week, ‘The List’ was down sharply with a YTD price return now of +2.0% (capital), while its dividend growth jumped to +7.3% YTD, highlighting growth in income over the past year.
- Last week, there were two dividend increases from companies on ‘The List’.
- Last week, there were two earnings reports from companies on ‘The List’.
- Three companies on ‘The List’ are due to report earnings this week.
- If you’re interested in creating your own income portfolio, consider subscribing to our premium service, which grants you access to the MP Wealth-Builder Model Portfolio (CDN) and exclusive subscriber-only content. Learn More

Introduction
“You have a pair of pants. In the left pocket, you have a $100. You take $1 out of the left pocket and put in the right pocket. You now have a $101. There is no diminution of dollars in your left pocket. That is one magic pair of pants.”
This ‘magic pants’ analogy was from a Seeking Alpha article on dividend investing I read about a decade ago and was one of the catalysts for me to take a closer look at this type of investing and see if it truly was magical.
After conducting additional research, I have shifted towards utilizing a dividend growth investing (DGI) strategy as my primary investment approach. While I maintain portfolios consisting of high-quality dividend growers from both the United States and Canada, I have opted to concentrate on Canadian (CDN) dividend growth companies in this blog. This is due to several reasons, including a smaller pool of DGI companies to track, a lack of coverage for the DGI strategy by Canadian investment media, and a tendency for those who do cover DGI to narrowly focus on only a handful of sectors (Energy and Financials).
While ‘The List’ is not a portfolio in itself, it serves as an excellent initial reference for individuals seeking to diversify their investments and attain higher returns in the Canadian stock market. Through our blog, we provide weekly updates on ‘The List’ and offer valuable perspectives and real-life examples of the dividend growth investing strategy in practice. This helps readers gain a deeper understanding of how to implement and benefit from this investment approach.
DGI Thoughts
“Every decade or so, dark clouds will fill the economic skies, and they will briefly rain gold. When downpours of that sort occur, it’s imperative that we rush outdoors carrying washtubs, not teaspoons.”
– Warren Buffett
In our blog, we frequently discuss the process of determining a reasonable price for investing in a quality company. One such approach is the utilization of ‘Dividend Yield Theory’.
IQT (Investment Quality Trends) popularized this theory in the 1960s, and it is straightforward and logical. Essentially, it suggests that for high-quality dividend growth stocks, which are characterized by consistent business models that don’t undergo significant changes over time, dividend yields have a tendency to return to their average.
What makes ‘Dividend Yield Theory’ easy to comprehend is that if the current yield surpasses the ‘historical yield’ (i.e., the average yield), then the stock is probably undervalued, whereas if it falls below the average yield, it is likely overvalued.
Here are the top ten firms on ‘The List,’ which are currently within a range of a ‘reasonable price’ using ‘Dividend Yield Theory’ alone for valuation purposes (as of last Friday’s market close).
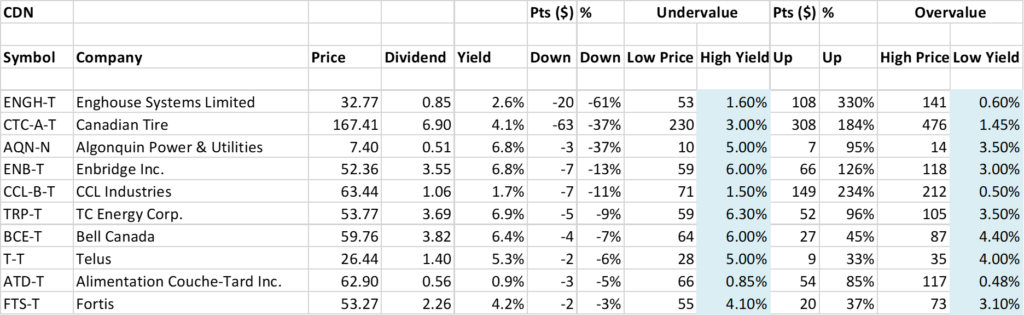
Source: magicpants.ca
I can’t recall a week in the past few years where I’ve seen so many high-quality companies on this list. If the current market decline continues, we may have to bring out our washtub!
Recent News
Bank of Canada maintains policy rate, continues quantitative tightening (Bank of Canada)
https://www.bankofcanada.ca/2023/03/fad-press-release-2023-03-08/
“Governing Council will continue to assess economic developments and the impact of past interest rate increases, and is prepared to increase the policy rate further if needed to return inflation to the 2% target.”
As expected, the Bank of Canada did not raise interest rates last week. As one of the first Central Banks to take this approach, Canada is betting that previous rate hikes will be enough to bring inflation down. They did, however keep the door open for further rate hikes if necessary.
Failure of Silicon Valley Bank stuns tech sector already reeling from downturn (Globe & Mail)
https://www.theglobeandmail.com/business/article-canada-silicon-valley-bank-impact/
“The shutdown of SVB stemmed from its decision in 2021 to pull back on lending and instead stash tens of billions into long-term, low-interest-rate mortgage-backed securities. But as interest rates rose, bond values fell, saddling SVB with a paper loss, which it crystalized when it was forced to sell some bonds for a US$1.8-billion loss.”
This sounded a bit like 2008 to many people, and we know what happened after that.
As of late Sunday night the U.S. Treasury, the Federal Reserve and the Federal Deposit Insurance Corp. said the government would back Silicon Valley Bank deposits beyond the federally insured ceiling of $250,000.
“Depositors will have access to all of their money starting Monday, March 13,” the agencies said in a joint statement Sunday evening. “No losses associated with the resolution of Silicon Valley Bank will be borne by the taxpayer.”
The List (2023)
Last updated by BM on March 10, 2023
The Magic Pants List contains 27 Canadian dividend growth stocks. ‘The List’ contains Canadian companies that have raised their dividend yearly for at least the last ten years and have a market cap of over a billion dollars. Provided below is each stock’s symbol, name, current yield, current price, price return year-to-date, current dividend, dividend growth year-to-date and current dividend growth streak. Companies on ‘The List’ are added or subtracted once a year, on January 1. After that, ‘The List’ is set for the next twelve months. Prices and dividends are updated weekly.
| SYMBOL | COMPANY | YLD | PRICE | YTD % | DIV | YTD % | STREAK |
|---|---|---|---|---|---|---|---|
| AQN-N | Algonquin Power & Utilities | 6.8% | $7.40 | 10.0% | $0.51 | -29.0% | 12 |
| ATD-T | Alimentation Couche-Tard Inc. | 0.9% | $62.90 | 4.6% | $0.56 | 19.1% | 13 |
| BCE-T | Bell Canada | 6.4% | $59.76 | -0.8% | $3.82 | 5.0% | 14 |
| BIP-N | Brookfield Infrastructure Partners | 4.4% | $32.08 | 5.2% | $1.44 | 6.3% | 15 |
| CCL-B-T | CCL Industries | 1.7% | $63.44 | 9.3% | $1.06 | 10.4% | 21 |
| CNR-T | Canadian National Railway | 2.0% | $159.71 | -1.9% | $3.16 | 7.8% | 27 |
| CTC-A-T | Canadian Tire | 4.1% | $167.41 | 14.2% | $6.90 | 17.9% | 12 |
| CU-T | Canadian Utilities Limited | 5.1% | $35.22 | -4.7% | $1.79 | 1.0% | 51 |
| DOL-T | Dollarama Inc. | 0.3% | $77.25 | -3.3% | $0.22 | 2.3% | 12 |
| EMA-T | Emera | 5.2% | $52.75 | 0.2% | $2.76 | 3.0% | 16 |
| ENB-T | Enbridge Inc. | 6.8% | $52.36 | -1.8% | $3.55 | 3.2% | 27 |
| ENGH-T | Enghouse Systems Limited | 2.6% | $32.77 | -8.2% | $0.85 | 18.2% | 16 |
| FNV-N | Franco Nevada | 1.0% | $130.44 | -5.6% | $1.36 | 6.3% | 15 |
| FTS-T | Fortis | 4.2% | $53.27 | -3.7% | $2.26 | 4.1% | 49 |
| IFC-T | Intact Financial | 2.3% | $190.11 | -2.9% | $4.40 | 10.0% | 18 |
| L-T | Loblaws | 1.4% | $115.58 | -3.9% | $1.62 | 5.2% | 11 |
| MGA-N | Magna | 3.5% | $52.51 | -8.7% | $1.84 | 2.2% | 13 |
| MRU-T | Metro | 1.8% | $68.65 | -9.0% | $1.21 | 10.0% | 28 |
| RY-T | Royal Bank of Canada | 4.0% | $133.11 | 4.0% | $5.28 | 6.5% | 12 |
| SJ-T | Stella-Jones Inc. | 1.7% | $55.27 | 11.5% | $0.92 | 15.0% | 18 |
| STN-T | Stantec Inc. | 1.0% | $78.44 | 20.1% | $0.77 | 8.5% | 11 |
| TD-T | TD Bank | 4.6% | $83.77 | -4.4% | $3.84 | 7.9% | 12 |
| TFII-N | TFI International | 1.2% | $121.27 | 21.1% | $1.40 | 29.6% | 12 |
| TIH-T | Toromont Industries | 1.5% | $108.95 | 11.5% | $1.68 | 10.5% | 33 |
| TRP-T | TC Energy Corp. | 6.9% | $53.77 | 0.9% | $3.69 | 3.4% | 22 |
| T-T | Telus | 5.3% | $26.44 | 0.5% | $1.40 | 5.4% | 19 |
| WCN-N | Waste Connections | 0.8% | $131.04 | -0.5% | $1.02 | 7.9% | 13 |
| Averages | 3.2% | 2.0% | 7.3% | 19 |
Six Canadian stocks on ‘The List’ declare earnings and dividends in US dollars and are inter-listed on a US exchange in US dollars. The simplest way to display dividend and price metrics for these stocks is to show their US exchange symbols along with their US dividends and price. The stocks I am referring to have a -N at the end of their symbols. You can still buy their Canadian counterparts (-T), but your dividends will be converted into CDN dollars and will fluctuate based on the exchange rate.
Note: When the currency of the dividend and share price match, the calculation is straightforward. But it’s not so simple when the dividend is declared in one currency and the share price is quoted in another. Dividing the former by the latter would produce a meaningless result because it’s a case of apples and oranges. To calculate the yield properly, you would need to express the dividend and share price in the same currency.
Performance of ‘The List’
Feel free to click on this link, ‘The List’ for a sortable version from our website.
Last week, ‘The List’ was down sharply with a YTD price return now of +2.0% (capital), while its dividend growth jumped to +7.3% YTD, highlighting growth in income over the past year.
The best performers last week on ‘The List’ were Stella-Jones Inc. (SJ-T), up +8.86%; Dollarama Inc. (DOL-T), up +0.39%; and Canadian Utilities Limited (CU-T), up +0.26%.
Enghouse Systems Limited (ENGH-T) was the worst performer last week, down -24.49%.
Dividend Increases
“The growth of dividend paying ability is of significance in the determination of a stock’s quality, or general safety…”
– Arnold Bernhard (the founder of Value Line)
“As a dividend increase is a positive sign of a company’s financial strength, the safest purchase, after research, is a stock with a recent dividend increase.”
– Tom Connolly (the founder of dividendgrowth.ca)
Last week, there were two dividend increases from companies on ‘The List’.
Stella-Jones Inc. (SJ-T) on Wednesday, March 8, 2023, said it increased its 2023 quarterly dividend from $0.20 to $0.23 per share, payable April 21, 2023, to shareholders of record on April 3, 2023.
This represents a dividend increase of +15.0%, marking the 19th straight year of dividend growth for this quality lumber and wood product manufacturer.
Enghouse Systems Limited (ENGH-T) on Thursday, March 9, 2023, said it increased its 2023 quarterly dividend from $0.185 to $0.22 per share, payable May 31, 2023, to shareholders of record on May 17, 2023.
This represents a dividend increase of +18.9%, marking the 17th straight year of dividend growth for this quality provider of software and services.
Earnings Releases
Benjamin Graham once remarked that earnings are the principal factor driving stock prices.
Each quarter we will provide readers with weekly earnings updates of stocks on ‘The List’ during the calendar earnings season. Q4 2022 will come to an end this week, and we are now seeing the beginning of the next earnings season with (ATD-T) reporting. Not all companies on ‘The List’ follow the calendar year schedule.
The updated earnings calendar can be found here.
Earnings growth and dividend growth tend to go hand in hand, so this information can tell us a lot about the future dividend growth of our quality companies. Monitoring our dividend growers periodically is part of the process, and reading the quarterly earnings releases is a good place to start.
Three companies on ‘The List’ are due to report earnings this week.
Franco Nevada (FNV-N) will release its fourth-quarter 2022 results on Wednesday, March 15, 2023, after markets close.
Alimentation Couche-Tard Inc. (ATD-T) will release its third-quarter 2023 results on Wednesday, March 15, 2023, after markets close.
Algonquin Power & Utilities (AQN-N) will release its fourth-quarter 2022 results on Friday, March 17, 2023, before markets open.
Last week, two companies on ‘The List’, reported their earnings.
Stella-Jones Inc. (SJ-T) released its fourth-quarter 2022 results on Wednesday, March 8, 2023, before markets opened.
“Stella-Jones concluded 2022 on a very strong note, and I am proud of the robust performance we delivered as a Company. Our fourth quarter sales continued their upward trajectory, reflecting more than a 25% organic increase in utility poles sales, sustained growth in railway ties sales and better than anticipated residential lumber sales. Our exceptional results in 2022 can be credited to several contributors, from the efforts of our dedicated team to our expansive North American network. In a year of challenging market and macroeconomic conditions, our proven ability to procure the fibre required to meet customer demand and pass through cost increases were true keystones of our success, and a testament to the resilient character of our business model.”
– President and Chief Executive Officer, Eric Vachon
Highlights:
- Sales of $3,065 million, up 11%, driven by infrastructure-related product category sales
- EBITDA up 12% to $448 million, from $400 million in 2021
- Net income reached $241 million, or $3.93 per share
- Acquired wood utility pole manufacturing business of Texas Electric Cooperatives, Inc.
- Quarterly cash dividend increased 15% to $0.23 per share
Outlook:
“2022 marks a 22nd consecutive year of increased sales for Stella-Jones and the completion of the first year of our three-year plan, marked by exceptional utility poles sales growth, which we expect will continue in 2023. From where we stand, we are well on our way to meet or exceed our objectives, and remain favourably positioned for the future, with continued growth in sales, profitability and in turn, shareholder value.”
– President and Chief Executive Officer, Eric Vachon

Source: (SJ-T) Q4-2022 Earnings Release
Enghouse Systems Limited (ENGH-T) released its first-quarter 2023 results on Thursday, March 9, 2023, after markets closed.
“Over the last four quarters, revenue in both the Asset and Interactive Management Groups has stabilized significantly, particularly in comparison to the revenue fluctuations that were driven by changing demands throughout the COVID-19 pandemic. Despite the ongoing shift to the cloud, inflation, rising interest rates, economic uncertainty and some competitors experiencing significant financial distress announcing restructuring and employee layoffs, Enghouse continues to operate consistently with positive income and operating cashflows. Enghouse remains well positioned to complete and fund future acquisitions. Subsequent to quarter end, we announced the acquisitions of Qumu and Navita with integrations progressing according to plan.”
– Stephen J. Sadler, Chairman and Chief Executive Officer
Highlights:
- Revenue achieved was $106.4 million compared to revenue of $111.1 million;
- Results from operating activities was $29.9 million compared to $35.7 million;
- Net income was $17.0 million compared to $21.6 million;
- Adjusted EBITDA was $32.3 million compared to $38.6 million;
- Cash flows from operating activities excluding changes in working capital were $32.6 million compared to $38.7 million.
Outlook:
Enghouse remains focused on its long-term growth strategy, investing in products while ensuring profitability and maximizing operating cashflows. As a result, Enghouse continues to replenish its acquisition capital while annually increasing its eligible quarterly dividend.
