Last updated by BM on July 25, 2022
Summary
- This article is part of our weekly series (MP Market Review) highlighting the performance and activity from the previous week related to the financial markets and Canadian dividend growth companies we follow on ‘The List’.
- Last week, ‘The List’ was up a couple of percentage points with a minus -3.7% YTD price return (capital). Dividend growth of ‘The List’ remains at 10.2% YTD, demonstrating the rise in income over the last year.
- Last week, there were no dividend increases from companies on ‘The List’.
- Last week, there were no earnings reports from companies on ‘The List’.
- Eight companies on ‘The List’ are due to report earnings this week.
- Are you looking for a portfolio of ideas like these? Magic Pants DGI Premium Membership Subscribers get exclusive access to the MP Wealth-Builder Model Portfolio (CDN). Learn More
“Compare the compound annual growth rate (CAGR) of a firm’s dividend with its price after a few years. They should be similar: if not, do not buy, or if you own it, winnow it.”
– Tom Connolly
We quote Tom Connolly quite a bit in our blog. Connolly is not widely known to most investors, but he is one of the reasons we started looking into dividend growth investing years ago.
Our income from ‘The List’ continues to outpace inflation this year, with more increases expected in 2022. You can see from the summary above that our capital is holding up well compared to the overall market too. We like to see, at a minimum, both our portfolio income and capital double over the course of a decade. We use the Rule of 72 to estimate our timeline and ensure we are on track.
“The Rule of 72 is a mathematical principle that estimates the time it will take for an investment to double in value. Simply take the number 72 and divide it by the rate of return on your investments each year to get the number of years it will take for your investments to grow 100%.”
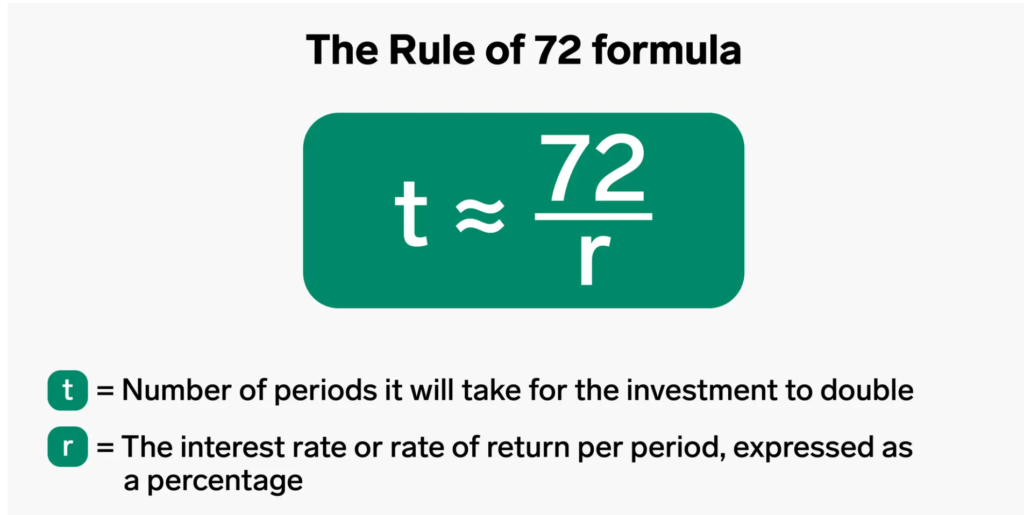
This formula only works with investments that compound. Average 7.2 % dividend growth (reinvested yearly) means it will take ten years to double your income. At 10.2% (this year’s dividend growth of ‘The List’), it will take ~ seven years to double.
Performance of ‘The List’
Last week, ‘The List’ was up a couple of percentage points with a minus -3.7% YTD price return (capital). Dividend growth of ‘The List’ remains at 10.2% YTD, demonstrating the rise in income over the last year.
The best performers last week on ‘The List’ were Stella-Jones Inc. (SJ-T), up 9.41%; Magna (MGA-N), up 9.17%; and Enghouse Systems Limited (ENGH-T), up 6.95%.
Intact Financial (IFC-T) was the worst performer last week, down -2.31%.
Recent News
Franco-Nevada Announces $352.5 Million Financing Package with G Mining Ventures on the Tocantinzinho Gold Project (Franco-Nevada website)
“We are delighted to support G Mining Ventures with this construction financing package,” said Paul Brink, President & CEO of Franco-Nevada. “Tocantinzinho is an attractive project in a prolific district and located in a good jurisdiction. The G Mining Ventures team has a track-record as one of the most capable mine building teams in the industry. As a stream financing partner we seek, through our financing and our involvement in projects, to help mine developers raise their full financial package on attractive terms. We are pleased to provide stream and debt financing to G Mining Ventures and along with two other strong strategic investors, La Mancha and Eldorado, to provide an equity component to fully finance the planned mine build.”
Highlights include:
Near-term gold contribution: Based on expected mine performance, full year contributions from the project are expected to average approximately 24,500 GEOs per year over the first 5 years of full production. That equates to over $42 million per year at today’s prices. Mine is expected to begin production in 2024.
Fully financed package: Franco-Nevada is providing $352.5 million of a total $481 million fully committed financing package. Putting its excess cash on hand to good use.
Exploration and expansion potential: The Stream is referenced to production from the entire Tocantinzinho land package currently covering approximately 996 km2. In addition to the planned project, the land position includes a number of regional targets and prospects.
Markets are falling, but my dividends keep going up (Globe & Mail)
“Some people celebrate Canada Day by wearing red and white or heading out to watch the fireworks. I like to express my patriotism by adding up all the dividend increases from the Canadian companies in my model Yield Hog Dividend Growth Portfolio.” John Heinzl
If you are looking for other examples of dividend growth investing (DGI) at work, you could follow John Heinzl and his ‘Yield Hog Dividend Growth Portfolio’ in the Globe & Mail.
John does a good job at explaining DGI concepts and benefits but strays a little from our concentrated, high-quality, and non-cyclical approach. John includes REITs and ETFs in his portfolio.
Eight companies on ‘The List’ are due to report earnings this week.
Canadian National Railway (CNR-T) will release its second-quarter 2022 results on Tuesday, July 26, 2022, after markets close.
Toromont Industries (TIH-T) will release its second-quarter 2022 results on Tuesday, July 26, 2022, after markets close.
Loblaws (L-T) will release its second-quarter 2022 results on Wednesday, July 27, 2022, before markets open.
Canadian Utilities Limited (CU-T) will release its second-quarter 2022 results on Thursday, July 28, 2022, before markets open.
TC Energy (TRP-T) will release its second-quarter 2022 results on Thursday, July 28, 2022, before markets open.
Fortis (FTS-T) will release its second-quarter 2022 results on Thursday, July 28, 2022, before markets open.
TFI International (TFII-N) will release its second-quarter 2022 results on Thursday, July 28, 2022, after markets close.
Enbridge (ENB-T) will release its second-quarter 2022 results on Friday, July 29, 2022, before markets open.
Dividend Increases
Last week, there were no dividend increases from companies on ‘The List’.
Earnings Releases
Last week, there were no earnings reports from companies on ‘The List’.
Below is a snapshot of ‘The List’ from last Friday’s close. For a sortable version of ‘The List’, please click on The List menu item.
‘The List’ is not meant to be a template for investors to copy exactly. Instead, its purpose is to provide investment ideas and a real-time illustration of dividend growth investing in action. It is not a ‘Buy List’ nor does it reflect the composition or returns of our Magic Pants Wealth-Builder (CDN) Portfolio. It is only a starting point for our analysis and discussion.
The List (2022)
Last updated by BM on July 22, 2022
*Note: The following graph is wide, you can scroll to the right on your device to see more of the data.
| SYMBOL | COMPANY | YLD | PRICE | YTD % | DIV | YTD % | STREAK |
|---|---|---|---|---|---|---|---|
| AQN-N | Algonquin Power & Utilities | 5.3% | $13.38 | -6.8% | $0.70 | 5.4% | 11 |
| ATD-T | Alimentation Couche-Tard Inc. | 0.8% | $53.71 | 3.1% | $0.44 | 18.1% | 12 |
| BCE-T | Bell Canada | 5.7% | $63.39 | -3.8% | $3.64 | 4.0% | 13 |
| BIP-N | Brookfield Infrastructure Partners | 3.7% | $38.94 | -4.4% | $1.44 | 5.9% | 14 |
| CCL-B-T | CCL Industries | 1.5% | $63.78 | -5.9% | $0.96 | 14.3% | 20 |
| CNR-T | Canadian National Railway | 2.0% | $149.27 | -3.6% | $2.93 | 19.1% | 26 |
| CTC-A-T | Canadian Tire | 3.4% | $170.83 | -6.7% | $5.85 | 24.5% | 11 |
| CU-T | Canadian Utilities Limited | 4.5% | $39.68 | 8.4% | $1.78 | 1.0% | 50 |
| DOL-T | Dollarama Inc. | 0.3% | $77.00 | 21.4% | $0.22 | 9.2% | 11 |
| EMA-T | Emera | 4.4% | $60.22 | -3.8% | $2.65 | 2.9% | 15 |
| ENB-T | Enbridge Inc. | 6.2% | $55.41 | 11.8% | $3.44 | 3.0% | 26 |
| ENGH-T | Enghouse Systems Limited | 2.3% | $31.41 | -31.5% | $0.72 | 16.3% | 15 |
| FNV-N | Franco Nevada | 1.0% | $124.71 | -8.4% | $1.28 | 10.3% | 14 |
| FTS-T | Fortis | 3.6% | $60.10 | -0.6% | $2.14 | 2.9% | 48 |
| IFC-T | Intact Financial | 2.2% | $178.30 | 8.9% | $4.00 | 17.6% | 17 |
| L-T | Loblaws | 1.3% | $119.38 | 16.2% | $1.54 | 12.4% | 10 |
| MGA-N | Magna | 2.9% | $61.05 | -25.2% | $1.80 | 4.7% | 12 |
| MRU-T | Metro | 1.6% | $69.65 | 3.9% | $1.10 | 12.2% | 27 |
| RY-T | Royal Bank of Canada | 4.0% | $123.62 | -9.7% | $4.96 | 14.8% | 11 |
| SJ-T | Stella-Jones Inc. | 2.2% | $35.91 | -11.7% | $0.80 | 11.1% | 17 |
| STN-T | Stantec Inc. | 1.2% | $60.42 | -13.9% | $0.71 | 6.8% | 10 |
| TD-T | TD Bank | 4.3% | $82.03 | -17.4% | $3.56 | 12.7% | 11 |
| TFII-N | TFI International | 1.2% | $90.24 | -18.5% | $1.08 | 12.5% | 11 |
| TIH-T | Toromont Industries | 1.4% | $106.28 | -6.5% | $1.52 | 15.2% | 32 |
| TRP-T | TC Energy Corp. | 5.2% | $68.63 | 14.9% | $3.57 | 4.4% | 21 |
| T-T | Telus | 4.6% | $28.90 | -2.9% | $1.33 | 6.2% | 18 |
| WCN-N | Waste Connections | 0.7% | $126.26 | -5.8% | $0.92 | 8.9% | 12 |
| Averages | 2.9% | -3.7% | 10.2% | 18 |
