Last updated by BM on January 13, 2026
Summary
Welcome to this week’s MP Market Review – your go-to source for insights and updates on the Canadian dividend growth companies we track on The List! While we’ve expanded our watchlists to include U.S. companies The List-USA, our Canadian lineup remains the cornerstone of our coaching approach.
Don’t miss out on exclusive newsletters and premium content that will help you sharpen your investing strategy. Explore it all at magicpants.substack.com.
Your journey to dividend growth mastery starts here – let’s dive in!
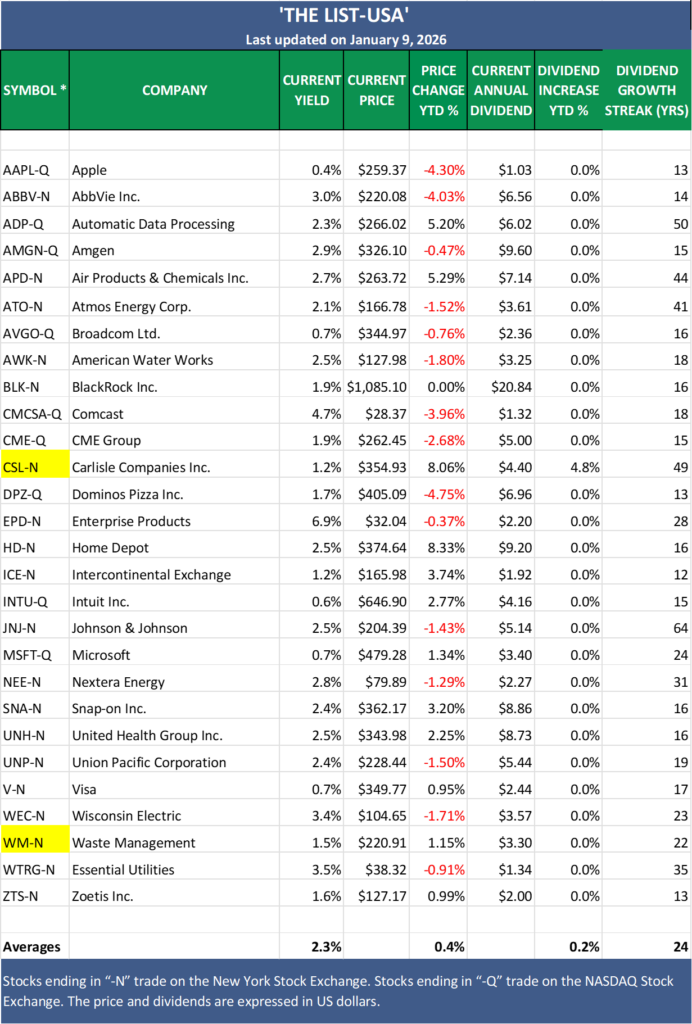
This week, we introduce our 2026 version of ‘The List-USA’. Our curated watchlist of American dividend growth companies.
Below is a summary of the metrics and activity from our Canadian watchlist which we track each week in our newsletter.
- Dividend growth of The List is up with an average year-to-date return of +1.5% (income).
- The price of The List is up with an average year-to-date return of +0.6% (capital).
- Last week, no company on The List made a dividend announcement.
- Last week, no company on The List released an earnings report.
- This week, no company from The List will report their earnings.
DGI Clipboard
“If you look for companies that can raise their dividends year after year without milking operations, you will automatically be lead to high quality stocks.”
– Edmund Faltermayer, Fortune magazine, October 1990
Boring. Predictable. Profitable. Our 2026 American Dividend Growth Watchlist.

Intro
January is the most dangerous month of the year for investors.
Everyone gets a psychological reset. Last year’s bad decisions are erased. Confidence is restored. And once again, investors convince themselves that this is the year they will predict the market correctly.
If they get lucky, they celebrate.
If they are wrong, they blame the market.
I know this cycle well because I lived it.
The problem is simple. You never know whether you were smart or just lucky until it no longer matters. By the time the truth shows up, the opportunity is gone and the lesson is expensive.
This is why dividend growth investing (DGI) exists.
I can say with conviction today that your income will be higher at the end of this year than it is right now. Not because I know where the market is going, but because the businesses we own are designed to raise cash payouts year after year. A 7 to 10 percent income increase is not a guess. It is the probable outcome of owning quality companies that grow dividends.
Over a full market cycle, portfolio value follows income higher. Not through prediction. Through discipline.
That is not exciting.
It is effective.
Powerful dividend growth portfolios are built from a good watchlist. Closely tracking every stock in the dividend growth universe is neither practical nor necessary, so we curate a focused list of high-quality companies and monitor it weekly. When valuations become compelling, we act.
Last week, we released the Canadian version of The List. This week, it’s our neighbors to the south.
Our American watchlist is called The List (USA). While it is published on this blog only once per month, it is monitored continuously alongside our weekly Canadian watchlist. Paid subscribers receive the same DGI alerts when we trade, at roughly the same pace as our Canadian alerts.
With far more dividend growth companies available in the U.S. market, curating this list is more demanding. Still, our approach remains consistent. We do not make changes for the sake of activity. Quality businesses tend to remain quality businesses. Every company on last year’s American watchlist increased its dividend in 2025.
Changes to the 2026 American Watchlist
For 2026, United Parcel Service, Lockheed Martin, and Starbucks have been removed from the watchlist.
They have been replaced by Waste Management and Carlisle Companies Inc.
These additions strengthen the overall dividend growth profile of the list, improve long-term income metrics, and increase the probability of attractive capital returns within our portfolios.
Introducing the 2026 American Dividend Growth Watchlist (The List-USA):
Takeaway
Both the Canadian and American watchlists are now locked in. With a deep bench of high-quality companies to choose from, I am optimistic about what the market will offer this year. Our focus remains unchanged: building a steadily growing income stream in the short term, and a powerful accumulation of capital over a full investing cycle.
Become a paid partner, and I’ll show you exactly how I do it. With real money. In real stocks. In addition, gain full access to this post and exclusive, subscriber-only content. We do the work; you stay in control. Subscribe today and take your dividend growth investing to the next level!
DGI Scorecard
The Magic Pants 2026 list (The List) includes 26 Canadian dividend growth stocks and our new American watchlist (The List-USA) contains 28 companies. Here are the criteria to be considered a candidate on our watchlists:
- Dividend growth streak: 10 years or more.
- Market cap: Minimum one billion dollars.
- Diversification: Limit of five companies per sector, preferably two per industry.
- Cyclicality: Exclude REITs and pure-play energy companies due to high cyclicality.
Based on these criteria, companies are added or removed from ‘The List’ annually on January 1. Prices and dividends are updated weekly.
‘The List’ is not a portfolio but a coaching tool that helps us think about ideas and risk manage our model portfolio. We own some but not all the companies on ‘The List’. In other words, we might want to buy these companies when valuation looks attractive.
Our newsletter provides readers with a comprehensive insight into the implementation and advantages of our Canadian dividend growth investing strategy. This evidence-based, unbiased approach empowers DIY investors to outperform both actively managed dividend funds and passively managed indexes and dividend ETFs over longer-term horizons.
Performance of ‘The List’
Dividend growth of The List starts the year with an average return of +1.5% (income). These are dividends already announced for 2026.
The price of The List begins the year with an average return of +0.6% (capital).
Top Performers Last Week:
- Franco Nevada (FNV-N), up +9.68%.
- goeasy Ltd. (GSY-T), up +5.52%
- Manulife Financial (MFC-T) up +4.42%.
Worst Performer Last Week:
- Canadian Natural Resources (CNQ-T) down -5.31%.
| SYMBOL | COMPANY | YLD | PRICE | YTD % | DIV | YTD % | STREAK |
|---|---|---|---|---|---|---|---|
| ATD-T | Alimentation Couche-Tard Inc. | 1.1% | $74.80 | -0.99% | $0.86 | 4.9% | 16 |
| BIP-N | Brookfield Infrastructure Partners | 5.1% | $33.64 | -1.92% | $1.72 | 0.0% | 19 |
| CCL-B-T | CCL Industries Inc. | 1.4% | $88.62 | 1.08% | $1.28 | 0.0% | 24 |
| CNQ-T | Canadian Natural Resources | 5.3% | $44.62 | -5.31% | $2.35 | 1.1% | 25 |
| CNR-T | Canadian National Railway | 2.6% | $137.69 | -0.07% | $3.55 | 0.0% | 30 |
| CTC-A-T | Canadian Tire | 4.0% | $176.41 | 0.64% | $7.10 | 1.4% | 15 |
| DOL-T | Dollarama Inc. | 0.2% | $199.31 | -3.33% | $0.42 | 0.8% | 15 |
| EMA-T | Emera | 4.3% | $67.99 | 0.58% | $2.92 | 0.0% | 19 |
| ENB-T | Enbridge Inc. | 6.1% | $63.54 | -3.81% | $3.88 | 2.9% | 30 |
| FNV-N | Franco Nevada | 0.7% | $228.77 | 9.68% | $1.52 | 0.0% | 18 |
| FTS-T | Fortis Inc. | 3.6% | $71.63 | 0.53% | $2.56 | 3.0% | 52 |
| GSY-T | goeasy Ltd. | 4.2% | $138.72 | 5.52% | $5.84 | 0.0% | 11 |
| IFC-T | Intact Financial | 1.9% | $278.78 | -2.24% | $5.32 | 0.0% | 21 |
| L-T | Loblaw Companies Limited | 0.9% | $61.84 | -0.40% | $0.56 | 2.1% | 14 |
| MFC-T | Manulife Financial | 3.4% | $52.00 | 4.42% | $1.76 | 0.0% | 12 |
| MGA-N | Magna | 3.5% | $56.21 | 2.84% | $1.94 | 0.0% | 16 |
| MRU-T | Metro Inc. | 1.5% | $98.37 | -0.65% | $1.48 | 0.0% | 31 |
| RY-T | Royal Bank of Canada | 2.8% | $235.52 | 0.40% | $6.56 | 8.6% | 15 |
| SJ-T | Stella-Jones Inc. | 1.4% | $88.81 | 3.15% | $1.24 | 0.0% | 21 |
| STN-T | Stantec Inc. | 0.6% | $136.81 | 3.59% | $0.89 | 0.0% | 14 |
| TD-T | TD Bank | 3.3% | $131.17 | 1.04% | $4.32 | 2.9% | 15 |
| TFII-N | TFI International | 1.7% | $110.89 | 4.04% | $1.88 | 4.4% | 15 |
| TIH-T | Toromont Industries | 1.2% | $171.40 | 2.14% | $2.08 | 0.0% | 36 |
| TRI-Q | Thomson Reuters | 1.8% | $129.23 | 2.27% | $2.38 | 0.0% | 32 |
| TRP-T | TC Energy Corp. | 4.5% | $74.90 | -2.54% | $3.40 | 0.0% | 25 |
| WCN-N | Waste Connections | 0.8% | $166.31 | -4.49% | $1.40 | 8.1% | 16 |
| Averages | 2.6% | 0.6% | 1.5% | 21 |
Note: Stocks ending in “-N or -Q” declare earnings and dividends in US dollars. To achieve currency consistency between dividends and share price for these stocks, we have shown dividends in US dollars and share price in US dollars (these stocks are listed on a US exchange). The dividends for their Canadian counterparts (-T) would be converted into CDN dollars and would fluctuate with the exchange rate.
PAID subscribers enjoy full access to our enhanced weekly newsletter, premium content, and easy-to-follow trade alerts so they can build DGI portfolios alongside ours. This service provides the resources to develop your DGI business plan confidently. We do the work; you stay in control!
It truly is the subscription that pays dividends!
The greatest investment you can make is in yourself. Are you ready to take that step?
For more articles and the full newsletter, check us out on magicpants.substack.com.
