Last updated by BM on February 4, 2025
Summary
Welcome to this week’s MP Market Review – your go-to source for insights and updates on the Canadian dividend growth companies we track on ‘The List’! While we’ve expanded our watchlists to include U.S. companies (The List-USA), our Canadian lineup remains the cornerstone of our coaching approach.
Don’t miss out on exclusive newsletters and premium content that will help you sharpen your investing strategy. Explore it all at magicpants.substack.com.
Your journey to dividend growth mastery starts here – let’s dive in!
- Last week, dividend growth was up, with an average return of +3.3% YTD (income).
- Last week, the price of ‘The List’ was down from the previous week with an average return of +1.65% YTD (capital).
- Last week, there were four dividend announcements made by companies on ‘The List’.
- Last week, there were three earnings reports from companies on ‘The List’.
- This week, two companies on ‘The List’ are due to report earnings.
DGI Clipboard
“It is impossible to produce superior performance unless you do something different from the majority.”
-Sir John Templeton
Investing $1,000,000 and Living Off Dividends Forever

Intro
Before discovering dividend growth investing (DGI), I constantly worried about outliving my capital in retirement.
What if I lived well into my 90s? How would I cover unpredictable healthcare costs? How can I help my kids buy their first home? What will inflation do to my retirement savings? Questions like these kept me up at night—and they’re the same fears that force many people to work into their 60s and 70s, cutting short the years when they could truly enjoy an active retirement.
Thankfully, everything changed when I found DGI. It gave me the confidence and financial security to retire years earlier than I ever imagined.
Our dividend growth investing strategy is highly adaptable, designed to meet the unique needs of investors regardless of age or starting capital. Whether you’re starting with modest savings or managing a significant portfolio, we can tailor the approach to align with your financial goals.
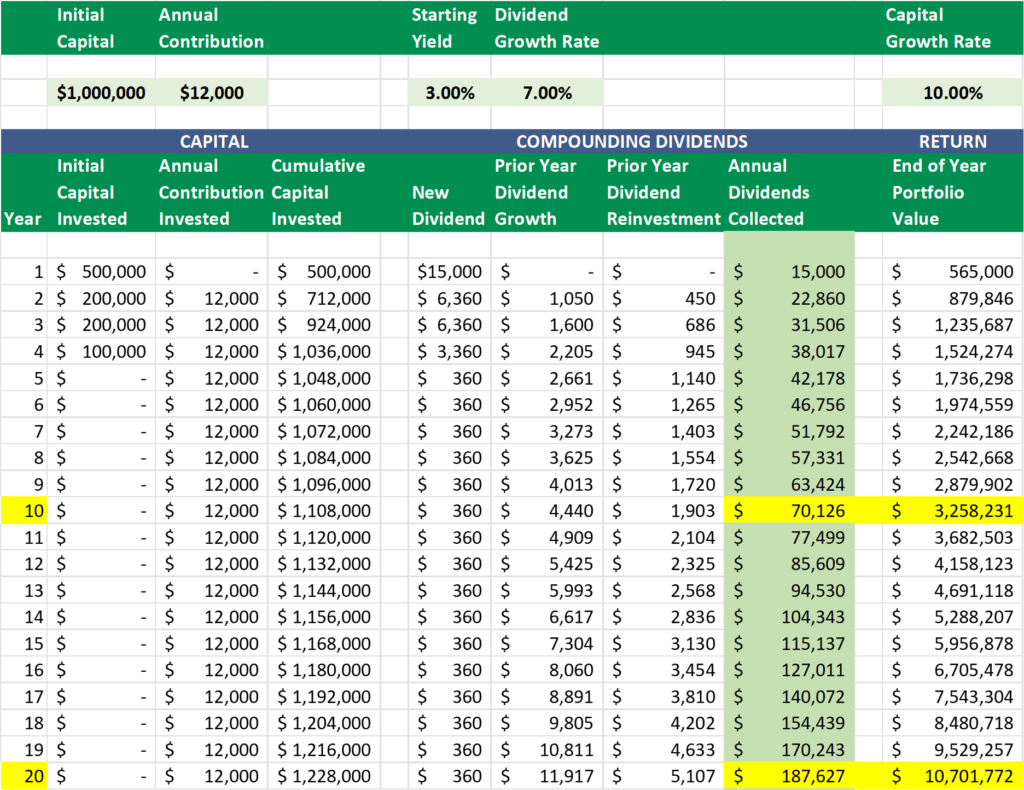
For example, instead of the $100,000 model portfolio we used for illustrative purposes last week, let’s consider a more ambitious scenario for our older subscribers: a $1,000,000 initial investment with 10+ years until retirement.
Take a look at the last two highlighted columns on the spreadsheet—Annual Dividends Collected and End of Year Portfolio Value—to see how powerful DGI can be in both generating income and growing capital over time.
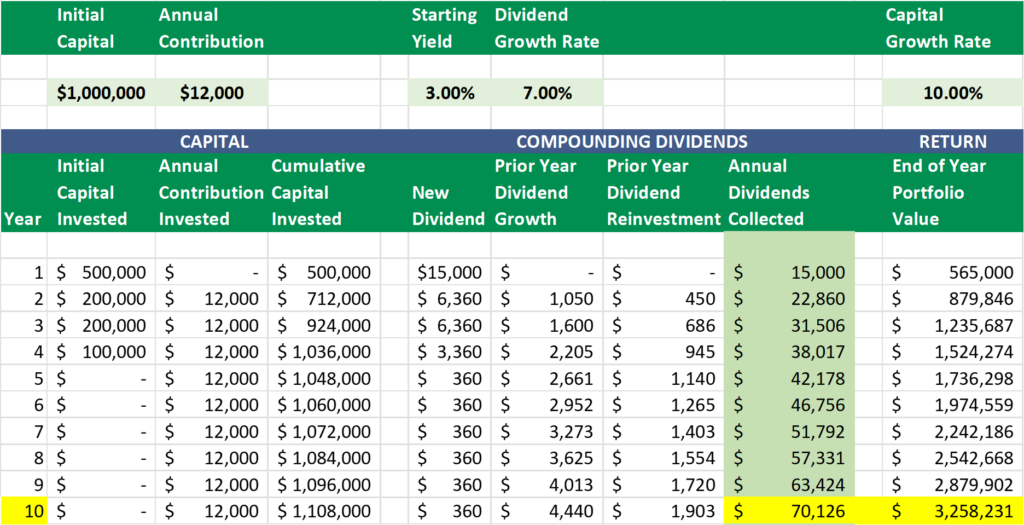
Imagine investing $1,000,000 over four years following our strategic dividend growth plan.
Projections show that within just ten years, you could generate over $70,126 in annual income, with your portfolio growing to exceed $3,000,000 in value. These results assume reinvested dividends and modest additional contributions of just $1,000 per month starting in the second year.
Add in your government pension, and you may never need to sell another stock or investment to cover your living expenses. Of course, the flexibility is always there—you can choose to sell a portion of your capital to fund a dream vacation, help your kids buy their first home, or support any other life goals.
The best part? Your income and capital don’t just stay steady—they continue to grow, allowing you to become even wealthier as your retirement progresses.
And if your retirement horizon stretches to 20 years, the compounding power of dividend growth becomes even more extraordinary. That’s the true magic of this strategy.
No matter your financial situation, dividend growth investing (DGI) can provide a reliable, inflation-protected income—without the need to liquidate your capital during retirement.
This approach allows your portfolio to generate a growing income stream, giving you peace of mind as you enjoy your retirement years.
Note: All income projections assume dividends are reinvested into high-quality, individual dividend growth stocks with an initial yield of 3% and annual dividend growth of 7%. These targets are easily achievable with companies from The List—our curated selection of top dividend growth stocks featured on the blog.
Wrap Up
What sets our strategy apart is its focus on creating growing income, year after year—even throughout retirement. Unlike traditional fixed-income investments that lose purchasing power over time, our approach helps your income grow, safeguarding your financial security and ensuring you thrive well into the future.
For a more guided approach, when building your DGI portfolio consider becoming a PAID subscriber to unlock access to DGI Alerts. These alerts notify you whenever we make a trade in our model portfolios, allowing you to invest alongside us with confidence. We do the work, and you stay in control!
DGI Scorecard
The List (2025)
The Magic Pants 2025 list includes 29 Canadian dividend growth stocks. Here are the criteria to be considered a candidate on ‘The List’:
- Dividend growth streak: 10 years or more.
- Market cap: Minimum one billion dollars.
- Diversification: Limit of five companies per sector, preferably two per industry.
- Cyclicality: Exclude REITs and pure-play energy companies due to high cyclicality.
Based on these criteria, companies are added or removed from ‘The List’ annually on January 1. Prices and dividends are updated weekly.
‘The List’ is not a portfolio but a coaching tool that helps us think about ideas and risk manage our model portfolio. We own some but not all the companies on ‘The List’. In other words, we might want to buy these companies when valuation looks attractive.
Our newsletter provides readers with a comprehensive insight into the implementation and advantages of our Canadian dividend growth investing strategy. This evidence-based, unbiased approach empowers DIY investors to outperform both actively managed dividend funds and passively managed indexes and dividend ETFs over longer-term horizons.
For those interested in something more, please upgrade to a paid subscriber; you get the enhanced weekly newsletter, access to premium content, full privileges on the new Substack website magicpants.substack.com and DGI alerts whenever we make stock transactions in our model portfolio.
Performance of ‘The List’
Last week, dividend growth was up, with an average return of +3.3% YTD (income).
Last week, the price of ‘The List’ was down from the previous week with an average return of +1.65% YTD (capital).
Even though prices may fluctuate, the dependable growth in our income does not. Stay the course. You will be happy you did.
Last week’s best performers on ‘The List’ were Franco Nevada (FNV-N), up +4.57%; Telus (T-T), up +4.0%; and Waste Connections (WCN-N), up +3.41%.
goeasy Ltd. (GSY-T) was the worst performer last week, down -8.28%.
| SYMBOL | COMPANY | YLD | PRICE | YTD % | DIV | YTD % | STREAK |
|---|---|---|---|---|---|---|---|
| ATD-T | Alimentation Couche-Tard Inc. | 1.0% | $76.75 | -2.91% | $0.78 | 8.3% | 15 |
| BCE-T | Bell Canada | 11.5% | $34.61 | 3.25% | $3.99 | 0.0% | 16 |
| BIP-N | Brookfield Infrastructure Partners | 5.2% | $32.81 | 2.98% | $1.72 | 6.2% | 17 |
| CCL-B-T | CCL Industries Inc. | 1.6% | $72.19 | -1.94% | $1.16 | 0.0% | 23 |
| CNR-T | Canadian National Railway | 2.3% | $151.82 | 3.43% | $3.55 | 5.0% | 29 |
| CTC-A-T | Canadian Tire | 4.3% | $163.62 | 6.45% | $7.10 | 1.4% | 14 |
| CU-T | Canadian Utilities Limited | 5.4% | $33.95 | -2.39% | $1.83 | 1.0% | 53 |
| DOL-T | Dollarama Inc. | 0.3% | $137.53 | -1.90% | $0.37 | 5.1% | 14 |
| EMA-T | Emera | 5.3% | $55.22 | 3.16% | $2.90 | 0.7% | 18 |
| ENB-T | Enbridge Inc. | 6.0% | $62.85 | 1.58% | $3.77 | 3.0% | 29 |
| ENGH-T | Enghouse Systems Limited | 3.8% | $27.59 | 1.96% | $1.04 | 4.0% | 18 |
| FNV-N | Franco Nevada | 1.1% | $135.96 | 12.24% | $1.52 | 5.6% | 17 |
| FTS-T | Fortis Inc. | 4.0% | $61.90 | 3.82% | $2.46 | 3.1% | 51 |
| GSY-T | goeasy Ltd. | 2.6% | $176.93 | 5.84% | $4.68 | 0.0% | 10 |
| IFC-T | Intact Financial | 1.9% | $258.15 | -1.83% | $4.84 | 0.0% | 20 |
| L-T | Loblaw Companies Limited | 1.1% | $181.98 | -4.33% | $2.05 | 7.0% | 13 |
| MFC-T | Manulife Financial | 3.7% | $43.46 | -1.09% | $1.60 | 0.0% | 11 |
| MGA-N | Magna | 4.8% | $39.67 | -4.96% | $1.90 | 0.0% | 15 |
| MRU-T | Metro Inc. | 1.6% | $90.81 | 0.71% | $1.48 | 10.4% | 30 |
| RY-T | Royal Bank of Canada | 3.3% | $177.18 | 2.85% | $5.92 | 3.5% | 14 |
| SJ-T | Stella-Jones Inc. | 1.6% | $70.13 | -3.92% | $1.12 | 0.0% | 20 |
| STN-T | Stantec Inc. | 0.7% | $112.47 | -0.57% | $0.84 | 1.8% | 13 |
| T-T | Telus | 7.6% | $21.08 | 7.39% | $1.61 | 5.2% | 21 |
| TD-T | TD Bank | 5.1% | $82.91 | 8.38% | $4.20 | 2.9% | 14 |
| TFII-N | TFI International | 1.4% | $131.81 | -0.60% | $1.80 | 12.5% | 14 |
| TIH-T | Toromont Industries | 1.7% | $115.89 | 2.47% | $1.92 | 0.0% | 35 |
| TRI-N | Thomson Reuters | 1.3% | $168.25 | 3.61% | $2.16 | 0.0% | 31 |
| TRP-T | TC Energy Corp. | 5.0% | $65.49 | -4.00% | $3.29 | 0.0% | 24 |
| WCN-N | Waste Connections | 0.7% | $183.77 | 8.16% | $1.26 | 7.7% | 15 |
| Averages | 3.3% | 1.65% | 3.3% | 21 |
Note: Stocks ending in “-N” declare earnings and dividends in US dollars. To achieve currency consistency between dividends and share price for these stocks, we have shown dividends in US dollars and share price in US dollars (these stocks are listed on a US exchange). The dividends for their Canadian counterparts (-T) would be converted into CDN dollars and would fluctuate with the exchange rate.
PAID subscribers enjoy full access to our enhanced weekly newsletter, premium content, and easy-to-follow trade alerts so they can build DGI portfolios alongside ours. This service provides the resources to develop your DGI business plan confidently. We do the work; you stay in control!
It truly is the subscription that pays dividends!
The greatest investment you can make is in yourself. Are you ready to take that step?
For more articles and the full newsletter, check us out on magicpants.substack.com.
