Last updated by BM on January 21, 2025
Summary
Welcome to this week’s MP Market Review – your go-to source for insights and updates on the Canadian dividend growth companies we track on ‘The List’! While we’ve expanded our watchlists to include U.S. companies (The List-USA), our Canadian lineup remains the cornerstone of our coaching approach.
Don’t miss out on exclusive newsletters and premium content that will help you sharpen your investing strategy. Explore it all at magicpants.substack.com.
Your journey to dividend growth mastery starts here – let’s dive in!
- Last week, dividend growth stayed the same, with an average return of +2.3% YTD (income).
- Last week, the price of ‘The List’ was up from the previous week with an average return of +0.38% YTD (capital).
- Last week, there were no dividend announcements made by companies on ‘The List’.
- Last week, there were no earnings reports from companies on ‘The List’.
- This week, no companies on ‘The List’ are due to report earnings.
DGI Clipboard
“Should I be buying any of the timely 10 or just wait?”
– New Subscriber
Leveraging the Timely Ten: A New Subscriber’s Guide
Intro
Each month, we spotlight the top ten most undervalued companies on ‘The List’, identified using dividend yield theory, to assist subscribers in their research. While we issue DGI Alerts whenever we add a company to our model portfolio, we understand that new subscribers may need guidance on leveraging our process effectively—especially when they receive our current ‘Timely Ten’ list. To illustrate, we will feature a company that found its way into the ‘Timely Ten’ not so long ago.
TC Energy Corp. (TRP-T) faced significant challenges throughout 2022 and 2023, which pushed its dividend yield to a ten-year high. Since price and yield move inversely, a lower share price results in a higher yield, and vice versa. During this period, TRP-T was trading in the mid-$40 range, offering an attractive yield of approximately 7.5%—a key factor in our decision to take it to our maximum position size at that time as part of our model portfolio.
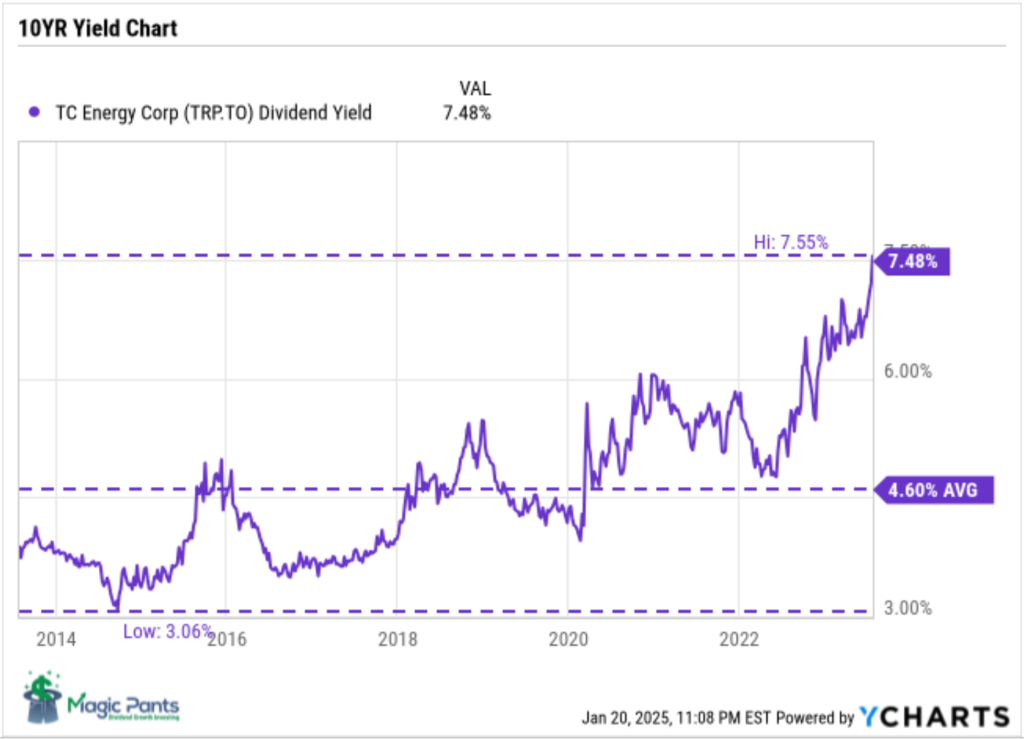
Fast forward to today, and TC Energy Corp. has experienced a remarkable turnaround. Its share price has rebounded significantly, now trading near $70, while the dividend yield has normalized, reverting closer to its long-term average of approximately 4.6%.
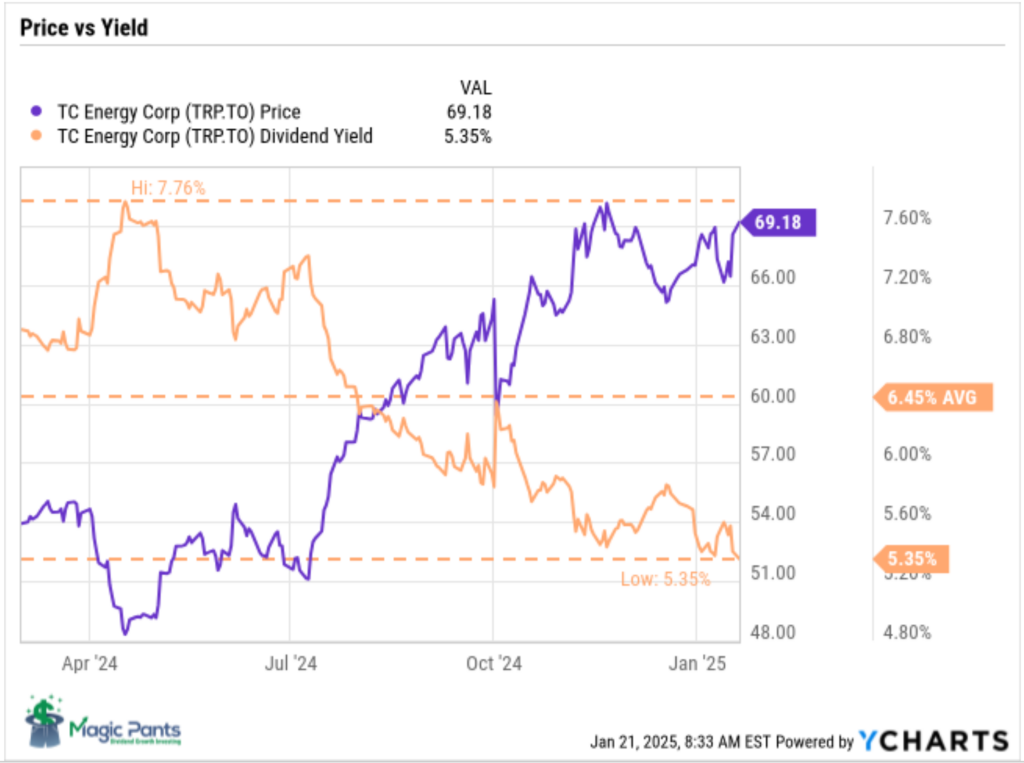
This was a textbook example of dividend yield theory in action for those patient enough to let the thesis unfold. One of the key advantages of our strategy is that we get paid to wait—earning a 7.5% dividend yield on our investment capital made the waiting period effortless.
While not every stock in the ‘Timely Ten’ will rebound as quickly as TC Energy Corp., the empirical evidence suggests a high probability of recovery for quality companies. Always prioritize quality over yield when making investment decisions.
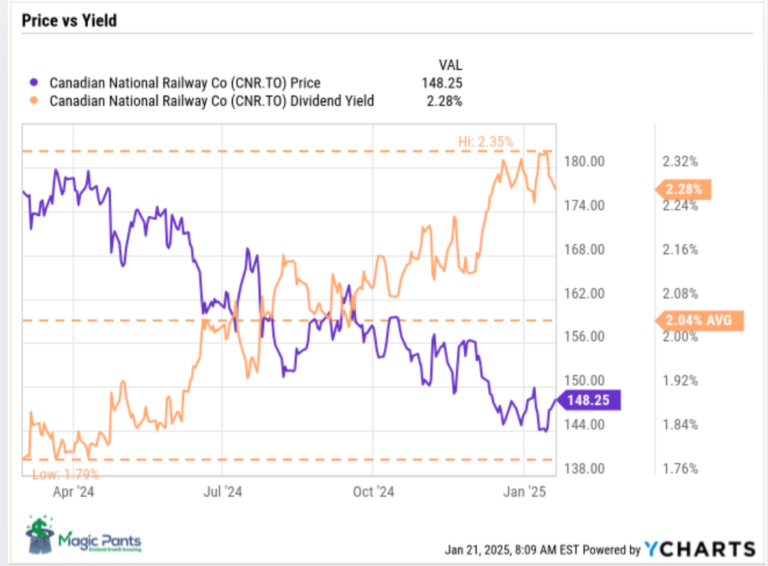
To help our free subscribers better understand how to leverage our process with the current ‘Timely Ten’ companies, we’ve prepared the following charts on one of our quality dividend growers, Canadian National Railway (CNR-T):
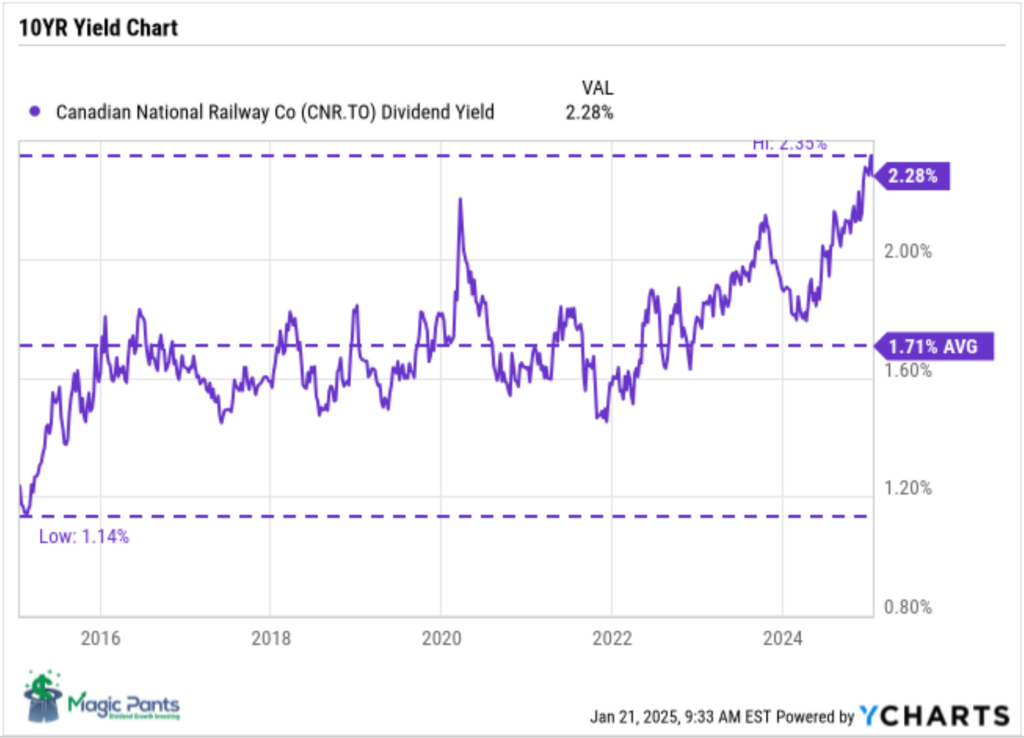
Notice the parallel to the TC Energy Corp. 10YR Yield chart above. Both show historically high yields.
Another way to view the disconnect between price and yield is with this chart:
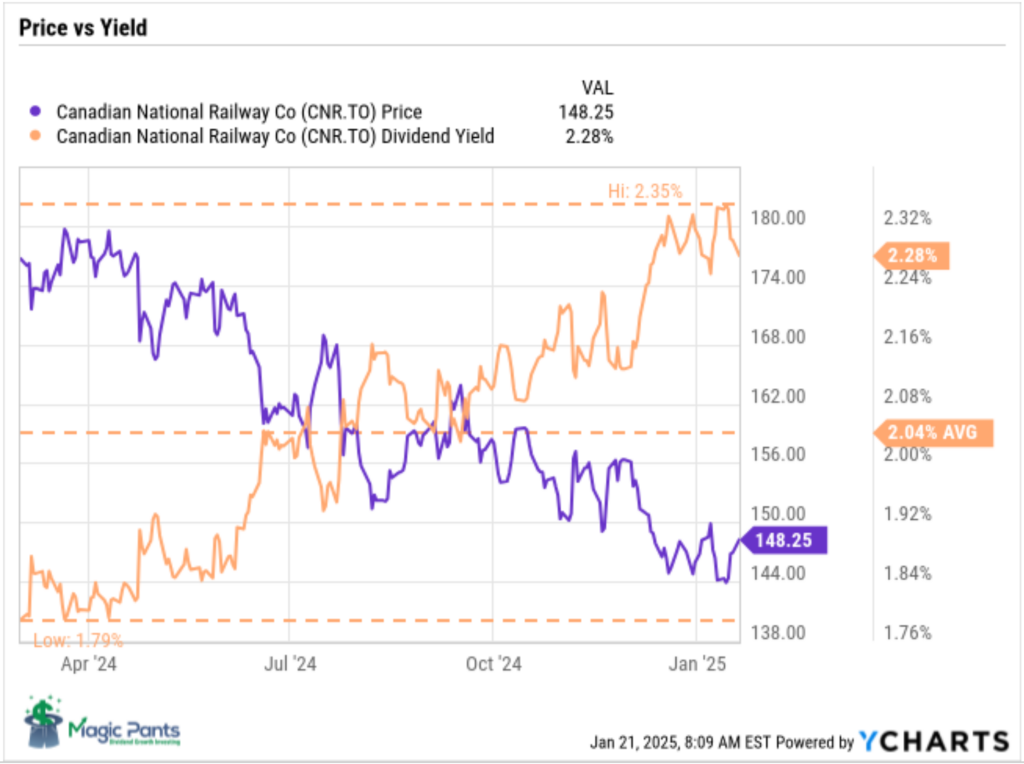
When a company is sensibly priced, its yield and price align closely. A significant gap between the two—either too high or too low—indicates under- or overvaluation.
With Canadian National Railway now trading at a historically high yield, signaling undervaluation, we recently issued a DGI Alert to maximize our position size in our model portfolio.
Wrap Up
To address the subscriber’s question above: While we rarely purchase all the companies in the ‘Timely Ten,’ there are always a few actionable opportunities that can align with your individual investment objectives and goals. One of the key advantages of our strategy is having a disciplined process that removes much of the emotion from investment decisions, making it easier to focus on long-term success.
For a more guided approach, consider becoming a PAID subscriber to gain access to DGI Alerts. These alerts notify you whenever we make a trade in our model portfolios, allowing you to invest alongside us with confidence. We do the work, and you stay in control!
DGI Scorecard
The List (2025)
The Magic Pants 2025 list includes 29 Canadian dividend growth stocks. Here are the criteria to be considered a candidate on ‘The List’:
- Dividend growth streak: 10 years or more.
- Market cap: Minimum one billion dollars.
- Diversification: Limit of five companies per sector, preferably two per industry.
- Cyclicality: Exclude REITs and pure-play energy companies due to high cyclicality.
Based on these criteria, companies are added or removed from ‘The List’ annually on January 1. Prices and dividends are updated weekly.
‘The List’ is not a portfolio but a coaching tool that helps us think about ideas and risk manage our model portfolio. We own some but not all the companies on ‘The List’. In other words, we might want to buy these companies when valuation looks attractive.
Our newsletter provides readers with a comprehensive insight into the implementation and advantages of our Canadian dividend growth investing strategy. This evidence-based, unbiased approach empowers DIY investors to outperform both actively managed dividend funds and passively managed indexes and dividend ETFs over longer-term horizons.
For those interested in something more, please upgrade to a paid subscriber; you get the enhanced weekly newsletter, access to premium content, full privileges on the new Substack website magicpants.substack.com and DGI alerts whenever we make stock transactions in our model portfolio.
Performance of ‘The List’
Last week, dividend growth stayed the same, with an average return of +2.3% YTD (income).
Last week, the price of ‘The List’ was up from the previous week with an average return of +0.38% YTD (capital).
Even though prices may fluctuate, the dependable growth in our income does not. Stay the course. You will be happy you did.
Last week’s best performers on ‘The List’ were TD Bank (TD-T), up +6.30%; Stella-Jones Inc. (SJ-T), up +5.17%; and Emera (EMA-T), up +3.22%.
Dollarama Inc. (DOL-T) was the worst performer last week, down -2.74%.
| SYMBOL | COMPANY | YLD | PRICE | YTD % | DIV | YTD % | STREAK |
|---|---|---|---|---|---|---|---|
| ATD-T | Alimentation Couche-Tard Inc. | 1.0% | $76.78 | -2.87% | $0.78 | 8.3% | 15 |
| BCE-T | Bell Canada | 11.9% | $33.50 | -0.06% | $3.99 | 0.0% | 16 |
| BIP-N | Brookfield Infrastructure Partners | 5.2% | $31.22 | -2.01% | $1.62 | 0.0% | 17 |
| CCL-B-T | CCL Industries Inc. | 1.6% | $71.44 | -2.96% | $1.16 | 0.0% | 23 |
| CNR-T | Canadian National Railway | 2.3% | $146.93 | 0.10% | $3.38 | 0.0% | 29 |
| CTC-A-T | Canadian Tire | 4.4% | $160.99 | 4.74% | $7.10 | 1.4% | 14 |
| CU-T | Canadian Utilities Limited | 5.3% | $34.41 | -1.06% | $1.83 | 1.0% | 53 |
| DOL-T | Dollarama Inc. | 0.3% | $133.34 | -4.89% | $0.37 | 5.1% | 14 |
| EMA-T | Emera | 5.4% | $54.17 | 1.20% | $2.90 | 0.7% | 18 |
| ENB-T | Enbridge Inc. | 5.9% | $64.38 | 4.06% | $3.77 | 3.0% | 29 |
| ENGH-T | Enghouse Systems Limited | 3.8% | $27.12 | 0.22% | $1.04 | 4.0% | 18 |
| FNV-N | Franco Nevada | 1.1% | $125.78 | 3.84% | $1.44 | 0.0% | 17 |
| FTS-T | Fortis Inc. | 4.1% | $60.69 | 1.79% | $2.46 | 3.1% | 51 |
| GSY-T | goeasy Ltd. | 2.7% | $173.99 | 4.09% | $4.68 | 0.0% | 10 |
| IFC-T | Intact Financial | 1.9% | $253.75 | -3.51% | $4.84 | 0.0% | 20 |
| L-T | Loblaw Companies Limited | 1.1% | $181.36 | -4.66% | $2.05 | 7.0% | 13 |
| MFC-T | Manulife Financial | 3.6% | $44.26 | 0.73% | $1.60 | 0.0% | 11 |
| MGA-N | Magna | 4.7% | $40.35 | -3.33% | $1.90 | 0.0% | 15 |
| MRU-T | Metro Inc. | 1.5% | $90.59 | 0.47% | $1.34 | 0.0% | 30 |
| RY-T | Royal Bank of Canada | 3.4% | $174.28 | 1.17% | $5.92 | 3.5% | 14 |
| SJ-T | Stella-Jones Inc. | 1.6% | $70.80 | -3.00% | $1.12 | 0.0% | 20 |
| STN-T | Stantec Inc. | 0.7% | $112.11 | -0.88% | $0.84 | 1.8% | 13 |
| T-T | Telus | 8.0% | $20.14 | 2.60% | $1.61 | 5.2% | 21 |
| TD-T | TD Bank | 5.1% | $83.13 | 8.67% | $4.20 | 2.9% | 14 |
| TFII-N | TFI International | 1.3% | $134.23 | 1.22% | $1.80 | 12.5% | 14 |
| TIH-T | Toromont Industries | 1.7% | $115.27 | 1.92% | $1.92 | 0.0% | 35 |
| TRI-N | Thomson Reuters | 1.4% | $159.25 | -1.93% | $2.16 | 0.0% | 31 |
| TRP-T | TC Energy Corp. | 4.8% | $68.56 | 0.50% | $3.29 | 0.0% | 24 |
| WCN-N | Waste Connections | 0.7% | $178.24 | 4.90% | $1.26 | 7.7% | 15 |
| Averages | 3.3% | 0.38% | 2.3% | 21 |
Note: Stocks ending in “-N” declare earnings and dividends in US dollars. To achieve currency consistency between dividends and share price for these stocks, we have shown dividends in US dollars and share price in US dollars (these stocks are listed on a US exchange). The dividends for their Canadian counterparts (-T) would be converted into CDN dollars and would fluctuate with the exchange rate.
PAID subscribers enjoy full access to our enhanced weekly newsletter, premium content, and easy-to-follow trade alerts so they can build DGI portfolios alongside ours. This service provides the resources to develop your DGI business plan confidently. We do the work; you stay in control!
It truly is the subscription that pays dividends!
The greatest investment you can make is in yourself. Are you ready to take that step?
For more articles and the full newsletter, check us out on magicpants.substack.com.
