Last updated by BM on February 18, 2025
Summary
Welcome to this week’s MP Market Review – your go-to source for insights and updates on the Canadian dividend growth companies we track on ‘The List’! While we’ve expanded our watchlists to include U.S. companies (The List-USA), our Canadian lineup remains the cornerstone of our coaching approach.
Don’t miss out on exclusive newsletters and premium content that will help you sharpen your investing strategy. Explore it all at magicpants.substack.com.
Your journey to dividend growth mastery starts here – let’s dive in!
- Last week, dividend growth was up, with an average return of +5.2% YTD (income).
- Last week, the price of ‘The List’ was up from the previous week with an average return of +1.04% YTD (capital).
- Last week, there were five dividend announcements made by companies on ‘The List’.
- Last week, there were ten earnings reports from companies on ‘The List’.
- This week, five companies on ‘The List’ are due to report earnings.
DGI Clipboard
“Current yield, using its own historic yield as a guide, is, in my view, a fine valuation measure.”
– Tom Connolly
Timely Ten: Our Top 10 Undervalued Canadian & U.S. Dividend Growth Stocks Amid Rising Trade Tensions

Intro
The Trump tariff policies have brought significant market volatility, with The Wall Street Journal even calling it “the dumbest trade war in history.” As dividend growth investors, we see short-term negativity as an opportunity—market dips allow us to buy more income at better prices. While tariff threats may impact some of our quality dividend growers, both positively and negatively, our focus remains on long-term fundamentals.
Earnings season also adds to the turbulence, with several stocks on our watchlists taking a hit after they reported. Some have now entered our ‘Timely Ten’, while others have climbed higher on the list. We’ll be watching these opportunities most closely in the weeks ahead.
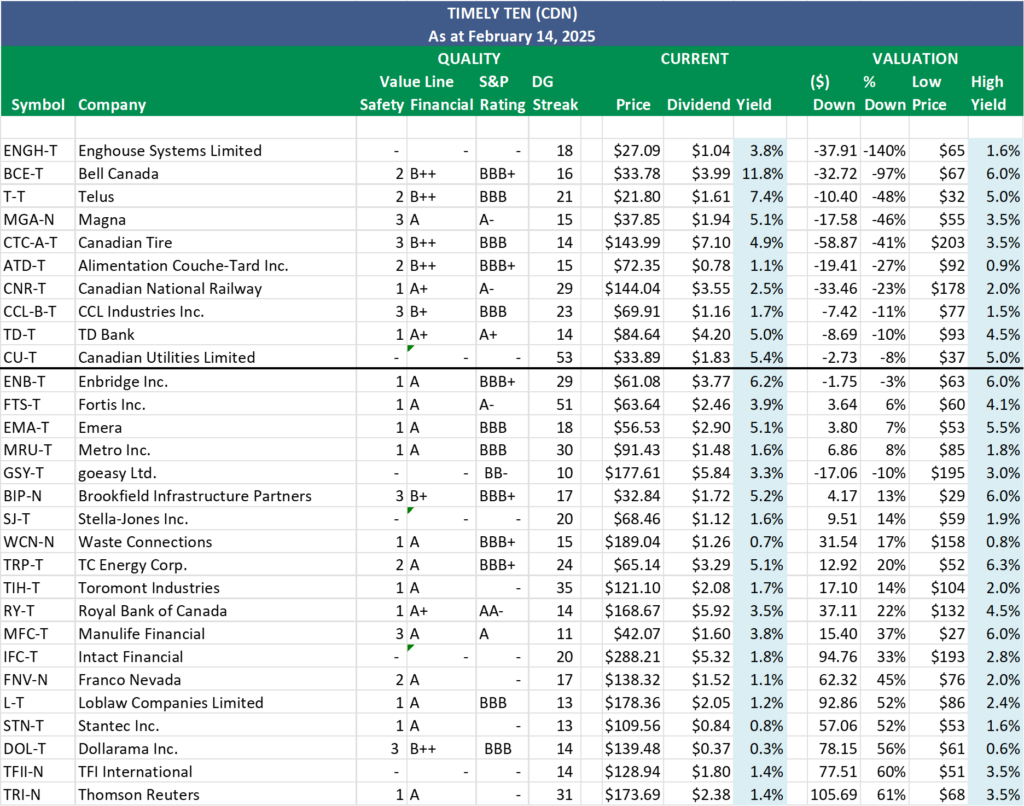
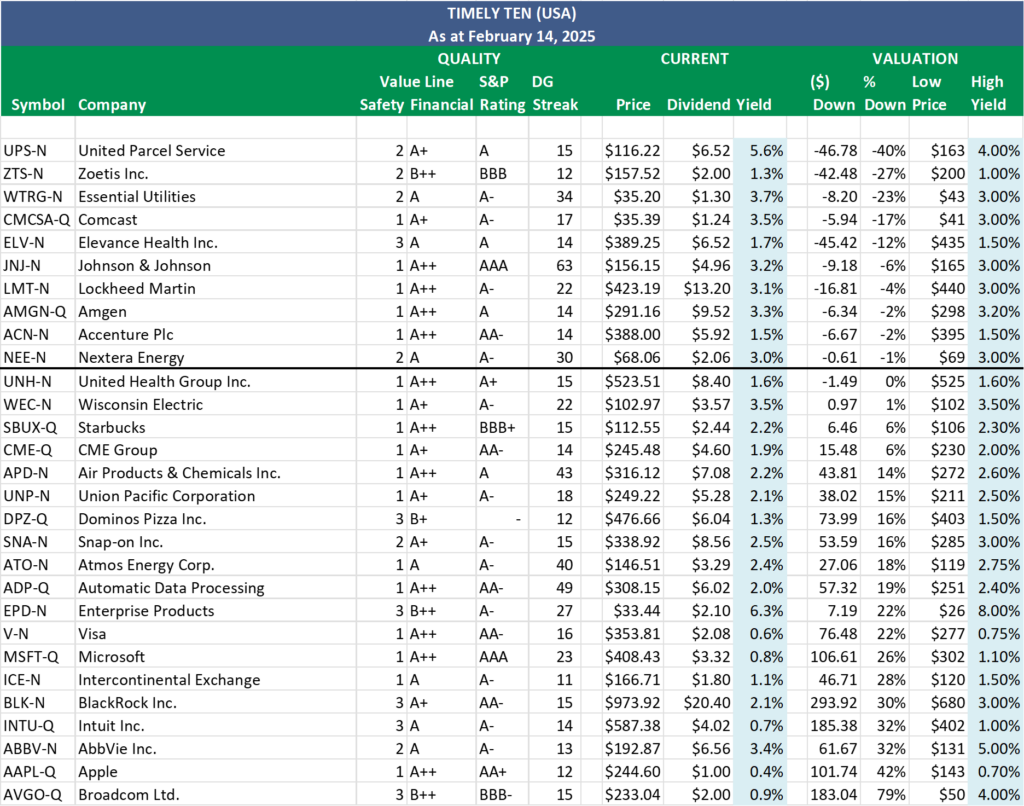
Below are the ten most undervalued dividend growth companies from our Canadian and U.S. watchlists, based on last Friday’s closing prices.
Here’s a recap on how we select our ‘Timely Ten’:
Step three in our process involves monitoring our quality dividend growers regularly, which can become quite challenging depending on the number of companies we track. Fortunately, we rely on ‘The List’ instead of the vast array of stocks in the index, which streamlines our task. Nevertheless, we continually seek methods to enhance our efficiency. Through dividend yield theory, we’ve discovered an approach that has proven remarkably effective in aiding us with our efforts over the years.
Dividend yield theory is a simple and intuitive approach to valuing dividend growth stocks. It suggests that the dividend yield of quality dividend growth stocks tends to revert to the mean over time, assuming that the underlying business model remains stable. In practical terms, if a stock pays a dividend yield above its ten-year average annual yield, its price will likely increase to return the yield to its historical average. Knowing that price and yield go in opposite directions, this theory helps us find stocks poised for a favourable price correction.
We have pre-screened our candidates using the criteria we initially laid out in building our watchlists. This helps us considerably narrow the universe of investable stocks.
- Dividend growth streak: 10 years or more.
- Market cap: Minimum one billion dollars.
- Diversification: Limit of five companies per sector, preferably two per industry.
- Cyclicality: Exclude REITs and pure-play energy companies due to high cyclicality.
Next, we rank our Canadian and American watchlists based on how far each stock’s price is below its fair value (Low Price), as determined by dividend yield theory. To find fair value, divide the current dividend (Dividend) by the stock’s historical high yield (High Yield).
Since price and yield move in opposite directions, a lower price results in a higher yield, and vice versa. The ten companies above the thick black line have a current price (Price) below fair value (Low Price). Put simply, these stocks have a current dividend yield higher than their historically high yield. According to dividend yield theory, these companies are sensibly priced and have the highest probability of a price increase in the shorter term. These are our ‘Timely Ten.’
Wrap Up
When making investment decisions, always prioritize a company’s ‘quality’ over a ‘sensible price’. For more details on stock selection and our quality indicators, refer to our free sample Business Plan.
If you’re a new investor looking to build positions in the ‘Timely Ten,’ now is the perfect time to start your research and act.
For a more guided approach, when building your DGI portfolio, consider becoming a PAID subscriber to unlock access to DGI Alerts. These alerts notify you whenever we make a trade in our model portfolios, allowing you to invest alongside us with confidence. We do the work, and you stay in control!
DGI Scorecard
The List (2025)
The Magic Pants 2025 list includes 29 Canadian dividend growth stocks. Here are the criteria to be considered a candidate on ‘The List’:
- Dividend growth streak: 10 years or more.
- Market cap: Minimum one billion dollars.
- Diversification: Limit of five companies per sector, preferably two per industry.
- Cyclicality: Exclude REITs and pure-play energy companies due to high cyclicality.
Based on these criteria, companies are added or removed from ‘The List’ annually on January 1. Prices and dividends are updated weekly.
‘The List’ is not a portfolio but a coaching tool that helps us think about ideas and risk manage our model portfolio. We own some but not all the companies on ‘The List’. In other words, we might want to buy these companies when valuation looks attractive.
Our newsletter provides readers with a comprehensive insight into the implementation and advantages of our Canadian dividend growth investing strategy. This evidence-based, unbiased approach empowers DIY investors to outperform both actively managed dividend funds and passively managed indexes and dividend ETFs over longer-term horizons.
For those interested in something more, please upgrade to a paid subscriber; you get the enhanced weekly newsletter, access to premium content, full privileges on the new Substack website magicpants.substack.com and DGI alerts whenever we make stock transactions in our model portfolio.
Performance of ‘The List’
Last week, dividend growth was up, with an average return of +5.2% YTD (income).
Last week, the price of ‘The List’ was up from the previous week with an average YTD return of +1.04% (capital).
Even though prices may fluctuate, the dependable growth in our income does not. Stay the course. You will be happy you did.
Last week’s best performers on ‘The List’ were Bell Canada (BCE-T), up +6.83%; goeasy Ltd. (GSY-T), up +6.35%; and Telus (T-T), up +5.93%.
Canadian Tire (CTC-A-T) was the worst performer last week, down -7.44%.
| SYMBOL | COMPANY | YLD | PRICE | YTD % | DIV | YTD % | STREAK |
|---|---|---|---|---|---|---|---|
| ATD-T | Alimentation Couche-Tard Inc. | 1.1% | $72.35 | -8.48% | $0.78 | 8.3% | 15 |
| BCE-T | Bell Canada | 11.8% | $33.78 | 0.78% | $3.99 | 0.0% | 16 |
| BIP-N | Brookfield Infrastructure Partners | 5.2% | $32.84 | 3.08% | $1.72 | 6.2% | 17 |
| CCL-B-T | CCL Industries Inc. | 1.7% | $69.91 | -5.04% | $1.16 | 0.0% | 23 |
| CNR-T | Canadian National Railway | 2.5% | $144.04 | -1.87% | $3.55 | 5.0% | 29 |
| CTC-A-T | Canadian Tire | 4.9% | $143.99 | -6.32% | $7.10 | 1.4% | 14 |
| CU-T | Canadian Utilities Limited | 5.4% | $33.89 | -2.56% | $1.83 | 1.0% | 53 |
| DOL-T | Dollarama Inc. | 0.3% | $139.48 | -0.51% | $0.37 | 5.1% | 14 |
| EMA-T | Emera | 5.1% | $56.53 | 5.60% | $2.90 | 0.7% | 18 |
| ENB-T | Enbridge Inc. | 6.2% | $61.08 | -1.28% | $3.77 | 3.0% | 29 |
| ENGH-T | Enghouse Systems Limited | 3.8% | $27.09 | 0.11% | $1.04 | 4.0% | 18 |
| FNV-N | Franco Nevada | 1.1% | $138.32 | 14.19% | $1.52 | 5.6% | 17 |
| FTS-T | Fortis Inc. | 3.9% | $63.64 | 6.74% | $2.46 | 3.1% | 51 |
| GSY-T | goeasy Ltd. | 3.3% | $177.61 | 6.25% | $5.84 | 24.8% | 10 |
| IFC-T | Intact Financial | 1.8% | $288.21 | 9.60% | $5.32 | 9.9% | 20 |
| L-T | Loblaw Companies Limited | 1.2% | $178.36 | -6.23% | $2.05 | 7.0% | 13 |
| MFC-T | Manulife Financial | 3.8% | $42.07 | -4.26% | $1.60 | 0.0% | 11 |
| MGA-N | Magna | 5.1% | $37.85 | -9.32% | $1.94 | 2.1% | 15 |
| MRU-T | Metro Inc. | 1.6% | $91.43 | 1.40% | $1.48 | 10.4% | 30 |
| RY-T | Royal Bank of Canada | 3.5% | $168.67 | -2.09% | $5.92 | 3.5% | 14 |
| SJ-T | Stella-Jones Inc. | 1.6% | $68.46 | -6.21% | $1.12 | 0.0% | 20 |
| STN-T | Stantec Inc. | 0.8% | $109.56 | -3.14% | $0.84 | 1.8% | 13 |
| T-T | Telus | 7.4% | $21.80 | 11.05% | $1.61 | 5.2% | 21 |
| TD-T | TD Bank | 5.0% | $84.64 | 10.64% | $4.20 | 2.9% | 14 |
| TFII-N | TFI International | 1.4% | $128.94 | -2.77% | $1.80 | 12.5% | 14 |
| TIH-T | Toromont Industries | 1.7% | $121.10 | 7.07% | $2.08 | 8.3% | 35 |
| TRI-N | Thomson Reuters | 1.4% | $173.69 | 6.97% | $2.38 | 10.2% | 31 |
| TRP-T | TC Energy Corp. | 5.1% | $65.14 | -4.51% | $3.29 | 0.0% | 24 |
| WCN-N | Waste Connections | 0.7% | $189.04 | 11.26% | $1.26 | 7.7% | 15 |
| Averages | 3.4% | 1.04% | 5.2% | 21 |
Note: Stocks ending in “-N” declare earnings and dividends in US dollars. To achieve currency consistency between dividends and share price for these stocks, we have shown dividends in US dollars and share price in US dollars (these stocks are listed on a US exchange). The dividends for their Canadian counterparts (-T) would be converted into CDN dollars and would fluctuate with the exchange rate.
PAID subscribers enjoy full access to our enhanced weekly newsletter, premium content, and easy-to-follow trade alerts so they can build DGI portfolios alongside ours. This service provides the resources to develop your DGI business plan confidently. We do the work; you stay in control!
It truly is the subscription that pays dividends!
The greatest investment you can make is in yourself. Are you ready to take that step?
For more articles and the full newsletter, check us out on magicpants.substack.com.
