Last updated by BM on August 8, 2022
Summary
- This article is part of our weekly series (MP Market Review) highlighting the performance and activity from the previous week related to the financial markets and Canadian dividend growth companies we follow on ‘The List’.
- Last week, ‘The List’ was down a few basis points with a minus -1.3% YTD price return (capital). Dividend growth of ‘The List’ remains at 10.2% YTD, demonstrating the rise in income over the last year.
- Last week, there were no dividend increases from companies on ‘The List’.
- Last week, there were four earnings reports from companies on ‘The List’.
- Eight companies on ‘The List’ are due to report earnings this week.
- Are you looking for a portfolio of ideas like these? Magic Pants DGI Premium Membership Subscribers get exclusive access to the MP Wealth-Builder Model Portfolio (CDN). Learn More
“Markets are designed to suck the most amount of people in at the most inopportune time.”
– Keith McCullough, Hedgeye CEO
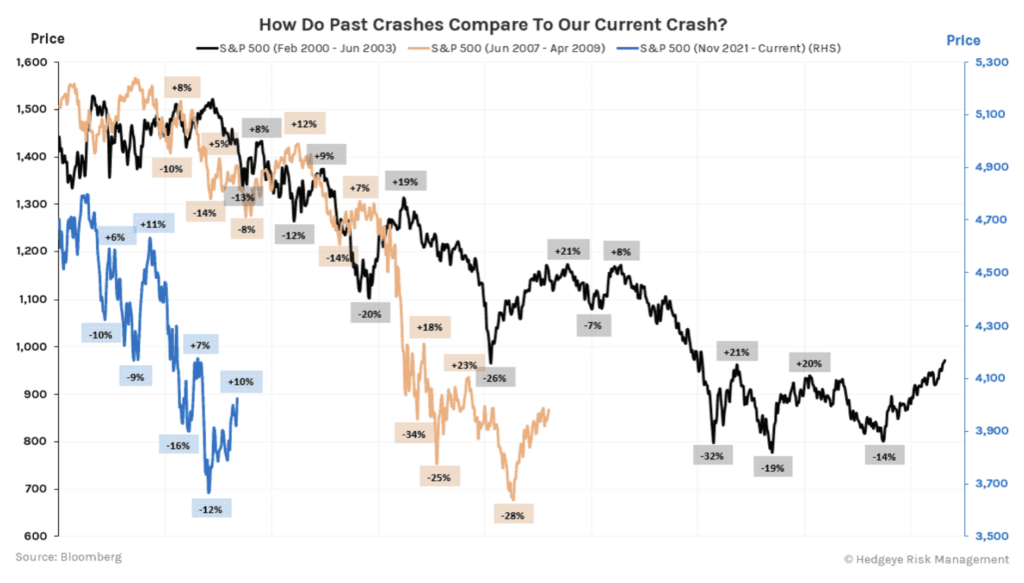
We read an interesting article from Hedgeye (macro investing subscription) over the weekend comparing the last two bear markets in the United States to today’s market. The premise of the article was the last two bear markets saw much larger bear market rallies than we saw in July and the markets continued lower. The average move up in the US 2000-2003 bear market was +15% and the average move down was -18%. In the 2008-2009 bear market the average move up was +12% and the average move down was -19%.

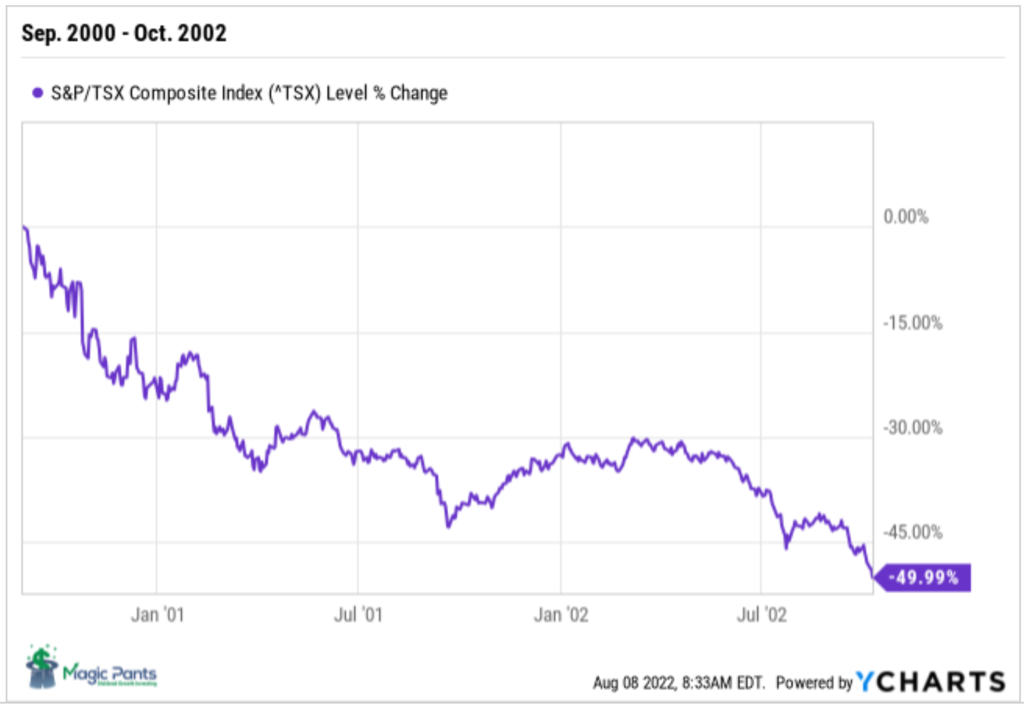
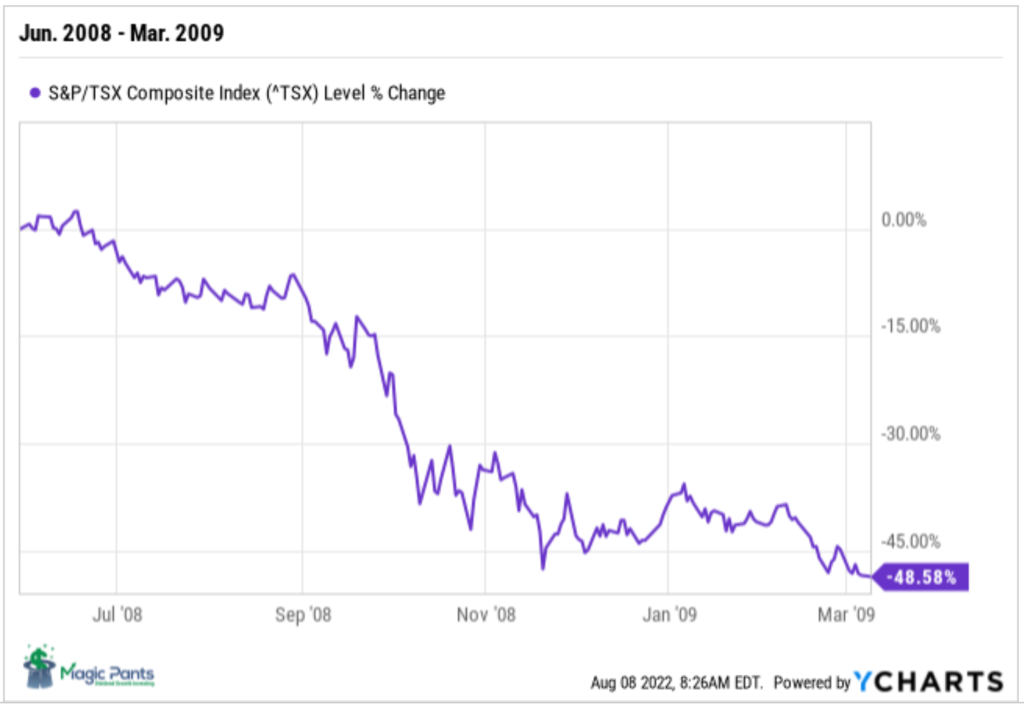
We decided to look at the Canadian markets during these bear markets to see how they behaved. Here are the two charts:


Similar to the markets south of the border, the last two bear markets in Canada had several bounces before the Canadian market found its bottom.
In terms of duration, the current crash has only lasted 16% as long as 2000 and 40% as long as 2008. The message we get from this is that the current bear market has a high probability of lasting much longer.
Although many of our good dividend growers faired much better during past bear markets we are still vigilant about getting ‘sucked in’ too soon given today’s macro conditions.
Performance of ‘The List’
Last week, ‘The List’ was down a few basis points with a minus -1.3% YTD price return (capital). Dividend growth of ‘The List’ remains at 10.2% YTD, demonstrating the rise in income over the last year.
The best performers last week on ‘The List’ were TFI International (TFII-N), up 6.31%; Waste Connections (WCN-N), up 3.72%; and Canadian Tire (CTC-A-T), up 3.05%.
TC Energy Corp. (TRP-T) was the worst performer last week, down -6.91%.
Recent News
What’s wrong with my dividend ETF? (Globe & Mail)
“Long-term investors should be aware that energy stocks will one day be dead weight for dividend stocks. Low oil prices would be a twofold problem – lower share prices and falling dividend payments.”
The author speaks about the differences in an ETF’s weighting as a major determinant of the funds’ returns. When we reviewed the top dividend ETFs in Canada, we found a similar issue. The Canadian ETFs were heavily weighted in energy and financial companies (over 50%) which can cause quite a fluctuation in performance year to year.
‘The List’ and our model portfolio are purposely built so that no one sector will have an adverse effect on long-term returns. Compare our historical performance (on the subscribe page) to other dividend funds to see for yourself.
Acquisition of LifeWorks approved by Lifeworks shareholders (Telus website)
“Following LifeWorks’ shareholder approval, we remain highly confident in receiving the appropriate regulatory approvals and, in turn, closing this transaction on or about the fourth quarter of 2022, and look forward to welcoming LifeWorks’ employees and customers into our TELUS Health family,” said Darren Entwistle, President and CEO.”
It will be interesting to watch Telus’ transition over the next few years!
Eight companies on ‘The List’ are due to report earnings this week.
Metro (MRU-T) will release its third-quarter 2022 results on Wednesday, August 10, 2022, before markets open.
Emera (EMA-T) will release its second-quarter 2022 results on Wednesday, August 10, 2022, before markets open.
Stella-Jones (SJ-T) will release its second-quarter 2022 results on Wednesday, August 10, 2022, before markets open.
Stantec (STN-T) will release its second-quarter 2022 results on Wednesday, August 10, 2022, after markets close
Franco-Nevada (FNV-N) will release its second-quarter 2022 results on Wednesday, August 10, 2022, after markets close
CCL Industries (CCL-B-T) will release its second-quarter 2022 results on Wednesday, August 10, 2022, after markets close
Canadian Tire Corp. (CTC-A-T) will release its second-quarter 2022 results on Thursday, August 11, 2022, before markets open.
Algonquin Power & Utilities (AQN-N) will release its second-quarter 2022 results on Thursday, August 11, 2022, after markets close
Dividend Increases
Last week, there were no dividend increases from companies on ‘The List’.
Earnings Releases
Last week, four companies on ‘The List’, reported their Q2 Fiscal 2022 earnings. Let’s get started with Waste Connections.
Waste Connections (WCN-N)
“Accelerating solid waste pricing and E&P waste activity drove a top-to-bottom beat in the period. Solid waste pricing growth of 8.8% enabled us to overcome increased inflationary pressures during the period and deliver adjusted EBITDA(b) margin in line with our outlook for Q2 and flat on a year over year basis excluding the margin dilutive impact from acquisitions completed since the year ago period,” said Worthing F. Jackman, President and Chief Executive Officer.
Highlights:
- Accelerating solid waste pricing growth and E&P waste activity drive better than expected Q2 results
- Revenue of $1.816 billion, up 18.4%
- Net income of $224.1 million, and adjusted EBITDA of $566.8 million, up 16.9%
- Adjusted EBITDA margin of 31.2% of revenue, in line with outlook and flat year over year, excluding acquisitions
- Net income of $0.87 per share, and adjusted net income of $1.00 per share, up 23.5%
- Year to date net cash provided by operating activities of $973.7 million and adjusted free cash flow(b) of $638.4 million, or 18.4% of revenue
- Year to date signed or closed acquisitions with approximately $470 million of total annualized revenue
- Increases full year 2022 outlook to revenue of approximately $7.125 billion, net income of approximately $837.5 million, adjusted EBITDA of approximately $2.190 billion, net cash provided by operating activities of approximately $1.974 billion and adjusted free cash flow of approximately $1.160 billion
Outlook:
Waste Connections also updated its outlook for 2022, which assumes no change in the current economic environment or underlying economic trends.
- Revenue is estimated to be approximately $7.125 billion, as compared to our original revenue outlook of approximately $6.875 billion.
- Net income is estimated to be approximately $837.5 million, and adjusted EBITDA is estimated to be approximately $2.190 billion, or about 30.7% of revenue, as compared to our original adjusted EBITDA outlook of $2.145 billion or 31.2% of revenue.
- Capital expenditures are estimated to be approximately $850 million, in line with our original outlook.
- Net cash provided by operating activities is estimated to be approximately $1.974 billion, and adjusted free cash flow of approximately $1.160 billion, or about 16.3% of revenue, as compared to our original adjusted free cash flow outlook of $1.150 billion or 16.7% of revenue.
See the full Earnings Release here
Brookfield Infrastructure Partners (BIP-N)
“We generated record financial results during the second quarter, with strong cash flows from our base business given the essential nature of our investments and the highly regulated or contracted revenue frameworks they operate under,” said Sam Pollock, Chief Executive Officer of Brookfield Infrastructure. “It was a very successful quarter as we continued to execute on our asset rotation strategy. In the past several weeks, we committed $1.9 billion across two marquee European companies and agreed to sell four mature assets for total proceeds of nearly $900 million. We will once again exceed our annual investment deployment target and thus our financial results should remain strong and well ahead of last year.”
Highlights:
- FFO of $513 million in the second quarter represents an increase of 30% over the prior year on a total basis
- FFO per unit increased by 20% reflecting the shares issued in conjunction with the Inter Pipeline privatization and an equity offering completed in November
- Organic growth was 10% reflecting the high inflationary environment and earnings associated with ~$1 billion of capital commissioned over the last 12 months
- Significant contribution from our asset rotation program and the privatization of Inter Pipeline in the second half of 2021
- Distribution of $0.36 per unit represents an increase of 6% compared to the prior year
- Payout ratio for the quarter of 69% falls within our long-term 60-70% target range
- Net income benefited from the contribution associated with recent acquisitions, organic growth across our base business, as well as a mark-to-market gain on our foreign currency hedging program
- Excluding the impact of disposition gains in the current and prior year, net income increased $200 million relative to last year
- Total assets decreased compared to December 31, 2021 due to the impact of foreign exchange more than offsetting organic growth and the acquisition of two Australian utilities
Strategic Initiatives:
- Closed the acquisition of Intellihub, the leading provider of electricity smart meters in Australia and New Zealand, for ~$215 million (BIP’s share) on April 1, 2022
- Announced two take private transactions:
- Acquisition of Uniti Group Ltd. through a 50/50 joint venture partnership; net to BIP equity of ~$200 million, closing expected in early August
- Acquisition of HomeServe Plc, a residential infrastructure business in the U.K. and U.S.; net to BIP equity of ~$1.3 billion, closing expected in Q4
- Announced an agreement to acquire a 51% interest, alongside another institutional investor, in a marquee portfolio of ~36,000 telecom towers in Germany and Austria; total transaction size is €17.5 billion (net to BIP equity – ~$600 million)
Outlook:
The macroeconomic outlook has continued to evolve as central banks are making a concerted effort to tackle high inflation by way of substantial interest rate hikes. Consequently, these actions have increased the probability of recessionary conditions in many markets in which we operate. While an economic slowdown will generally have negative consequences for many companies, the highly contracted and regulated nature of the revenue frameworks at our assets should cushion the effects on Brookfield Infrastructure. Nonetheless we will continue to operate our businesses prudently, by monitoring inflationary cost pressures within our business and maintaining high levels of liquidity.
From a new investment perspective, we may be entering a period where we can buy for value. Generally, we expect that infrastructure assets will hold their value through recessionary conditions given their resilient nature. However, should liquidity in the market become tighter, certain owners of high-quality assets may become overextended, allowing us to use our liquidity and access to capital to make investments at attractive entry points. Following an active start to the year, we are focused on a number of new investment opportunities that if successful, will begin contributing toward our 2023 capital deployment target.
For the remainder of the year, our priority will be to complete the investments and asset sales that we have secured or are in the process of securing. We will once again exceed our investment deployment target for the year and thus the financial results for the year should remain strong and well ahead of last year.
See the full Earnings Release here
Bell Canada (BCE-T)
“We continue to see momentum in wireless with 110,761 mobile phone net subscriber activations and strong service revenue growth. Our retail Internet net activations were also up 27.9% with 8% residential Internet revenue growth. These excellent results are a testament to the significant and unprecedented investments we’re making in network connectivity, reliability, and our fibre footprint expansion. In addition, our continued investments in customer experience and digital support options are encouraging customers to stay with Bell, as reflected in a third consecutive quarter of improved churn for our wireless, residential Internet and Fibe TV services.”
Highlights:
- Consolidated adjusted EBITDA up 4.6% driven by 3.8% service revenue growth
- Net earnings of $654 million, down 10.9%, with net earnings attributable to common shareholders of $596 million, or $0.66 per common share, down 13.2%; adjusted net earnings1 of $791 million generated adjusted EPS1 of $0.87, up 4.8%
- Wireless operating momentum continues: 110,761 mobile phone net subscriber activations, up 139.5%; best-ever quarterly postpaid churn2 rate of 0.75%; 3.8% higher mobile phone blended ARPU ; and strong service revenue and adjusted EBITDA growth of 7.8% and 8.3% respectively
- Next evolution of 5G underway with the launch of mobile 5G+, delivering Bell’s fastest mobile speeds ever
- Retail Internet net activations up 27.9% to 22,620 with 8% residential Internet revenue growth; on track to deliver approximately 900,000 new fibre locations in 2022
- Broadband leadership underscored with upcoming launches of 8 Gbps symmetrical pure fibre Internet service in select areas of Toronto with data upload speeds 250 times faster than cable, and Wi-Fi 6E technology; and newly launched Fibe TV service powered by Google Android TV
- Media revenue up 8.7% with 5.6% adjusted EBITDA growth; digital revenue up 55%
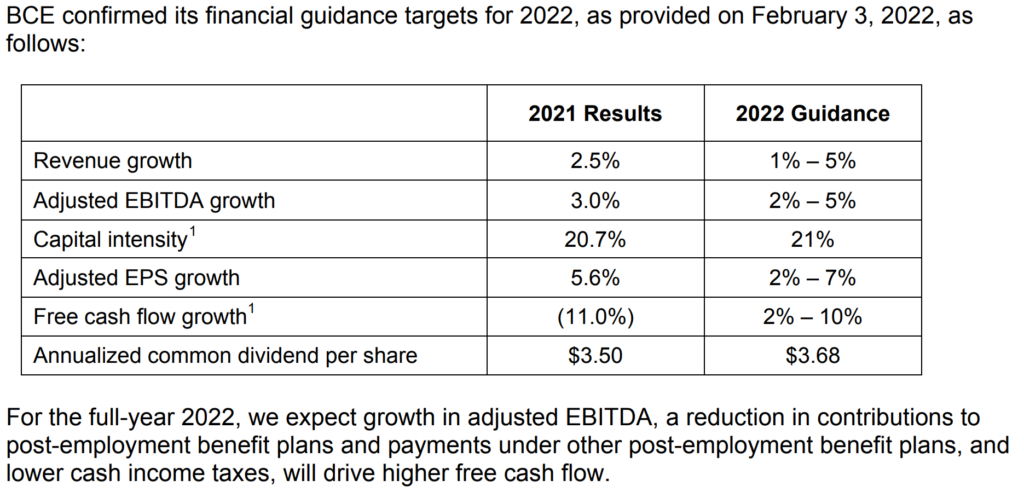
- Reconfirming all 2022 financial guidance targets
Outlook:

See the full Earnings Release here
Telus (T-T)
“In the second quarter, the TELUS team once again demonstrated continued execution excellence, characterized by the consistent combination of industry-leading customer growth, resulting in strong operational and financial results across our business,” said Darren Entwistle, President and CEO. “Our robust performance reflects the potency of our globally leading broadband networks and customer-centric culture, which enabled record second quarter total customer additions of 247,000. This included strong mobile phone net additions of 93,000, our best second quarter result since 2011, and industry-leading total fixed net additions of 62,000, an all-time second quarter record for TELUS. Our leading customer growth is underpinned by our consistent, industry-best client loyalty across our mobile and fixed product lines. Notably, again this quarter, blended mobile phone, PureFibre internet, Optik TV, security and voice churn were all below one per cent. Moreover, our industry-leading postpaid mobile phone churn of 0.64 per cent was unchanged over the prior year period, and represents the seventh quarter out of the last 10 below 0.80 per cent.”
Highlights:
- Industry-leading total Mobile and Fixed customer growth of 247,000, up 24,000 over last year and our strongest second quarter on record, driven by higher year-over-year customer growth across our portfolio of leading Mobile and Fixed services
- Leading customer growth reflects strong demand for our superior bundled offerings over world-leading broadband networks and leading customer loyalty results, including Blended Mobile Phone Churn of 0.81 per cent
- Consolidated Revenue, Adjusted EBITDA, Net Income and Earnings Per Share growth of 7.1 per cent, 8.9 per cent, 45 per cent and 36 per cent, respectively, reflecting consistent execution excellence; Adjusted Net Income and Earnings Per Share of 21 per cent and 23 per cent, respectively
- Continued operating momentum in our high-growth, technology-oriented verticals with robust Revenue growth across TELUS International, TELUS Health and TELUS Agriculture & Consumer Goods
- Shareholders of LifeWorks approve our proposed acquisition; transaction to add significant scale, strengthening TELUS Health’s position as a leading global provider of digital primary and preventative healthcare, mental health and wellness solutions for employers
Outlook:
The assumptions for our 2022 outlook, as described in Section 9 in our 2021 annual MD&A, remain the same, except for the following:
Our revised estimates for 2022 economic growth in Canada, B.C., Alberta, Ontario and Quebec are 3.9%, 4.1%, 5.1%, 3.8% and 3.1%, respectively (compared to 4.3%, 4.2%, 4.4%, 4.5% and 3.7%, respectively, as reported in our 2021 annual MD&A). 11
Our revised estimates for 2022 annual unemployment rates in Canada, B.C., Alberta, Ontario and Quebec are 5.4%, 4.8%, 6.4%, 5.8% and 4.4%, respectively (compared to 6.1%, 5.2%, 7.1%, 6.1% and 5.3%, respectively, as reported in our 2021 annual MD&A).
Our revised estimates for 2022 annual rates of housing starts on an unadjusted basis in Canada, B.C., Alberta, Ontario and Quebec are 240,000 units, 40,000 units, 32,000 units, 87,000 units and 59,000 units, respectively (compared to 224,000 units, 39,000 units, 30,000 units, 83,000 units and 55,000 units, respectively, as reported in our 2021 annual MD&A).
The extent to which the economic growth estimates affect us and the timing of their impact will depend upon the actual experience of specific sectors of the Canadian economy.
Below is a snapshot of ‘The List’ from last Friday’s close. For a sortable version of ‘The List’, please click on The List menu item.
‘The List’ is not meant to be a template for investors to copy exactly. Instead, its purpose is to provide investment ideas and a real-time illustration of dividend growth investing in action. It is not a ‘Buy List’ nor does it reflect the composition or returns of our Magic Pants Wealth-Builder (CDN) Portfolio. It is only a starting point for our analysis and discussion.
The List (2022)
Last updated by BM on August 5, 2022
*Note: The following graph is wide, you can scroll to the right on your device to see more of the data.
| SYMBOL | COMPANY | YLD | PRICE | YTD % | DIV | YTD % | STREAK |
|---|---|---|---|---|---|---|---|
| AQN-N | Algonquin Power & Utilities | 5.0% | $14.07 | -2.0% | $0.70 | 5.4% | 11 |
| ATD-T | Alimentation Couche-Tard Inc. | 0.8% | $57.30 | 10.0% | $0.44 | 18.1% | 12 |
| BCE-T | Bell Canada | 5.7% | $63.72 | -3.3% | $3.64 | 4.0% | 13 |
| BIP-N | Brookfield Infrastructure Partners | 3.5% | $41.02 | 0.7% | $1.44 | 5.9% | 14 |
| CCL-B-T | CCL Industries | 1.5% | $63.40 | -6.5% | $0.96 | 14.3% | 20 |
| CNR-T | Canadian National Railway | 1.8% | $164.33 | 6.1% | $2.93 | 19.1% | 26 |
| CTC-A-T | Canadian Tire | 3.5% | $169.53 | -7.5% | $5.85 | 24.5% | 11 |
| CU-T | Canadian Utilities Limited | 4.5% | $39.90 | 9.0% | $1.78 | 1.0% | 50 |
| DOL-T | Dollarama Inc. | 0.3% | $76.01 | 19.9% | $0.22 | 9.2% | 11 |
| EMA-T | Emera | 4.5% | $59.44 | -5.0% | $2.65 | 2.9% | 15 |
| ENB-T | Enbridge Inc. | 6.2% | $55.35 | 11.7% | $3.44 | 3.0% | 26 |
| ENGH-T | Enghouse Systems Limited | 2.2% | $33.24 | -27.5% | $0.72 | 16.3% | 15 |
| FNV-N | Franco Nevada | 1.0% | $128.24 | -5.8% | $1.28 | 10.3% | 14 |
| FTS-T | Fortis | 3.6% | $59.67 | -1.3% | $2.14 | 2.9% | 48 |
| IFC-T | Intact Financial | 2.1% | $191.40 | 16.9% | $4.00 | 17.6% | 17 |
| L-T | Loblaws | 1.3% | $116.52 | 13.4% | $1.54 | 12.4% | 10 |
| MGA-N | Magna | 2.9% | $61.26 | -24.9% | $1.80 | 4.7% | 12 |
| MRU-T | Metro | 1.6% | $70.30 | 4.9% | $1.10 | 12.2% | 27 |
| RY-T | Royal Bank of Canada | 3.9% | $126.47 | -7.6% | $4.96 | 14.8% | 11 |
| SJ-T | Stella-Jones Inc. | 2.1% | $37.77 | -7.2% | $0.80 | 11.1% | 17 |
| STN-T | Stantec Inc. | 1.1% | $62.16 | -11.4% | $0.71 | 6.8% | 10 |
| TD-T | TD Bank | 4.3% | $83.44 | -16.0% | $3.56 | 12.7% | 11 |
| TFII-N | TFI International | 1.0% | $106.24 | -4.1% | $1.08 | 12.5% | 11 |
| TIH-T | Toromont Industries | 1.4% | $107.51 | -5.4% | $1.52 | 15.2% | 32 |
| TRP-T | TC Energy Corp. | 5.6% | $63.55 | 6.4% | $3.57 | 4.4% | 21 |
| T-T | Telus | 4.6% | $28.92 | -2.8% | $1.33 | 6.2% | 18 |
| WCN-N | Waste Connections | 0.7% | $138.33 | 3.2% | $0.92 | 8.9% | 12 |
| Averages | 2.8% | -1.3% | 10.2% | 18 |

