Last updated by BM on September 3, 2024
Summary
This is a weekly installment of our MP Market Review series, which provides updates on the financial markets and Canadian dividend growth companies we monitor on ‘The List’.
- Learning from History is Crucial, But the Future Holds the Profits
- Last week, dividend growth of ‘The List’ stayed the course and has increased by +8.8% YTD (income).
- Last week, the price of ‘The List’ was up again with a return of +11.0% YTD (capital).
- Last week, there were no dividend announcements from companies on ‘The List’.
- Last week, there was one earnings report from a company on ‘The List’.
- This week, two companies on ‘The List’ are due to report earnings.
DGI Clipboard
“You learn from the past, but you make money on the future.”
-Chuck Carnevale
Learning from History is Crucial, But the Future Holds the Profits

It is no secret that you will find that many of the quotes I reference in my articles come from my mentors, Tom Connolly and Chuck Carnevale. The latter being the co-founder of FASTgraphs (Fundamentals Analyzer Software Tool), a popular investment tool that helps investors visualize the relationship between a company’s stock price and its earnings, dividends, and other financial metrics over time.
The quote above encapsulates Mr. Carnevale’s investment philosophy, which emphasizes the importance of learning from historical data and experiences while focusing on future prospects to achieve financial success. It reflects his belief in using past performance as a guide but making investment decisions based on future potential.
Forecasting potential returns can be challenging, especially when it comes to the reliability of the data you use. Our ‘News’ section this week delves deeper into this topic. Rather than guessing or relying on hunches, it’s crucial to calculate reasonable probabilities based on the best information available.
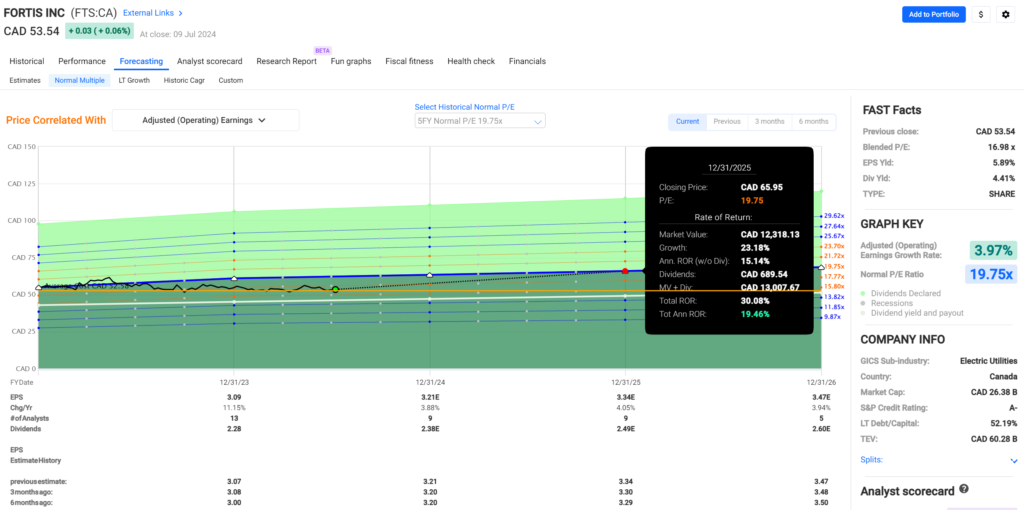
For this reason, we find the forecasting tool within the FASTgraphs application to be an invaluable resource. To illustrate, let’s consider our recent purchase of Fortis Inc. We selected December 31, 2025, as the target date for our forecast. This date is close enough to today to provide an accurate and meaningful analysis.
Here we are looking to answer the question…What rate of return can I reasonably expect to make on an investment today?
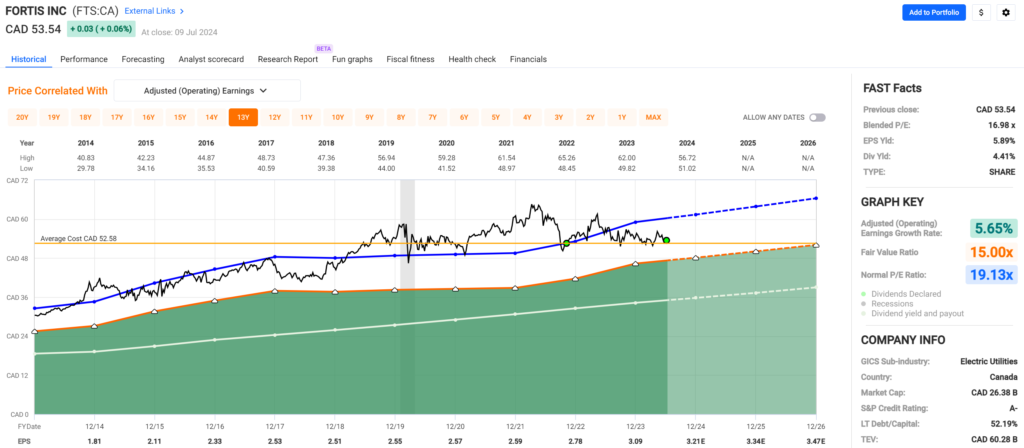
The following colours/lines on the FASTgraphs chart shown below represent:
Black line: Price
Blue line: Normal P/E
Green dot: Purchase price
Red dot: Estimated price at December 31, 2025
Historical Chart

Over the past decade, Fortis Inc.’s stock price has shown a strong correlation with its Normal P/E Ratio. Historically, purchasing shares when the price falls below this Normal P/E Ratio has proven to be a sound investment strategy, particularly for those with a long-term investment horizon.
When using the Forecasting feature in FASTgraphs, it’s essential to choose the appropriate forecasting method. Given the historical correlation between Fortis’s price and its Normal P/E Ratio, we opt for the Normal Multiple method to guide our projections.
Forecast

Next, we select the Historical Normal P/E Ratio to estimate our potential future returns. We prefer the Five-Year Normal Price/Earnings Ratio (5FY Normal P/E of 19.75x) because it offers a more recent and relevant reflection of price versus earnings. After that, we choose the time frame for our forecast. If Fortis Inc. returns to its Normal Five-Year P/E trading range by December 31, 2025, we project an annualized return of 19.46%.
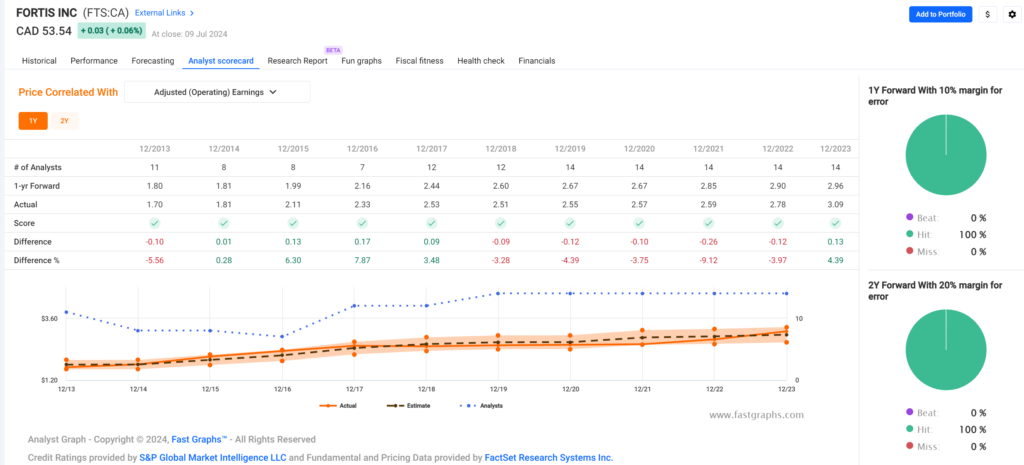
Continuing with the data from the FASTgraphs tool, we move to the Analyst Scorecard. Here, we assess the predictability of earnings and the analysts’ track record for accurately forecasting them.
Analyst Scorecard

The Analyst Scorecard reveals that analysts have shown remarkable accuracy in predicting Fortis Inc.’s one-year and two-year adjusted operating earnings. We’re also encouraged by the fact that 14 analysts currently cover Fortis Inc.
Notably, analysts have achieved a perfect track record (100%) in forecasting earnings over these time frames. Given that our forecast relies on these estimates, we felt confident adding to our position in Fortis Inc. in early July.
Wrap Up
When we purchased Fortis Inc., we already knew it was a quality company trading at a sensible price, per our quality indicators and valuation analysis. The icing on the cake was forecasting a 19.46% annualized return in less than eighteen months.
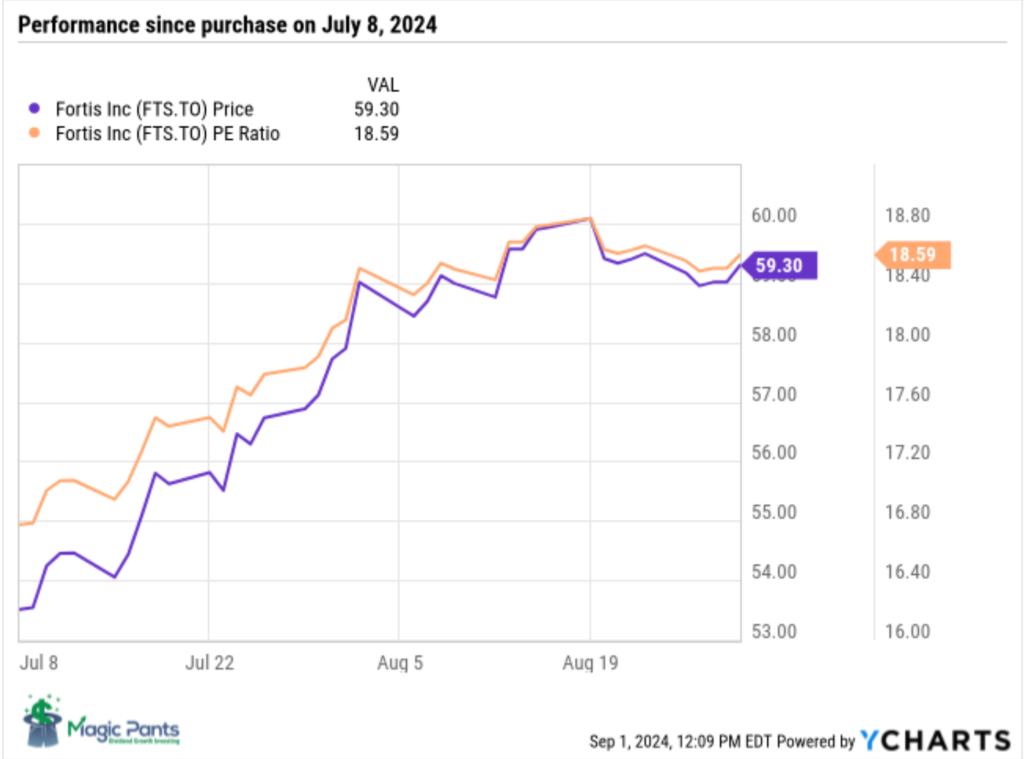
We need to revisit our analysis in December 2025 to test our methodology. The good news is that we are off to a fast start.

DGI Scorecard
The List (2024)
The Magic Pants 2024 list includes 28 Canadian dividend growth stocks. Here are the criteria to be considered a candidate on ‘The List’:
- Dividend growth streak: 10 years or more.
- Market cap: Minimum one billion dollars.
- Diversification: Limit of five companies per sector, preferably two per industry.
- Cyclicality: Exclude REITs and pure-play energy companies due to high cyclicality.
Based on these criteria, companies are added or removed from ‘The List’ annually on January 1. Prices and dividends are updated weekly.
While ‘The List’ is not a standalone portfolio, it functions admirably as an initial guide for those seeking to broaden their investment portfolio and attain superior returns in the Canadian stock market. Our newsletter provides readers with a comprehensive insight into the implementation and advantages of our Canadian dividend growth investing strategy. This evidence-based, unbiased approach empowers DIY investors to outperform both actively managed dividend funds and passively managed indexes and dividend ETFs over longer-term horizons.
For those interested in something more, please upgrade to a paid subscriber; you get the enhanced weekly newsletter, access to premium content, full privileges on the new Substack website magicpants.substack.com and DGI alerts whenever we make stock transactions in our model portfolio.
Performance of ‘The List’
Last week, dividend growth of ‘The List’ stayed the course and has now increased by +8.8% YTD (income).
Last week, the price return of ‘The List’ was up again with a return of +11.0% YTD (capital).
Even though prices may fluctuate, the dependable growth in our income does not. Stay the course. You will be happy you did.
Last week’s best performers on ‘The List’ were Royal Bank of Canada (RY-T), up +4.41%; Thomson Reuters (TRI-N), up +2.97%; and TC Energy Corp. (TRP-T), up +2.51%.
Stantec Inc. (STN-T) was the worst performer last week, down -3.61%.
| SYMBOL | COMPANY | YLD | PRICE | YTD % | DIV | YTD % | STREAK |
|---|---|---|---|---|---|---|---|
| ATD-T | Alimentation Couche-Tard Inc. | 0.9% | $76.93 | 0.2% | $0.70 | 17.4% | 14 |
| BCE-T | Bell Canada | 8.5% | $47.21 | -12.9% | $3.99 | 3.1% | 15 |
| BIP-N | Brookfield Infrastructure Partners | 5.0% | $32.15 | 4.8% | $1.62 | 5.9% | 16 |
| CCL-B-T | CCL Industries Inc. | 1.5% | $77.05 | 33.2% | $1.16 | 9.4% | 22 |
| CNR-T | Canadian National Railway | 2.1% | $158.79 | -4.8% | $3.38 | 7.0% | 28 |
| CTC-A-T | Canadian Tire | 4.6% | $153.64 | 10.9% | $7.00 | 1.4% | 13 |
| CU-T | Canadian Utilities Limited | 5.3% | $34.00 | 5.9% | $1.81 | 0.9% | 52 |
| DOL-T | Dollarama Inc. | 0.3% | $136.50 | 43.7% | $0.35 | 29.5% | 13 |
| EMA-T | Emera | 5.7% | $50.75 | -0.1% | $2.87 | 3.0% | 17 |
| ENB-T | Enbridge Inc. | 6.8% | $54.22 | 12.0% | $3.66 | 3.1% | 28 |
| ENGH-T | Enghouse Systems Limited | 3.4% | $29.39 | -13.5% | $1.00 | 18.3% | 17 |
| FNV-N | Franco Nevada | 1.2% | $122.15 | 10.9% | $1.44 | 5.9% | 16 |
| FTS-T | Fortis Inc. | 4.0% | $59.30 | 8.1% | $2.36 | 3.3% | 50 |
| IFC-T | Intact Financial | 1.9% | $253.63 | 24.7% | $4.84 | 10.0% | 19 |
| L-T | Loblaw Companies Limited | 1.1% | $175.88 | 36.8% | $1.92 | 10.0% | 12 |
| MFC-T | Manulife Financial | 4.3% | $37.21 | 28.8% | $1.60 | 9.6% | 10 |
| MGA-N | Magna | 4.5% | $42.03 | -24.3% | $1.90 | 3.3% | 14 |
| MRU-T | Metro Inc. | 1.6% | $84.66 | 23.6% | $1.34 | 10.7% | 29 |
| RY-T | Royal Bank of Canada | 3.5% | $162.98 | 22.5% | $5.72 | 7.1% | 13 |
| SJ-T | Stella-Jones Inc. | 1.2% | $92.80 | 21.1% | $1.12 | 21.7% | 19 |
| STN-T | Stantec Inc. | 0.7% | $110.37 | 5.5% | $0.83 | 7.8% | 12 |
| T-T | Telus | 7.0% | $21.77 | -8.2% | $1.53 | 7.1% | 20 |
| TD-T | TD Bank | 5.1% | $80.75 | -4.7% | $4.08 | 6.3% | 13 |
| TFII-N | TFI International | 1.1% | $148.13 | 12.9% | $1.60 | 10.3% | 13 |
| TIH-T | Toromont Industries | 1.6% | $120.67 | 7.0% | $1.92 | 11.6% | 34 |
| TRI-N | Thomson Reuters | 1.3% | $171.18 | 19.4% | $2.16 | 10.2% | 30 |
| TRP-T | TC Energy Corp. | 6.2% | $62.42 | 19.3% | $3.84 | 3.2% | 23 |
| WCN-N | Waste Connections | 0.6% | $186.50 | 25.9% | $1.14 | 8.6% | 14 |
| Averages | 3.2% | 11.0% | 8.8% | 21 |
Note: Stocks ending in “-N” declare earnings and dividends in US dollars. To achieve currency consistency between dividends and share price for these stocks, we have shown dividends in US dollars and share price in US dollars (these stocks are listed on a US exchange). The dividends for their Canadian counterparts (-T) would be converted into CDN dollars and would fluctuate with the exchange rate.
Check us out on magicpants.substack.com for more info in this week’s issue….

