Last updated by BM on August 5, 2024
Summary
This is a weekly installment of our MP Market Review series, which provides updates on the financial markets and Canadian dividend growth companies we monitor on ‘The List’.
- Building a Position Size with Our Three-Dot Rule.
- Last week, dividend growth of ‘The List’ stayed the course and has increased by +8.8% YTD (income).
- Last week, the price of ‘The List’ was down with a return of +8.2% YTD (capital).
- Last week, there were no dividend announcements from companies on ‘The List’.
- Last week, there were eleven earnings reports from companies on ‘The List’.
- This week, six companies on ‘The List’ are due to report earnings.
DGI Clipboard
“Success in investing has two parts: finding edge and fully taking advantage of it through proper position sizing. Almost all investment firms focus on edge, while position sizing generally gets much less attention.”
-Michael J. Mauboussin
Building a Position Size with Our Three-Dot Rule

In 2016 Michael J. Mauboussin wrote a paper titled ‘Thirty Years: Reflections on the Ten Attributes of Great Investors’. One of those attributes deals with position sizing.
Mauboussin writes, “success in investing has two parts: finding edge and fully taking advantage of it through proper position sizing. Almost all investment firms focus on edge, while position sizing generally gets much less attention.”
He uses the example of card counting in blackjack as a means to finding an edge and incorporating a betting strategy that takes advantage of it when the cards are in your favor.
As dividend growth investors we already know what our ‘edge’ is…buying quality individual dividend growth companies when they are sensibly priced and holding for the growing income. Our strategy for taking advantage of our ‘edge’ requires further explanation.
Three-Dot Rule:
In our business plan, we detail how we use position sizing to give us an edge with our strategy. We set minimum and maximum sizes for each company on ‘The List’ allocating a higher portion of our portfolio to the highest quality companies, ensuring a solid foundation. However, we avoid reaching the maximum allocation for any position immediately, opting for a more gradual approach.
How we enter/exit positions can be critical to our investment returns in the long term. We prefer to enter our positions incrementally to avoid short-term price drops that can discourage new dividend growth investors and can supercharge our returns if done correctly during market volatility. We like to buy incrementally when entering a position. If the price drops 5-10% and nothing fundamentally changes with the company, we will buy more. If we do decide to sell, we exit gradually: sometimes this leads to an entire exit, sometimes only to a partial exit. We typically apply the three-dot rule, where we only buy a declining stock three times within a short period or sell an overvalued stock three times as its price increases.
Having the discipline to buy/sell more during market inefficiencies is a lesson we learned early on and is truly one of the best ways to outperform the markets over time with our dividend growth investing process.
Three-Dot Example (TRP-T):
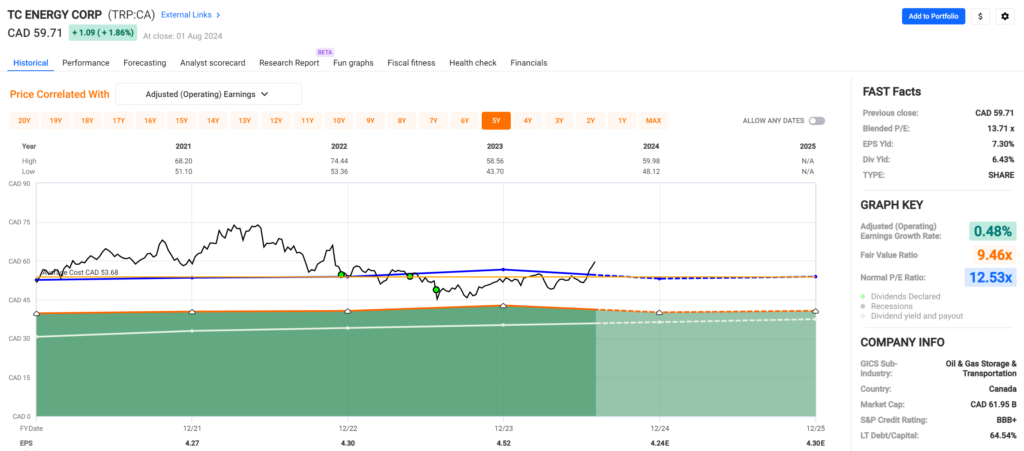
Our entry into a full position size at TC Energy Corp. is detailed below.
We use the Fundamental Analyzer Software Tool (FASTgraphs) to visualize how a company has been historically valued. We like to see it trading within its typical ‘valuation corridor’ based on a ten-to-twelve-year timeline. This gives us a clearer picture of how the stock is traded in different economic cycles.
Using Adjusted Operating Earnings as our valuation metric.
The following colours/lines on the FASTgraphs chart shown below represent:
Black line: Price
White line: Dividend
Orange line: Graham average of usually 15 P/E (price/earnings) for most stocks
Blue line: Normal P/E
Dashed or dotted lines: Estimates only
Green area: Earnings
Green dots: Purchases

Source: FASTgraphs
Over the past eighteen months, we have steadily built our position in TC Energy Corp. within our MP Wealth-Builder Model Portfolio (CDN). Classified as a ‘Core’ company on our list, TC Energy Corp. has a maximum position size of 8% as a guideline.
Following our strategy of buying only at a ‘sensible price’ based on our valuation measures, we initiated a 3.5% position in December 2022 after a selloff in the stock, marking our first dot. In May of last year, after the company announced its Q1 earnings and raised its dividend, we increased our position size to over 6%, marking our second dot. Despite the stock subsequently dropping ~20%, we remained disciplined and continued to follow our process.
Recognizing the continuing undervaluation of this quality company, we increased our position size to a maximum of 8%, marking our third dot. Fast-forward to today. The market for (TRP-T) is currently in rally mode, comfortably above our $53 average cost. Our conviction and discipline prevented us from panicking after the second dot, allowing us to capitalize on the opportunity and enhance our returns.
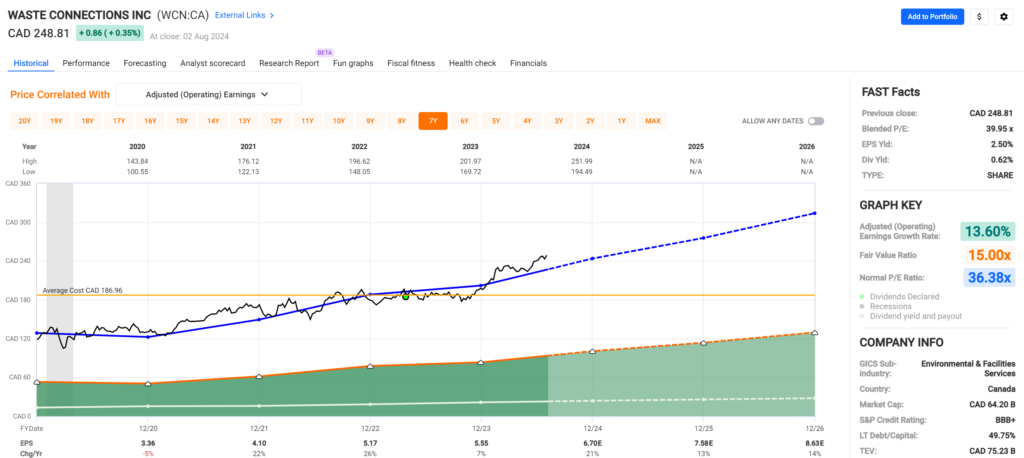
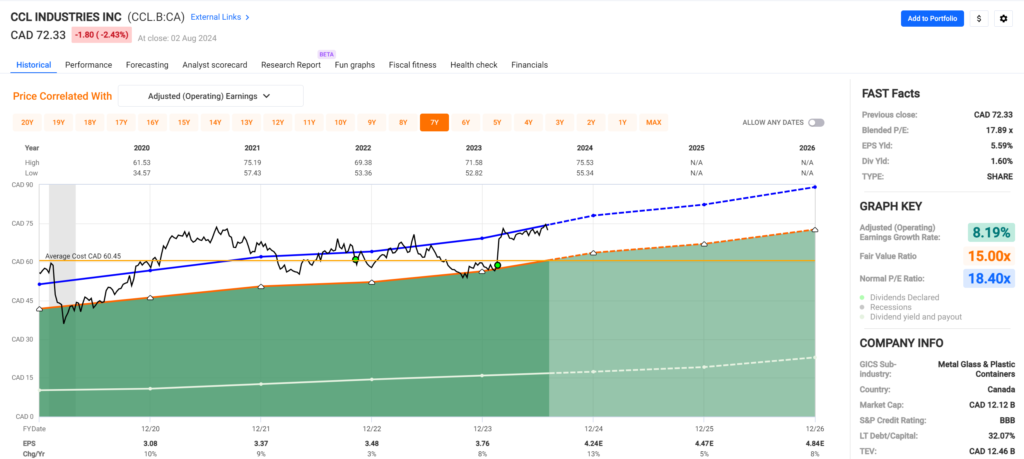
In an ideal scenario, our investment thesis is validated immediately after our initial purchase, meaning the stock price rises quickly. However, the market often takes some time to recognize the potential we see, making two-dot scenarios more common. As observed in our model portfolio, below are examples of both one-dot and two-dot outcomes.
One-Dot Example (WCN-N):

Source: FASTgraphs
Two-Dot Example (CCL-B-T):

Source: FASTgraphs
Regardless of how many dots (incremental trades) it takes to complete your position size, the key is that your original investment thesis is sound—it just may take time for the market to respond. Adhering to our three-dot rule is how dividend growth investors capitalize on market opportunities. This strategy has increased our total returns when building positions in our quality dividend growth companies.
DGI Scorecard
The List (2024)
The Magic Pants 2024 list includes 28 Canadian dividend growth stocks. Here are the criteria to be considered a candidate on ‘The List’:
- Dividend growth streak: 10 years or more.
- Market cap: Minimum one billion dollars.
- Diversification: Limit of five companies per sector, preferably two per industry.
- Cyclicality: Exclude REITs and pure-play energy companies due to high cyclicality.
Based on these criteria, companies are added or removed from ‘The List’ annually on January 1. Prices and dividends are updated weekly.
While ‘The List’ is not a standalone portfolio, it functions admirably as an initial guide for those seeking to broaden their investment portfolio and attain superior returns in the Canadian stock market. Our newsletter provides readers with a comprehensive insight into the implementation and advantages of our Canadian dividend growth investing strategy. This evidence-based, unbiased approach empowers DIY investors to outperform both actively managed dividend funds and passively managed indexes and dividend ETFs over longer-term horizons.
For those interested in something more, please upgrade to a paid subscriber; you get the enhanced weekly newsletter, access to premium content, full privileges on the new Substack website magicpants.substack.com and DGI alerts whenever we make stock transactions in our model portfolio.
Performance of ‘The List’
Last week, dividend growth of ‘The List’ stayed the course and has now increased by +8.8% YTD (income).
Last week, the price return of ‘The List’ was down with a return of +8.2% YTD (capital).
Even though prices may fluctuate, the dependable growth in our income does not. Stay the course. You will be happy you did.
Last week’s best performers on ‘The List’ were Telus (T-T), up +4.97%; Fortis Inc. (FTS-T), up +4.02%; and Enbridge Inc. (ENB-T), up +3.73%.
Magna (MGA-N) was the worst performer last week, down -7.12%.
| SYMBOL | COMPANY | YLD | PRICE | YTD % | DIV | YTD % | STREAK |
|---|---|---|---|---|---|---|---|
| ATD-T | Alimentation Couche-Tard Inc. | 0.9% | $81.76 | 6.5% | $0.70 | 17.4% | 14 |
| BCE-T | Bell Canada | 8.4% | $47.60 | -12.1% | $3.99 | 3.1% | 15 |
| BIP-N | Brookfield Infrastructure Partners | 5.3% | $30.35 | -1.1% | $1.62 | 5.9% | 16 |
| CCL-B-T | CCL Industries Inc. | 1.6% | $72.33 | 25.1% | $1.16 | 9.4% | 22 |
| CNR-T | Canadian National Railway | 2.2% | $155.73 | -6.7% | $3.38 | 7.0% | 28 |
| CTC-A-T | Canadian Tire | 5.0% | $140.45 | 1.3% | $7.00 | 1.4% | 13 |
| CU-T | Canadian Utilities Limited | 5.5% | $32.95 | 2.6% | $1.81 | 0.9% | 52 |
| DOL-T | Dollarama Inc. | 0.3% | $129.57 | 36.4% | $0.35 | 29.5% | 13 |
| EMA-T | Emera | 5.8% | $49.71 | -2.1% | $2.87 | 3.0% | 17 |
| ENB-T | Enbridge Inc. | 7.0% | $52.61 | 8.7% | $3.66 | 3.1% | 28 |
| ENGH-T | Enghouse Systems Limited | 3.3% | $30.12 | -11.3% | $1.00 | 18.3% | 17 |
| FNV-N | Franco Nevada | 1.2% | $125.10 | 13.6% | $1.44 | 5.9% | 16 |
| FTS-T | Fortis Inc. | 4.0% | $59.01 | 7.6% | $2.36 | 3.3% | 50 |
| IFC-T | Intact Financial | 2.0% | $246.76 | 21.4% | $4.84 | 10.0% | 19 |
| L-T | Loblaw Companies Limited | 1.1% | $167.36 | 30.2% | $1.92 | 10.0% | 12 |
| MFC-T | Manulife Financial | 4.7% | $34.29 | 18.7% | $1.60 | 9.6% | 10 |
| MGA-N | Magna | 4.7% | $40.43 | -27.2% | $1.90 | 3.3% | 14 |
| MRU-T | Metro Inc. | 1.7% | $81.19 | 18.5% | $1.34 | 10.7% | 29 |
| RY-T | Royal Bank of Canada | 3.8% | $148.96 | 12.0% | $5.72 | 7.1% | 13 |
| SJ-T | Stella-Jones Inc. | 1.2% | $91.88 | 19.9% | $1.12 | 21.7% | 19 |
| STN-T | Stantec Inc. | 0.7% | $116.87 | 11.7% | $0.83 | 7.8% | 12 |
| T-T | Telus | 6.6% | $23.04 | -2.9% | $1.53 | 7.1% | 20 |
| TD-T | TD Bank | 5.2% | $78.65 | -7.1% | $4.08 | 6.3% | 13 |
| TFII-N | TFI International | 1.1% | $146.88 | 12.0% | $1.60 | 10.3% | 13 |
| TIH-T | Toromont Industries | 1.5% | $124.46 | 10.3% | $1.92 | 11.6% | 34 |
| TRI-N | Thomson Reuters | 1.4% | $157.43 | 9.8% | $2.16 | 10.2% | 30 |
| TRP-T | TC Energy Corp. | 6.5% | $59.29 | 13.3% | $3.84 | 3.2% | 23 |
| WCN-N | Waste Connections | 0.6% | $179.49 | 21.1% | $1.14 | 8.6% | 14 |
| Averages | 3.3% | 8.2% | 8.8% | 21 |
Note: Stocks ending in “-N” declare earnings and dividends in US dollars. To achieve currency consistency between dividends and share price for these stocks, we have shown dividends in US dollars and share price in US dollars (these stocks are listed on a US exchange). The dividends for their Canadian counterparts (-T) would be converted into CDN dollars and would fluctuate with the exchange rate.
Check us out on magicpants.substack.com for more info in this week’s issue….

