Posted by BM on May 25, 2021
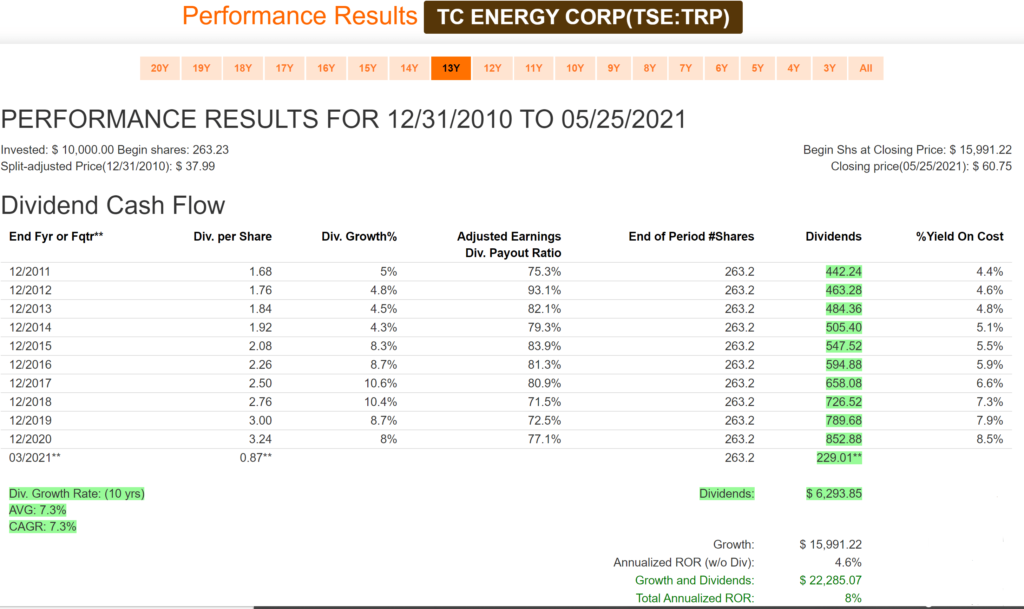
Once we identify that a company is worth digging into deeper, we use FASTgraphs to look at a few dividend performance metrics. The image below is for the previous ten years and we can see that TRP has had an average annual dividend growth rate of 7.3% and a consistent payout ratio in the 75% range. We can also see that TRP has generated over $6000 (on a 10K investment) in income alone. TRP looks like a great income stock with a safe and growing dividend but what about capital growth?

If we take a little closer look at the metrics, we notice that TRP’s annualized Rate of Return (ROR) was 8%. Notice that only 4.6% of that return came from capital growth with the rest coming from the dividend and its growth. With a starting yield of 4.4% and dividend growth of 7.3% you would expect a ROR of close to 12%.
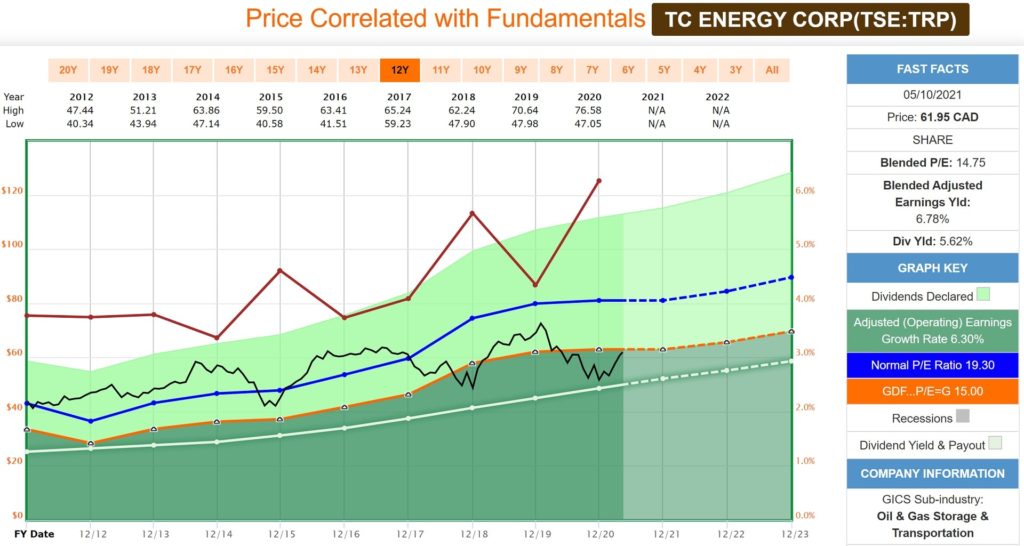
If you look at the Price Chart below (found in Part 1 of this series) you will see that TRP was valued at ~19 P/E in 2012 (near the Blue Line) where today it is close to the Orange Line with a P/E of 15. Had TRP been valued in 2012 at a P/E of 15 then our annualized ROR would be almost 4% higher (50% more). The change in P/E was responsible for the sub-par capital growth.
TRP was overvalued in 2012 and thus future capital/price returns were less going forward. The numbers unravel the mystery.

From the information we have so far, we are getting a clearer picture of when TRP is fairly-valued. We also know the impact on our future returns if we purchase TRP when it is over-valued.
In Part 3 of this series we will use FASTgraphs to estimate future earnings, dividends and their growth rates to see if the future will be the same or better than the past.

