Posted by BM on November 29, 2021
“A stock is not a purchase until it’s yield reaches the buy range established by the stock’s own unique dividend yield history.”
– Anthony Spare, Relative Dividend Yield
How to identify value (sensible price) to maximize the return on our investment is key to our process. How do we know what a sensible price looks like? Dividend yields can help paint a picture for us.
Popularized by Investment Quality Trends (IQT) in the 1960’s, ‘Dividend Yield Theory’ is simple and intuitive. It basically says that for quality dividend growth stocks, meaning those with stable business models that don’t significantly change over time, dividend yields tend to revert to the mean.
What makes ‘Dividend Yield Theory’ simple to understand is that if the current yield is above the ‘historical yield’ (its mean), then the stock is likely undervalued and if it is below, it is likely overvalued.
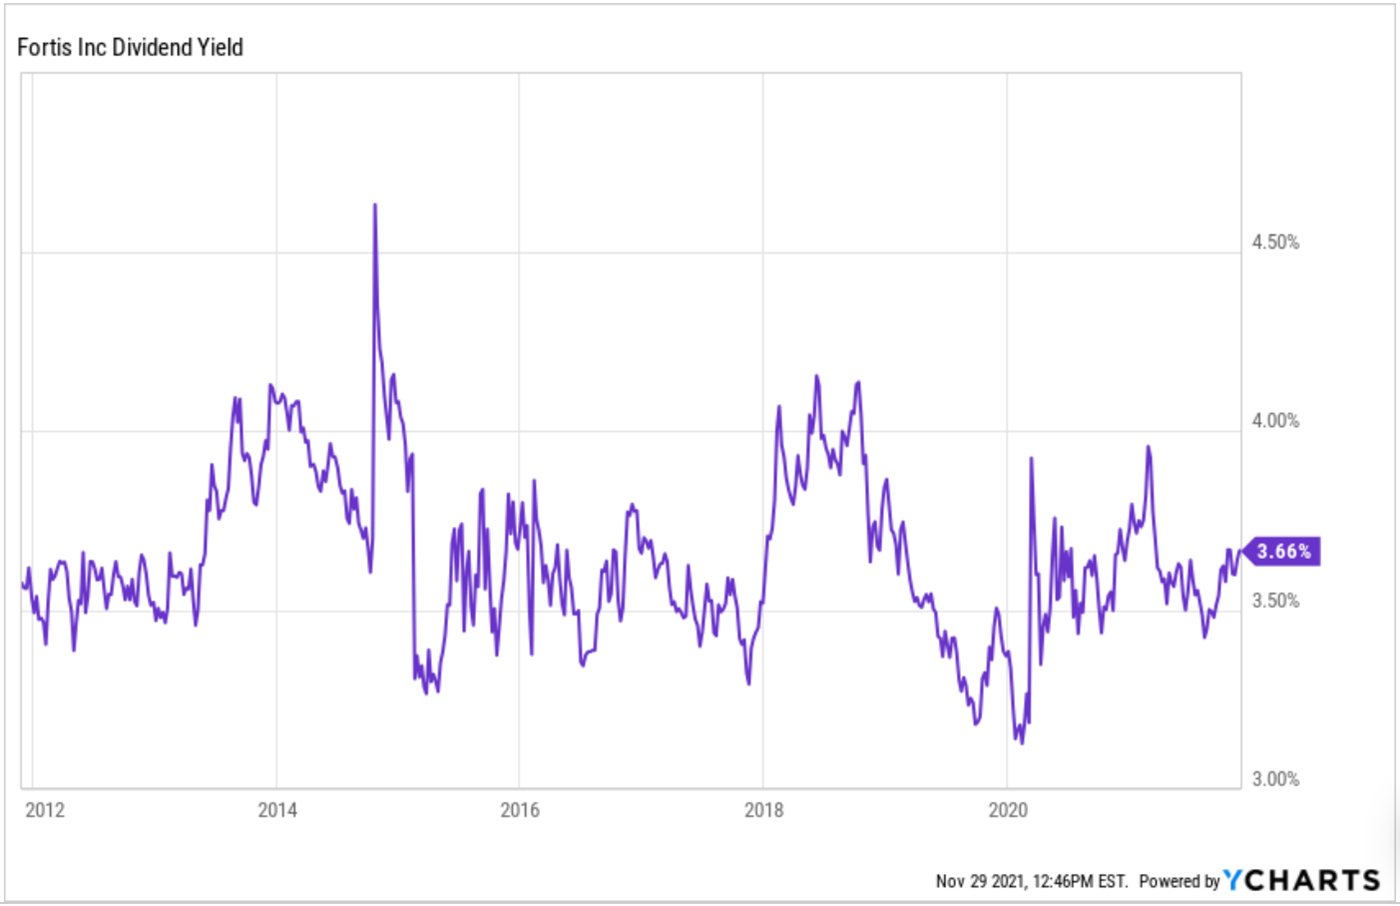
To explain, let’s begin with a yield chart of one of the stock’s on ‘The List’, Fortis Inc. (FTS.TO).
Reviewing a 10 Year Yield Chart is one of the first things we do when we are assessing valuation. We want to know what the stocks yield history looks like and try and determine if there are any repetitive patterns, we should be aware of.
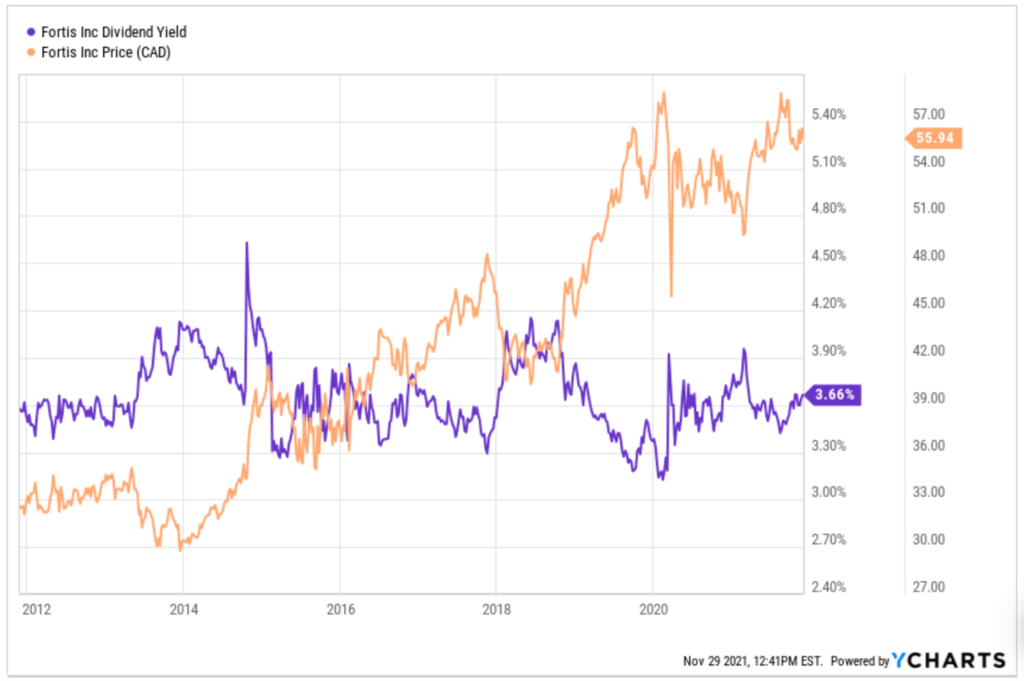
Now let’s add price data to the chart.

First it should be noted that yield and price move in opposite directions. A rising price sends the yield lower, and a falling price sends the yield higher.
Reviewing the yield chart, we can see that Fortis tends to trade between a 3% and 4% dividend yield with very few exceptions. If we were to add an undervalue line it would be at a price when the yield goes above a 4% yield and an overvalue line would be at a price below a 3% yield. Knowing this, you can time your purchases when Fortis approaches or exceeds the undervalue historical yield of 4%.
Another observation from this chart and of ‘Dividend Yield Theory’ in general is that the yield acts as a ‘floor of safety’ with respect to the price. Once the high end of our historical yield is met, investors jump back in looking for the higher yield and the stock’s price reverts from its downward trend and begins to move higher. This is one of the good things about dividend growth stocks in a bear market, they don’t tend to drop as much as the rest of the market and recover faster, primarily because of their yield.
IQT has been successful for almost sixty years using ‘Dividend Yield Theory’ as the cornerstone of their investing methodology. Buy at undervalue, hold through the rising trend, sell at overvalue, rinse, and repeat. They also use similar qualitative characteristics to what we use to screen for only the highest quality companies. Of all the investing newsletters it tracks, Hulbert Financial Digest lists IQT on its Honour Roll, outperforming the S&P 500 index in all time periods.
As dividend growth investors we use ‘Dividend Yield Theory’ as a valuation tool to ensure we purchase at a sensible price and then hold for the growing income. If extreme overvaluation occurs, we may look at trimming our position using ‘Dividend Yield Theory’ as well.
Fortis has a very consistent yield history, so it is a good example of ‘Dividend Yield Theory’ in action. Excessively higher than average yields or yields that stay inflated for long periods of time could point to a problem with the company so be careful about applying ‘Dividend Yield Theory’ to all dividend paying stocks unilaterally. As Anthony Spare’s quote at the top so eloquently points out, “…stocks have their own unique dividend yield history.”
P.S. If Fortis’ yield is similar today to what it was in 2011 and the price has almost doubled what do you think has happened to its dividend?
Hint: Dividend/Price = Yield


