Last updated by BM on January 20, 2026
Summary
Welcome to this week’s MP Market Review – your go-to source for insights and updates on the Canadian dividend growth companies we track on The List! While we’ve expanded our watchlists to include U.S. companies The List-USA, our Canadian lineup remains the cornerstone of our coaching approach.
Don’t miss out on exclusive newsletters and premium content that will help you sharpen your investing strategy. Explore it all at magicpants.substack.com.
Your journey to dividend growth mastery starts here – let’s dive in!
Below is a summary of the metrics and activity from our Canadian watchlist (The List) which we track each week in our newsletter.
- Dividend growth of The List is up already with an average year-to-date return of +1.5% (income).
- The price of The List is also up last week with an average year-to-date return of +1.1% (capital).
- Last week, no company on The List made a dividend announcement.
- Last week, no company on The List released an earnings report.
- This week, no company from The List will report their earnings.
DGI Clipboard
“Current yield, using its own historic yield as a guide, is, in my view, a fine valuation measure.”
— Tom Connolly
Early 2026 Reshuffle: New Names Rise on the Timely Ten

Intro
Our Timely Ten lists remain the fastest way to spot potential value opportunities, which explains why they continue to be the most-read articles every month.
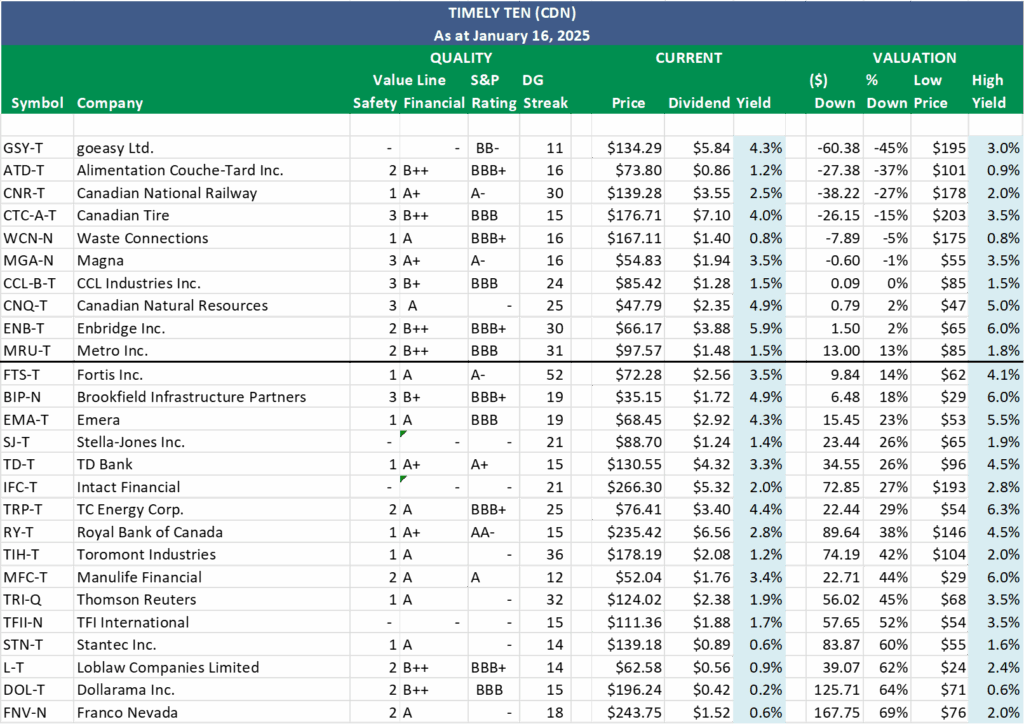
Timely Ten (Canadian version)
With three of the top four candidates from last month’s Timely Ten (CDN) now removed from the 2026 Canadian watchlist, some early-year reshuffling was inevitable.
goeasy Ltd., Alimentation Couche-Tard Inc., and Canadian National Railway have stepped onto the podium, and all three screen as attractive rebound candidates in 2026 based on our valuation metrics. That said, portfolio discipline matters. I am already at my maximum position size in both Couche-Tard and Canadian National Railway within the MP Model Portfolio CDN, which means patience, not action, is the correct move for now. goeasy Ltd. stands out as the most actionable name, as I still have room to add under our position sizing guidelines.
Excluding Canadian Tire, which remains too cyclical for our purposes, the rest of the top ten is compelling. We already own most of these businesses, and in several cases still have capacity to add. The setup is promising, but as always, further research comes first.
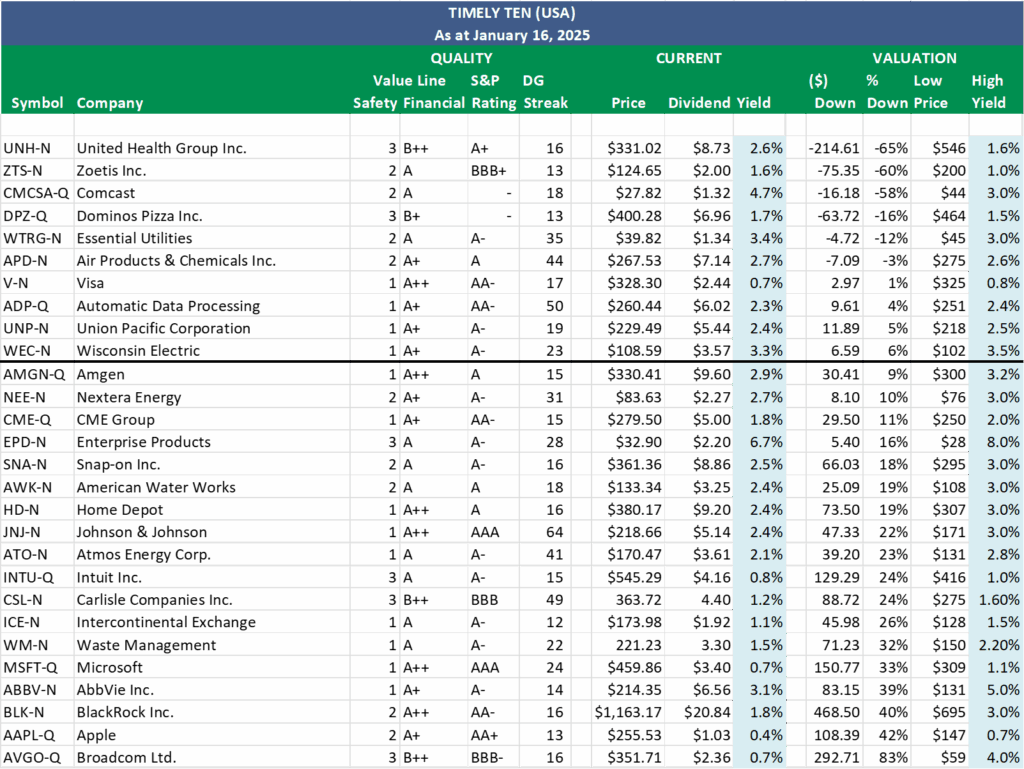
Timely Ten (United States version)
Similar to the Canadian edition, the Timely Ten (USA) saw some reshuffling to start 2026. With two of last month’s candidates removed from the 2026 American watchlist, several names moved meaningfully up and down the rankings.
Two companies stand out this month: Visa and Domino’s Pizza.
Visa jumped from #12 last month to #7, immediately catching our attention. It has been one of the strongest dividend growth and total return performers in the U.S. market over the past fifteen years. High-quality businesses like Visa rarely stay attractively priced for long. With a full position already in the model portfolio, we are on the sidelines, but new investors may want to take a closer look.
Domino’s Pizza remains a company we continue to monitor closely. We have been watching it for over a year but have yet to initiate a position. Recent price weakness reflects a challenging operating environment, as a budget-conscious consumer shifts toward value promotions, which pressure margins and growth, or toward more at-home eating. The long-term value proposition remains compelling, but for now we are not convinced the risk-reward has fully turned in our favour.
As always, the Timely Ten is not a call to action on its own, but a disciplined starting point for deeper research and patient capital deployment.
Here’s a recap on how we select our Timely Ten:
Step three in our process involves monitoring our quality dividend growers regularly, which can become quite challenging depending on the number of companies we track. Fortunately, we rely on ‘The List’ instead of the vast array of stocks in the index, which streamlines our task. Nevertheless, we continually seek methods to enhance our efficiency. Through dividend yield theory, we’ve discovered an approach that has proven remarkably effective in aiding us with our efforts over the years.
Dividend yield theory is a simple and intuitive approach to valuing dividend growth stocks. It suggests that the dividend yield of quality dividend growth stocks tends to revert to the mean over time, assuming that the underlying business model remains stable. In practical terms, if a stock pays a dividend yield above its ten-year average annual yield, its price will likely increase to return the yield to its historical average. Knowing that price and yield go in opposite directions, this theory helps us find stocks poised for a favourable price correction.
We have pre-screened our candidates using the criteria we initially laid out in building our watchlists. This helps us considerably narrow the universe of investable stocks.
- Dividend growth streak: 10 years or more.
- Market cap: Minimum one billion dollars.
- Diversification: Limit of five companies per sector, preferably two per industry.
- Cyclicality: Exclude REITs and pure-play energy companies due to high cyclicality.
Next, we rank our Canadian and American watchlists based on how far each stock’s price is below its fair value (Low Price), as determined by dividend yield theory. To find fair value, divide the current dividend (Dividend) by the stock’s historical high yield (High Yield).
Since price and yield move in opposite directions, a lower price results in a higher yield, and vice versa. The ten companies above the thick black line have a current price (Price) below fair value (Low Price). Put simply, these stocks have a current dividend yield higher than their historically high yield. According to dividend yield theory, these companies are sensibly priced and have the highest probability of a price increase in the short term. These are our Timely Ten.
Takeaway
History shows the Timely Ten is fertile ground for finding attractive entry points into high-quality dividend growers. Whether or not you act on the names, the list serves its purpose: to surface opportunities when quality meets value.
When making investment decisions, always prioritize a company’s ‘quality’ over a ‘sensible price’. For more details on our quality indicators, download our Free Guide to Finding Quality Dividend Growth Stocks here.
Become a paid partner, and I’ll show you exactly how I do it. With real money. In real stocks. In addition, gain full access to this post and exclusive, subscriber-only content. We do the work; you stay in control. Subscribe today and take your dividend growth investing to the next level!
DGI Scorecard
The Magic Pants 2026 list (The List) includes 26 Canadian dividend growth stocks and our new American watchlist (The List-USA) contains 28 companies. Here are the criteria to be considered a candidate on our watchlists:
- Dividend growth streak: 10 years or more.
- Market cap: Minimum one billion dollars.
- Diversification: Limit of five companies per sector, preferably two per industry.
- Cyclicality: Exclude REITs and pure-play energy companies due to high cyclicality.
Based on these criteria, companies are added or removed from ‘The List’ annually on January 1. Prices and dividends are updated weekly.
‘The List’ is not a portfolio but a coaching tool that helps us think about ideas and risk manage our model portfolio. We own some but not all the companies on ‘The List’. In other words, we might want to buy these companies when valuation looks attractive.
Our newsletter provides readers with a comprehensive insight into the implementation and advantages of our Canadian dividend growth investing strategy. This evidence-based, unbiased approach empowers DIY investors to outperform both actively managed dividend funds and passively managed indexes and dividend ETFs over longer-term horizons.
Performance of ‘The List’
Dividend growth of The List starts the year with an average increase YTD of +1.5% (income). These are dividends already announced for 2026.
The price of The List was up last week with an average return YTD of +1.1% (capital).
Top Performers Last Week:
- Canadian Natural Resources (CNQ-T), up +7.10%.
- Franco Nevada (FNV-N), up +6.55%.
- Brookfield Infrastructure Partners (BIP-N), up +4.49%.
Worst Performer Last Week:
- Intact Financial (IFC-T), down -4.48%.
| SYMBOL | COMPANY | YLD | PRICE | YTD % | DIV | YTD % | STREAK |
|---|---|---|---|---|---|---|---|
| ATD-T | Alimentation Couche-Tard Inc. | 1.2% | $73.80 | -2.32% | $0.86 | 4.9% | 16 |
| BIP-N | Brookfield Infrastructure Partners | 4.9% | $35.15 | 2.48% | $1.72 | 0.0% | 19 |
| CCL-B-T | CCL Industries Inc. | 1.5% | $85.42 | -2.57% | $1.28 | 0.0% | 24 |
| CNQ-T | Canadian Natural Resources | 4.9% | $47.79 | 1.42% | $2.35 | 1.1% | 25 |
| CNR-T | Canadian National Railway | 2.5% | $139.28 | 1.09% | $3.55 | 0.0% | 30 |
| CTC-A-T | Canadian Tire | 4.0% | $176.71 | 0.82% | $7.10 | 1.4% | 15 |
| DOL-T | Dollarama Inc. | 0.2% | $196.24 | -4.82% | $0.42 | 0.8% | 15 |
| EMA-T | Emera | 4.3% | $68.45 | 1.26% | $2.92 | 0.0% | 19 |
| ENB-T | Enbridge Inc. | 5.9% | $66.17 | 0.17% | $3.88 | 2.9% | 30 |
| FNV-N | Franco Nevada | 0.6% | $243.75 | 16.86% | $1.52 | 0.0% | 18 |
| FTS-T | Fortis Inc. | 3.5% | $72.28 | 1.45% | $2.56 | 3.0% | 52 |
| GSY-T | goeasy Ltd. | 4.3% | $134.29 | 2.15% | $5.84 | 0.0% | 11 |
| IFC-T | Intact Financial | 2.0% | $266.30 | -6.62% | $5.32 | 0.0% | 21 |
| L-T | Loblaw Companies Limited | 0.9% | $62.58 | 0.79% | $0.56 | 2.1% | 14 |
| MFC-T | Manulife Financial | 3.4% | $52.04 | 4.50% | $1.76 | 0.0% | 12 |
| MGA-N | Magna | 3.5% | $54.83 | 0.31% | $1.94 | 0.0% | 16 |
| MRU-T | Metro Inc. | 1.5% | $97.57 | -1.45% | $1.48 | 0.0% | 31 |
| RY-T | Royal Bank of Canada | 2.8% | $235.42 | 0.36% | $6.56 | 8.6% | 15 |
| SJ-T | Stella-Jones Inc. | 1.4% | $88.70 | 3.02% | $1.24 | 0.0% | 21 |
| STN-T | Stantec Inc. | 0.6% | $139.18 | 5.38% | $0.89 | 0.0% | 14 |
| TD-T | TD Bank | 3.3% | $130.55 | 0.56% | $4.32 | 2.9% | 15 |
| TFII-N | TFI International | 1.7% | $111.36 | 4.48% | $1.88 | 4.4% | 15 |
| TIH-T | Toromont Industries | 1.2% | $178.19 | 6.19% | $2.08 | 0.0% | 36 |
| TRI-Q | Thomson Reuters | 1.9% | $124.02 | -1.85% | $2.38 | 0.0% | 32 |
| TRP-T | TC Energy Corp. | 4.4% | $76.41 | -0.57% | $3.40 | 0.0% | 25 |
| WCN-N | Waste Connections | 0.8% | $167.11 | -4.03% | $1.40 | 8.1% | 16 |
| Averages | 2.6% | 1.1% | 1.5% | 21 |
Note: Stocks ending in “-N or -Q” declare earnings and dividends in US dollars. To achieve currency consistency between dividends and share price for these stocks, we have shown dividends in US dollars and share price in US dollars (these stocks are listed on a US exchange). The dividends for their Canadian counterparts (-T) would be converted into CDN dollars and would fluctuate with the exchange rate.
PAID subscribers enjoy full access to our enhanced weekly newsletter, premium content, and easy-to-follow trade alerts so they can build DGI portfolios alongside ours. This service provides the resources to develop your DGI business plan confidently. We do the work; you stay in control!
It truly is the subscription that pays dividends!
The greatest investment you can make is in yourself. Are you ready to take that step?
For more articles and the full newsletter, check us out on magicpants.substack.com.
