Last updated by BM on February 11, 2025
Summary
Welcome to this week’s MP Market Review – your go-to source for insights and updates on the Canadian dividend growth companies we track on ‘The List’! While we’ve expanded our watchlists to include U.S. companies (The List-USA), our Canadian lineup remains the cornerstone of our coaching approach.
Don’t miss out on exclusive newsletters and premium content that will help you sharpen your investing strategy. Explore it all at magicpants.substack.com.
Your journey to dividend growth mastery starts here – let’s dive in!
- Last week, dividend growth was up, with an average return of +3.6% YTD (income).
- Last week, the price of ‘The List’ was down from the previous week with an average return of +0.96% YTD (capital).
- Last week, there was one dividend announcement made by companies on ‘The List’.
- Last week, there were two earnings reports from companies on ‘The List’.
- This week, ten companies on ‘The List’ are due to report earnings.
DGI Clipboard
“The two greatest drivers of stock returns are dividend yields and earnings growth. Everything else is speculation.”
– John Bogle
How Dividend Growth Predicts Future Stock Returns – A Decade of Evidence

Intro
Below is our decade-long CAGR dividend data spreadsheet, with dividends year-by-year from January 1, 2015, to January 1, 2025 and their corresponding returns.
This year brings an added layer of insight with the inclusion of our list of American dividend growth companies, now featured on the blog.
As successful dividend growth investors, we understand that rising dividends lay the foundation for higher share prices. To illustrate this, we highlight in blue the ten-year columns showing the compound annual growth rate (CAGR 10Y) of total return (TR), dividend growth (DG), and price growth (PG) for stocks on our lists. The data speaks for itself—when dividends grow, so does the price.
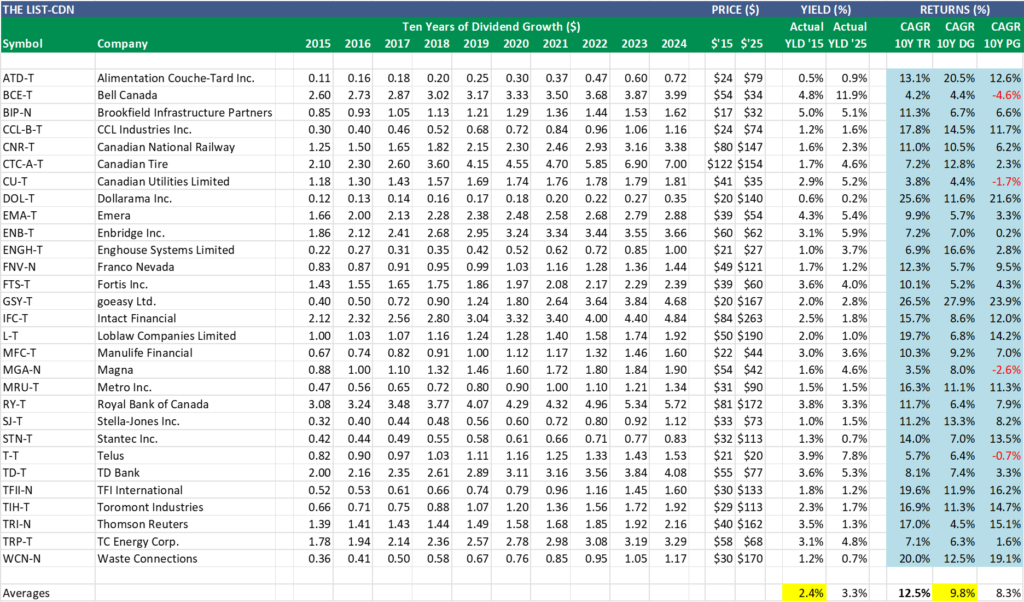
12.5% – the average 10-year compound annual growth rate (CAGR) of total return (includes dividends) for companies on ‘The List-CDN’ (Canada).
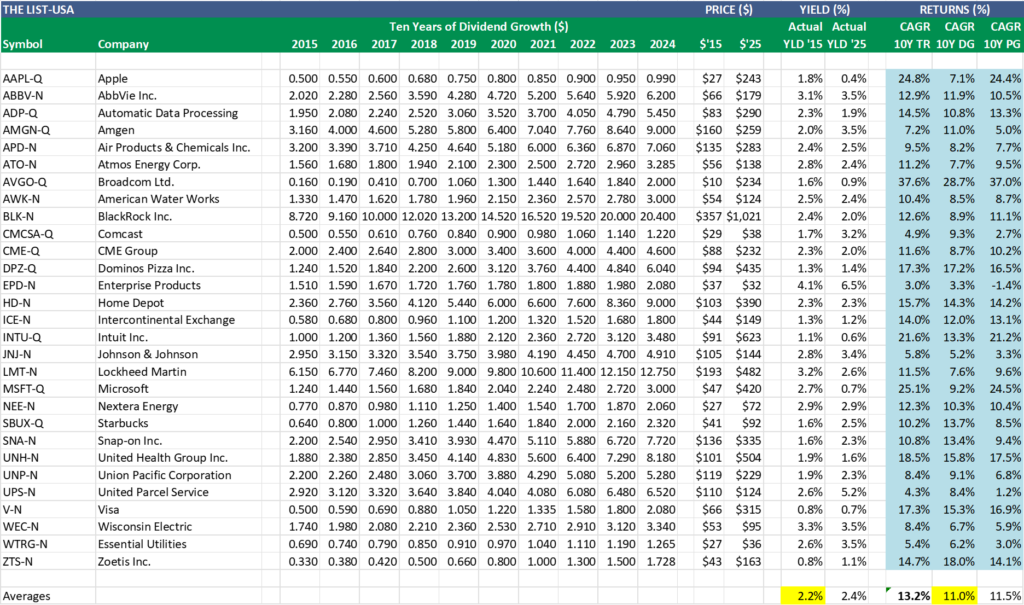
13.2% – the average 10-year compound annual growth rate (CAGR) of total return (includes dividends) for companies on ‘The List-USA’ (United States).
Our simple formula
Not only did our lists outperform the market (indexes), but the predictability of our strategy was uncanny.
In both charts, I’ve highlighted the average starting yield on January 1, 2015 (Actual YLD ‘15) and the average annualized dividend growth rate (CAGR 10Y DG) to demonstrate the predictability of long-term returns. Combined, these two closely align with the average annualized total returns (CAGR 10Y TR) for Canadian and U.S. Lists.
When building a dividend growth investing (DGI) portfolio with high-quality individual stocks, you always know your starting yield and can reasonably estimate future dividend growth. With these two factors, predicting long-term total returns becomes much simpler.
For demonstration purposes, all beginning prices (Price $’15) assume an equal-weighted purchase of each stock on January 1, 2015, and holding through January 1, 2025 (Price $’25).
However, our model portfolio approach doesn’t involve buying every company on our watchlists at once or in equal position sizes. Instead, we invest gradually, adding positions when valuations are favourable. This disciplined approach increases the probability that our total returns will exceed those shown in the charts.
Wrap Up
It doesn’t matter whether your dividend growth portfolio is built with Canadian or American companies—both follow the same pattern of predictable long-term returns. This consistency allows us to plan for retirement with a level of confidence that few other strategies can match.
Revisit the retirement projection spreadsheets from the past two weeks’ MP Market Reviews. You’ll see how we use starting yield and dividend growth to forecast income and capital growth. The numbers speak for themselves—dividends drive returns, and predictability is our greatest advantage.
For a more guided approach, when building your DGI portfolio consider becoming a PAID subscriber to unlock access to DGI Alerts. These alerts notify you whenever we make a trade in our model portfolios, allowing you to invest alongside us with confidence. We do the work, and you stay in control!
DGI Scorecard
The List (2025)
The Magic Pants 2025 list includes 29 Canadian dividend growth stocks. Here are the criteria to be considered a candidate on ‘The List’:
- Dividend growth streak: 10 years or more.
- Market cap: Minimum one billion dollars.
- Diversification: Limit of five companies per sector, preferably two per industry.
- Cyclicality: Exclude REITs and pure-play energy companies due to high cyclicality.
Based on these criteria, companies are added or removed from ‘The List’ annually on January 1. Prices and dividends are updated weekly.
‘The List’ is not a portfolio but a coaching tool that helps us think about ideas and risk manage our model portfolio. We own some but not all the companies on ‘The List’. In other words, we might want to buy these companies when valuation looks attractive.
Our newsletter provides readers with a comprehensive insight into the implementation and advantages of our Canadian dividend growth investing strategy. This evidence-based, unbiased approach empowers DIY investors to outperform both actively managed dividend funds and passively managed indexes and dividend ETFs over longer-term horizons.
For those interested in something more, please upgrade to a paid subscriber; you get the enhanced weekly newsletter, access to premium content, full privileges on the new Substack website magicpants.substack.com and DGI alerts whenever we make stock transactions in our model portfolio.
Performance of ‘The List’
Last week, dividend growth was up, with an average return of +3.6% YTD (income).
Last week, the price of ‘The List’ was down from the previous week with an average YTD return of +0.96% (capital).
Even though prices may fluctuate, the dependable growth in our income does not. Stay the course. You will be happy you did.
Last week’s best performers on ‘The List’ were Intact Financial (IFC-T), up +7.20%; Thomson Reuters (TRI-N), up +4.99%; and Franco Nevada (FNV-N), up +3.92%.
Bell Canada (BCE-T) was the worst performer last week, down -8.64%.
| SYMBOL | COMPANY | YLD | PRICE | YTD % | DIV | YTD % | STREAK |
|---|---|---|---|---|---|---|---|
| ATD-T | Alimentation Couche-Tard Inc. | 1.0% | $74.52 | -5.73% | $0.78 | 8.3% | 15 |
| BCE-T | Bell Canada | 12.6% | $31.62 | -5.67% | $3.99 | 0.0% | 16 |
| BIP-N | Brookfield Infrastructure Partners | 5.2% | $33.27 | 4.43% | $1.72 | 6.2% | 17 |
| CCL-B-T | CCL Industries Inc. | 1.7% | $69.00 | -6.28% | $1.16 | 0.0% | 23 |
| CNR-T | Canadian National Railway | 2.4% | $145.02 | -1.20% | $3.55 | 5.0% | 29 |
| CTC-A-T | Canadian Tire | 4.6% | $155.57 | 1.21% | $7.10 | 1.4% | 14 |
| CU-T | Canadian Utilities Limited | 5.4% | $33.72 | -3.05% | $1.83 | 1.0% | 53 |
| DOL-T | Dollarama Inc. | 0.3% | $139.55 | -0.46% | $0.37 | 5.1% | 14 |
| EMA-T | Emera | 5.2% | $55.65 | 3.96% | $2.90 | 0.7% | 18 |
| ENB-T | Enbridge Inc. | 5.9% | $63.51 | 2.65% | $3.77 | 3.0% | 29 |
| ENGH-T | Enghouse Systems Limited | 3.7% | $27.81 | 2.77% | $1.04 | 4.0% | 18 |
| FNV-N | Franco Nevada | 1.1% | $141.29 | 16.64% | $1.52 | 5.6% | 17 |
| FTS-T | Fortis Inc. | 4.0% | $62.16 | 4.26% | $2.46 | 3.1% | 51 |
| GSY-T | goeasy Ltd. | 2.8% | $167.00 | -0.10% | $4.68 | 0.0% | 10 |
| IFC-T | Intact Financial | 1.7% | $276.73 | 5.23% | $4.84 | 0.0% | 20 |
| L-T | Loblaw Companies Limited | 1.1% | $178.47 | -6.18% | $2.05 | 7.0% | 13 |
| MFC-T | Manulife Financial | 3.7% | $43.06 | -2.00% | $1.60 | 0.0% | 11 |
| MGA-N | Magna | 4.9% | $38.62 | -7.47% | $1.90 | 0.0% | 15 |
| MRU-T | Metro Inc. | 1.6% | $91.73 | 1.73% | $1.48 | 10.4% | 30 |
| RY-T | Royal Bank of Canada | 3.5% | $170.44 | -1.06% | $5.92 | 3.5% | 14 |
| SJ-T | Stella-Jones Inc. | 1.6% | $69.15 | -5.26% | $1.12 | 0.0% | 20 |
| STN-T | Stantec Inc. | 0.8% | $109.59 | -3.11% | $0.84 | 1.8% | 13 |
| T-T | Telus | 7.8% | $20.58 | 4.84% | $1.61 | 5.2% | 21 |
| TD-T | TD Bank | 5.1% | $82.81 | 8.25% | $4.20 | 2.9% | 14 |
| TFII-N | TFI International | 1.4% | $129.27 | -2.52% | $1.80 | 12.5% | 14 |
| TIH-T | Toromont Industries | 1.6% | $116.42 | 2.94% | $1.92 | 0.0% | 35 |
| TRI-N | Thomson Reuters | 1.3% | $176.64 | 8.78% | $2.38 | 10.2% | 31 |
| TRP-T | TC Energy Corp. | 4.9% | $66.95 | -1.86% | $3.29 | 0.0% | 24 |
| WCN-N | Waste Connections | 0.7% | $190.23 | 11.96% | $1.26 | 7.7% | 15 |
| Averages | 3.4% | 0.96% | 3.6% | 21 |
Note: Stocks ending in “-N” declare earnings and dividends in US dollars. To achieve currency consistency between dividends and share price for these stocks, we have shown dividends in US dollars and share price in US dollars (these stocks are listed on a US exchange). The dividends for their Canadian counterparts (-T) would be converted into CDN dollars and would fluctuate with the exchange rate.
PAID subscribers enjoy full access to our enhanced weekly newsletter, premium content, and easy-to-follow trade alerts so they can build DGI portfolios alongside ours. This service provides the resources to develop your DGI business plan confidently. We do the work; you stay in control!
It truly is the subscription that pays dividends!
The greatest investment you can make is in yourself. Are you ready to take that step?
For more articles and the full newsletter, check us out on magicpants.substack.com.
