Last updated by BM on November 26, 2024
Summary
This is a weekly installment of our MP Market Review series, which provides insights and updates on Canadian dividend growth companies we monitor on ‘The List’. To read all our newsletters and premium content be sure to check us out on magicpants.substack.com.
- This week, we ask: Should retirees choose dividend stocks over bonds?
- Last week, dividend growth of ‘The List’ stayed the course and has increased by +9.1% YTD (income).
- Last week, the price of ‘The List’ was up with a return of +13.6% YTD (capital).
- Last week, there were no dividend announcements from companies on ‘The List’.
- Last week, there was an earnings report from a company on ‘The List’.
- This week, one company on ‘The List’ is due to report earnings.
DGI Clipboard
“Cash is not a safe investment, is not a safe place because it will be taxed by inflation.”
– Ray Dalio
The Question Isn’t When You Retire But How!

Intro
A couple of months ago, in the ‘DGI Clipboard’ section of our weekly newsletter, I wrote about How to Own Inflation: Why Dividend Growth is the True Hedge. In that article, I demonstrated how inflation erodes purchasing power and explained why owning a portfolio of dividend growth stocks is one of the best ways to combat this challenge. Unlike bonds and T-bills, which don’t grow their income over time, a dividend growth portfolio not only increases its income but appreciates in value—this was the key point we emphasized.
This week, The Globe and Mail published a column exploring a similar theme. It compared the performance of dividend growth stocks to bonds and T-bills over the past 25 years, posing the question: Should retirees buy dividend stocks instead of bonds?
First a little column background:
To answer the question with historical data, the author picked the year 1999 as a starting point and created both a bond portfolio and a stock portfolio. This year was particularly favorable for government bonds, as yields were high and on a downward trajectory, benefiting bond prices. However, it was a challenging starting point for stocks due to the significant market disruptions that followed: the dot-com bubble burst in 2001-2002, the Great Recession of 2008-2009, and the sharp but short-lived market downturn during the early months of the COVID-19 pandemic.
The $50,000 stock portfolio was allocated across three companies: BCE-T (a telecom), TD-T (a Big Five bank), and ENB-T (a pipeline in the energy sector). While not necessarily the top performers in their sectors, these companies were chosen for their reputation as reliable dividend payers and provided some diversification.
The bond portfolio also consisted of $50,000, invested in long-term Canadian government bonds purchased in 1999. At the time, these bonds offered a yield of over 6%, which was locked in for the full 25-year term.
As a third option, the author also included 91-day Treasury bills (T-bills).
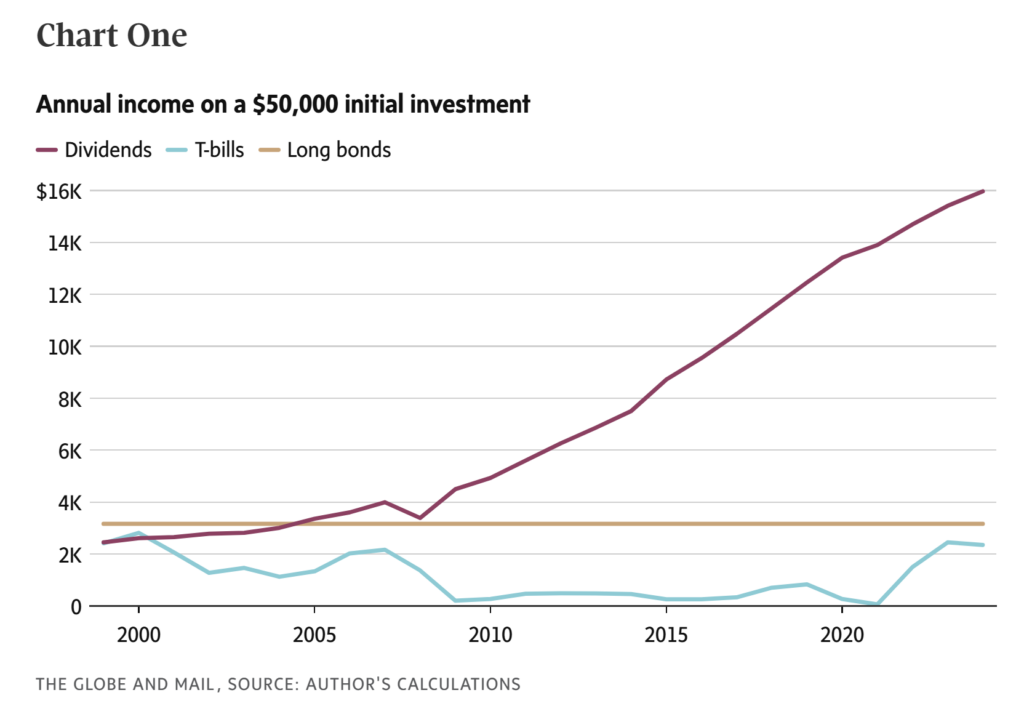
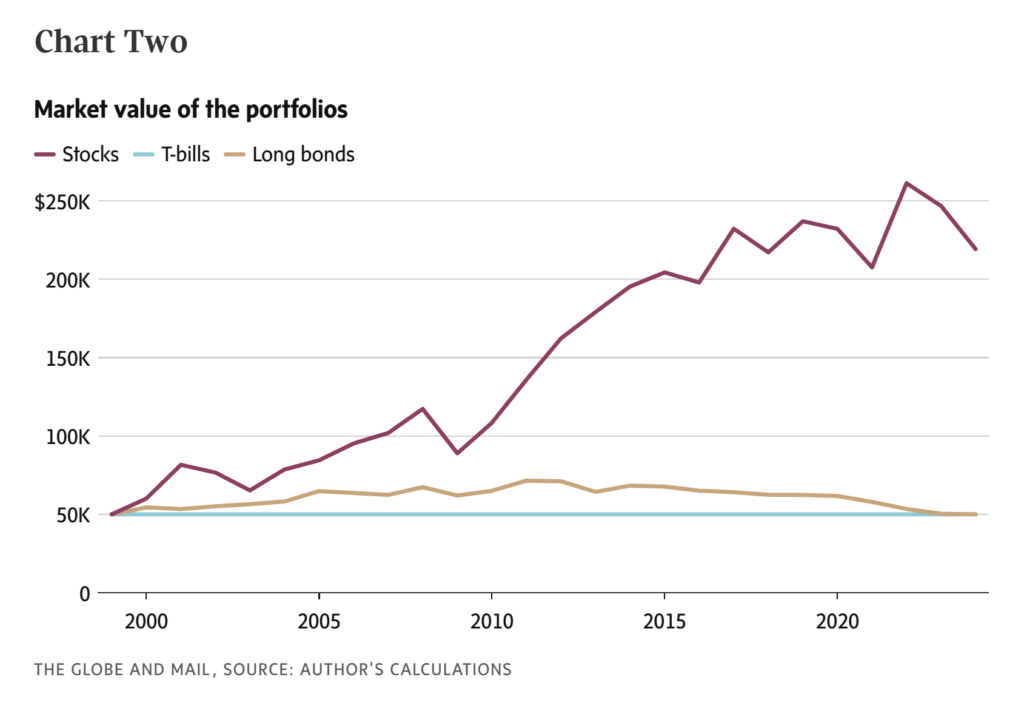
The author brilliantly proves his point with just two charts, leaving you to question the appeal of fixed income for long-term retirement investing.


Stocks (dividend growth stocks) are the clear winner in both income and capital growth. We already know it’s the growing income/yield that drives total return. Soon many others will do what we do.
By year 25, your initial $50K investment yields $16K annually in dividends—a 32% return on the original amount in this year alone—and it’s still growing!
Wrap Up
The charts in this article can be replicated for any period over the last twenty years using other quality dividend growth stocks from ‘The List.’ While we don’t recommend holding just three stocks, a diversified portfolio of 15-20 quality dividend growers would yield similar results. There is no need for an ETF, a wealth manager or an adviser.
Investing in the stock market doesn’t have to be a high-risk endeavor. Our growing yield strategy is ‘how’ to play the long-term horizon of retirement investing. Purchasing individual, quality dividend growth stocks at sensible valuations and holding them for their steadily growing income remains one of the most effective strategies to preserve purchasing power and achieve above-average total returns.
The complete Globe and Mail article referenced above is available for Globe subscribers in the ‘DGI News’ section later in this newsletter.
DGI Scorecard
The List (2024)
The Magic Pants 2024 list includes 28 Canadian dividend growth stocks. Here are the criteria to be considered a candidate on ‘The List’:
- Dividend growth streak: 10 years or more.
- Market cap: Minimum one billion dollars.
- Diversification: Limit of five companies per sector, preferably two per industry.
- Cyclicality: Exclude REITs and pure-play energy companies due to high cyclicality.
Based on these criteria, companies are added or removed from ‘The List’ annually on January 1. Prices and dividends are updated weekly.
‘The List’ is not a portfolio; it is a coaching tool that helps us think about ideas and risk manage our model portfolio. We own some but not all the companies on ‘The List’.
Our newsletter provides readers with a comprehensive insight into the implementation and advantages of our Canadian dividend growth investing strategy. This evidence-based, unbiased approach empowers DIY investors to outperform both actively managed dividend funds and passively managed indexes and dividend ETFs over longer-term horizons.
For those interested in something more, please upgrade to a paid subscriber; you get the enhanced weekly newsletter, access to premium content, full privileges on the new Substack website magicpants.substack.com and DGI alerts whenever we make stock transactions in our model portfolio.
Performance of ‘The List’
Last week, dividend growth of ‘The List’ stayed the course and has increased by +9.1% YTD (income). How much did your salary go up this year?
Last week, the average price return of ‘The List’ was up with a return of +13.6% YTD (capital).
Even though prices may fluctuate, the dependable growth in our income does not. Stay the course. You will be happy you did.
Last week’s best performers on ‘The List’ were Franco Nevada (FNV-N), up +8.55%; Metro Inc. (MRU-T), up +3.76%; and Stella-Jones Inc. (SJ-T), up +3.71%.
Canadian Tire (CTC-A-T) was the worst performer last week, down -1.82%.
| SYMBOL | COMPANY | YLD | PRICE | YTD % | DIV | YTD % | STREAK |
|---|---|---|---|---|---|---|---|
| ATD-T | Alimentation Couche-Tard Inc. | 0.9% | $78.59 | 2.4% | $0.70 | 17.4% | 14 |
| BCE-T | Bell Canada | 10.7% | $37.42 | -30.9% | $3.99 | 3.1% | 15 |
| BIP-N | Brookfield Infrastructure Partners | 4.7% | $34.74 | 13.2% | $1.62 | 5.9% | 16 |
| CCL-B-T | CCL Industries Inc. | 1.5% | $77.68 | 34.3% | $1.16 | 9.4% | 22 |
| CNR-T | Canadian National Railway | 2.2% | $155.44 | -6.8% | $3.38 | 7.0% | 28 |
| CTC-A-T | Canadian Tire | 4.7% | $150.16 | 8.3% | $7.00 | 1.4% | 13 |
| CU-T | Canadian Utilities Limited | 5.0% | $36.10 | 12.4% | $1.81 | 0.9% | 52 |
| DOL-T | Dollarama Inc. | 0.2% | $145.51 | 53.1% | $0.35 | 30.7% | 13 |
| EMA-T | Emera | 5.5% | $51.92 | 2.2% | $2.88 | 3.3% | 17 |
| ENB-T | Enbridge Inc. | 6.1% | $60.47 | 24.9% | $3.66 | 3.1% | 28 |
| ENGH-T | Enghouse Systems Limited | 3.4% | $29.27 | -13.8% | $1.00 | 18.3% | 17 |
| FNV-N | Franco Nevada | 1.2% | $123.69 | 12.3% | $1.44 | 5.9% | 16 |
| FTS-T | Fortis Inc. | 3.8% | $63.13 | 15.1% | $2.39 | 4.4% | 50 |
| IFC-T | Intact Financial | 1.8% | $271.68 | 33.6% | $4.84 | 10.0% | 19 |
| L-T | Loblaw Companies Limited | 1.1% | $178.29 | 38.7% | $1.92 | 10.0% | 12 |
| MFC-T | Manulife Financial | 3.5% | $45.37 | 57.1% | $1.60 | 9.6% | 10 |
| MGA-N | Magna | 4.2% | $45.08 | -18.8% | $1.90 | 3.3% | 14 |
| MRU-T | Metro Inc. | 1.5% | $89.73 | 31.0% | $1.34 | 10.7% | 29 |
| RY-T | Royal Bank of Canada | 3.3% | $174.71 | 31.3% | $5.72 | 7.1% | 13 |
| SJ-T | Stella-Jones Inc. | 1.6% | $70.69 | -7.7% | $1.12 | 21.7% | 19 |
| STN-T | Stantec Inc. | 0.7% | $120.06 | 14.7% | $0.83 | 7.8% | 12 |
| T-T | Telus | 7.2% | $21.26 | -10.4% | $1.53 | 7.1% | 20 |
| TD-T | TD Bank | 5.2% | $78.51 | -7.3% | $4.08 | 6.3% | 13 |
| TFII-N | TFI International | 1.1% | $148.73 | 13.4% | $1.60 | 10.3% | 13 |
| TIH-T | Toromont Industries | 1.6% | $116.74 | 3.5% | $1.92 | 11.6% | 34 |
| TRI-N | Thomson Reuters | 1.3% | $161.20 | 12.5% | $2.16 | 12.5% | 30 |
| TRP-T | TC Energy Corp. | 5.5% | $69.65 | 33.1% | $3.84 | 3.2% | 23 |
| WCN-N | Waste Connections | 0.6% | $189.87 | 28.2% | $1.17 | 11.4% | 14 |
| Averages | 3.2% | 13.6% | 9.1% | 21 |
Note: Stocks ending in “-N” declare earnings and dividends in US dollars. To achieve currency consistency between dividends and share price for these stocks, we have shown dividends in US dollars and share price in US dollars (these stocks are listed on a US exchange). The dividends for their Canadian counterparts (-T) would be converted into CDN dollars and would fluctuate with the exchange rate.
PAID subscribers enjoy full access to our enhanced weekly newsletter, premium content, and easy-to-follow trade alerts so they can build DGI portfolios alongside ours. This service provides the resources to develop your DGI business plan confidently. We do the work; you stay in control!
It truly is the subscription that pays dividends!
The greatest investment you can make is in yourself. Are you ready to take that step?
For more articles and the full newsletter, check us out on magicpants.substack.com.

