Last updated by BM on September 17, 2024
Summary
This is a weekly installment of our MP Market Review series, which provides updates on the financial markets and Canadian dividend growth companies we monitor on ‘The List’.
- This week we share ‘How a Strategic Plan Drives Our Investing Success’.
- Last week, dividend growth of ‘The List’ stayed the course and has increased by +8.8% YTD (income).
- Last week, the price of ‘The List’ was up with a return of +13.0% YTD (capital).
- Last week, there were no dividend announcements from companies on ‘The List’.
- Last week, there was one earnings report from a company on ‘The List’.
- This week, no companies on ‘The List’ are due to report earnings.
DGI Clipboard
“The best way to measure your investing success is not by whether you’re beating the market but by whether you’ve put in place a financial plan and a behavioral discipline that are likely to get you where you want to go.”
– Ben Graham, The Intelligent Investor
Beyond Stock Picking: How a Strategic Plan Drives Our Investing Success

As a dividend growth investor, I’ve always focused on evaluating my performance from a portfolio perspective rather than fixating on individual stock selections. Viewing your portfolio performance in aggregate and maintaining a long-term outlook helps keep you grounded, ensuring you stay committed to your process rather than dwelling on the highs and lows.
Periodically, I review my past trades to assess how my portfolio has performed over time and how my original process is working. While the MP Wealth-Builder Model Portfolio (CDN) is relatively new, my journey in dividend growth investing (DGI) began in 2012. Below, I share some key insights from my Canadian DGI portfolio during that time.
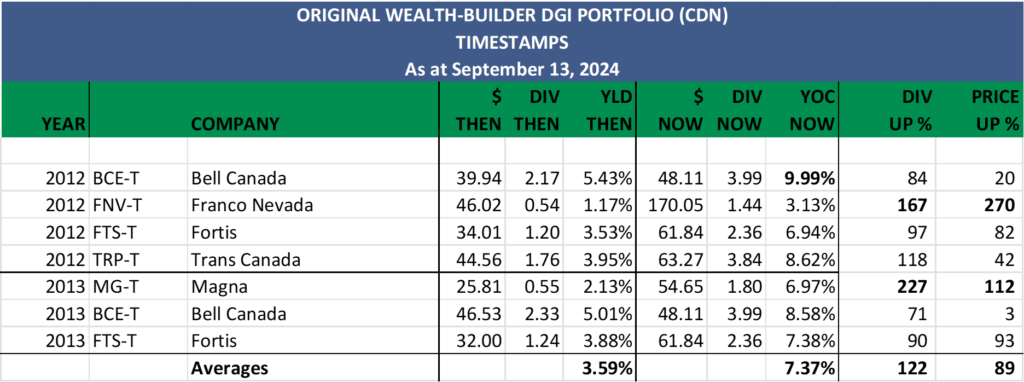
Although the sample size is small, with only seven trades, the data offers several key takeaways that should inspire confidence in those new to our strategy and process.
First, both our dividends and capital have seen remarkable growth. On average, our dividend income has surged by 122%, while our capital has appreciated by 89%. Notably, two of the five stocks in our portfolio have earned a place in the exclusive “double-double” club, and the overall portfolio is nearing this milestone. A company qualifies for our “double-double” club when both its income and capital have doubled from the original investment.
Second, our dividend return has reached 7.37% on the original capital invested over a decade ago—and it’s still growing. This means we’re now outperforming the historical average return of the stock market (~7%) based on dividends alone.
Lastly, we’ve achieved all this despite the price of one of our key holdings, Bell Canada, remaining relatively flat during this period.
As Ben Graham wisely said, I believe we’ve “…put in place a financial plan and a behavioral discipline that are likely to get you where you want to go.”
DGI Scorecard
The List (2024)
The Magic Pants 2024 list includes 28 Canadian dividend growth stocks. Here are the criteria to be considered a candidate on ‘The List’:
- Dividend growth streak: 10 years or more.
- Market cap: Minimum one billion dollars.
- Diversification: Limit of five companies per sector, preferably two per industry.
- Cyclicality: Exclude REITs and pure-play energy companies due to high cyclicality.
Based on these criteria, companies are added or removed from ‘The List’ annually on January 1. Prices and dividends are updated weekly.
While ‘The List’ is not a standalone portfolio, it functions admirably as an initial guide for those seeking to broaden their investment portfolio and attain superior returns in the Canadian stock market. Our newsletter provides readers with a comprehensive insight into the implementation and advantages of our Canadian dividend growth investing strategy. This evidence-based, unbiased approach empowers DIY investors to outperform both actively managed dividend funds and passively managed indexes and dividend ETFs over longer-term horizons.
For those interested in something more, please upgrade to a paid subscriber; you get the enhanced weekly newsletter, access to premium content, full privileges on the new Substack website magicpants.substack.com and DGI alerts whenever we make stock transactions in our model portfolio.
Performance of ‘The List’
Last week, dividend growth of ‘The List’ stayed the course and has now increased by +8.8% YTD (income).
Last week, the price return of ‘The List’ was up with a return of +13.0% YTD (capital).
Even though prices may fluctuate, the dependable growth in our income does not. Stay the course. You will be happy you did.
Last week’s best performers on ‘The List’ were Brookfield Infrastructure Partners (BIP-N), up +6.79%; Franco Nevada (FNV-N), up +6.15%; and Toromont Industries (TIH-T), up +5.31%.
Alimentation Couche-Tard Inc. (ATD-T) was the worst performer last week, down -2.42%.
| SYMBOL | COMPANY | YLD | PRICE | YTD % | DIV | YTD % | STREAK |
|---|---|---|---|---|---|---|---|
| ATD-T | Alimentation Couche-Tard Inc. | 0.9% | $75.00 | -2.3% | $0.70 | 17.4% | 14 |
| BCE-T | Bell Canada | 8.3% | $48.11 | -11.2% | $3.99 | 3.1% | 15 |
| BIP-N | Brookfield Infrastructure Partners | 4.9% | $33.19 | 8.1% | $1.62 | 5.9% | 16 |
| CCL-B-T | CCL Industries Inc. | 1.4% | $80.85 | 39.8% | $1.16 | 9.4% | 22 |
| CNR-T | Canadian National Railway | 2.1% | $161.44 | -3.3% | $3.38 | 7.0% | 28 |
| CTC-A-T | Canadian Tire | 4.4% | $158.81 | 14.6% | $7.00 | 1.4% | 13 |
| CU-T | Canadian Utilities Limited | 5.1% | $35.75 | 11.3% | $1.81 | 0.9% | 52 |
| DOL-T | Dollarama Inc. | 0.3% | $133.48 | 40.5% | $0.35 | 29.5% | 13 |
| EMA-T | Emera | 5.4% | $53.37 | 5.1% | $2.87 | 3.0% | 17 |
| ENB-T | Enbridge Inc. | 6.6% | $55.37 | 14.4% | $3.66 | 3.1% | 28 |
| ENGH-T | Enghouse Systems Limited | 3.2% | $30.82 | -9.3% | $1.00 | 18.3% | 17 |
| FNV-N | Franco Nevada | 1.2% | $125.13 | 13.6% | $1.44 | 5.9% | 16 |
| FTS-T | Fortis Inc. | 3.8% | $61.84 | 12.7% | $2.36 | 3.3% | 50 |
| IFC-T | Intact Financial | 1.9% | $253.16 | 24.5% | $4.84 | 10.0% | 19 |
| L-T | Loblaw Companies Limited | 1.1% | $180.47 | 40.4% | $1.92 | 10.0% | 12 |
| MFC-T | Manulife Financial | 4.2% | $38.15 | 32.1% | $1.60 | 9.6% | 10 |
| MGA-N | Magna | 4.7% | $40.20 | -27.6% | $1.90 | 3.3% | 14 |
| MRU-T | Metro Inc. | 1.5% | $86.46 | 26.2% | $1.34 | 10.7% | 29 |
| RY-T | Royal Bank of Canada | 3.4% | $168.02 | 26.3% | $5.72 | 7.1% | 13 |
| SJ-T | Stella-Jones Inc. | 1.2% | $93.20 | 21.7% | $1.12 | 21.7% | 19 |
| STN-T | Stantec Inc. | 0.8% | $105.15 | 0.5% | $0.83 | 7.8% | 12 |
| T-T | Telus | 6.7% | $23.01 | -3.0% | $1.53 | 7.1% | 20 |
| TD-T | TD Bank | 4.8% | $84.54 | -0.2% | $4.08 | 6.3% | 13 |
| TFII-N | TFI International | 1.1% | $142.98 | 9.0% | $1.60 | 10.3% | 13 |
| TIH-T | Toromont Industries | 1.5% | $127.17 | 12.7% | $1.92 | 11.6% | 34 |
| TRI-N | Thomson Reuters | 1.3% | $172.70 | 20.5% | $2.16 | 10.2% | 30 |
| TRP-T | TC Energy Corp. | 6.1% | $63.27 | 21.0% | $3.84 | 3.2% | 23 |
| WCN-N | Waste Connections | 0.6% | $185.68 | 25.3% | $1.14 | 8.6% | 14 |
| Averages | 3.2% | 13.0% | 8.8% | 21 |
Note: Stocks ending in “-N” declare earnings and dividends in US dollars. To achieve currency consistency between dividends and share price for these stocks, we have shown dividends in US dollars and share price in US dollars (these stocks are listed on a US exchange). The dividends for their Canadian counterparts (-T) would be converted into CDN dollars and would fluctuate with the exchange rate.
Check us out on magicpants.substack.com for more info in this week’s issue….
