MP Market Review – March 21, 2025
Last updated by BM on March 25, 2025
Summary
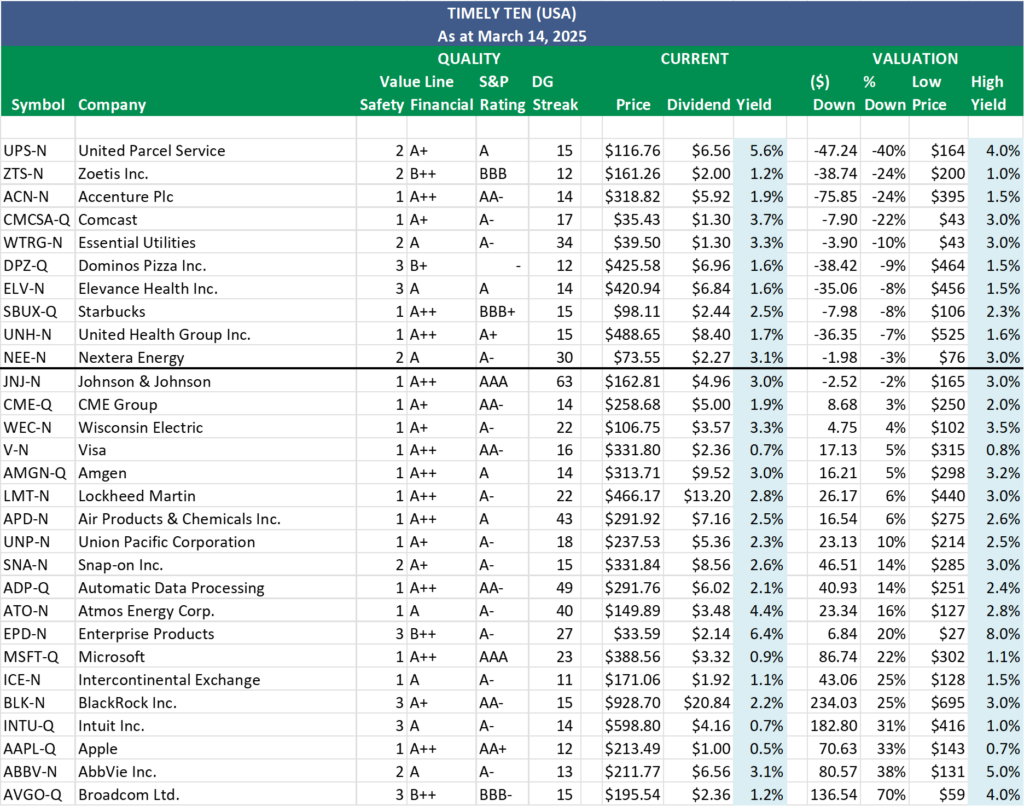
Welcome to this week’s MP Market Review – your go-to source for insights and updates on the Canadian dividend growth companies we track on ‘The List’! While we’ve expanded our watchlists to include U.S. companies (The List-USA), our Canadian lineup remains the cornerstone of our coaching approach.
Don’t miss out on exclusive newsletters and premium content that will help you sharpen your investing strategy. Explore it all at magicpants.substack.com.
Your journey to dividend growth mastery starts here – let’s dive in!
- Last week, dividend growth stayed the same, with an average return of +7.0% YTD (income).
- Last week, the price of ‘The List’ was up from the previous week with an average return of -0.18% YTD (capital).
- Last week, there were no dividend announcements made by companies on ‘The List’.
- Last week, there was one earnings report from a company on ‘The List’.
- This week, no companies on ‘The List’ are due to report earnings.
DGI Clipboard
“The time component of compounding is why 99% of Warren Buffett’s net worth came after his 50th birthday, and 97% came after he turned 65”
– Morgan Housel
Dividends Over Drama: The Strategy That Works in Any Market

Intro
Is Now a Good Time to Invest?
That’s the question on everyone’s mind. But for dividend growth investors, it’s the wrong question. Trying to catch the exact top or bottom is a futile exercise. Our focus is on consistency, discipline, and long-term results.
That’s why we prefer to deploy capital gradually—especially when managing a larger sum. In our model portfolio, for instance, we invest our $100,000 of initial capital over a four-year period, adjusting based on valuation and market direction, while always keeping a long-term horizon of 5 to 10 years (or more) in mind.
We Take a Different Approach
While many investors try to time the market, we focus on keeping our cash-generating machine running at full throttle—through every market cycle, in any condition. This ensures a steady stream of income consistently flows into our account, giving us the flexibility to meet our needs and reinvest opportunistically, whether markets are rallying or retreating.
The financial markets have been the most powerful engine of wealth in human history—but only for those who can ignore the noise. While others react emotionally to headlines and volatility, we stay the course, confident that our dividends will continue to roll in—rain or shine.
Why Dividend Growth?
The key is having a strategy built on quality, reliability, and growing income. Dividend growth investing delivers all three. Instead of sitting in cash and waiting for the “perfect” time to enter the market, we prefer to own high-quality companies with long track records of increasing their dividends.
Cash rarely keeps pace with inflation. A dollar in 2000 is worth just 52 cents today. But a carefully selected portfolio of dividend growers doesn’t just preserve purchasing power—it increases it, through rising income and compounding returns.
While many index and ETF investors panic and try to guess the bottom, we remain calm, patient, and disciplined—ready to purchase our quality dividend growers when prices become sensible.
The Power of Compounding Dividends
Our annual CAGR sheets tell the story best. They show ten years of dividend growth across the page—clear, consistent, and compounding. It’s one thing to see the numbers; it’s another to understand the impact. These annual increases don’t just drive wealth creation—they are the wealth. Every dividend raise is a powerful signal: income is growing, purchasing power is compounding, and time is on our side.
Below are the sheets (as of January 1, 2025) we keep close by—because they remind us exactly why we do what we do.
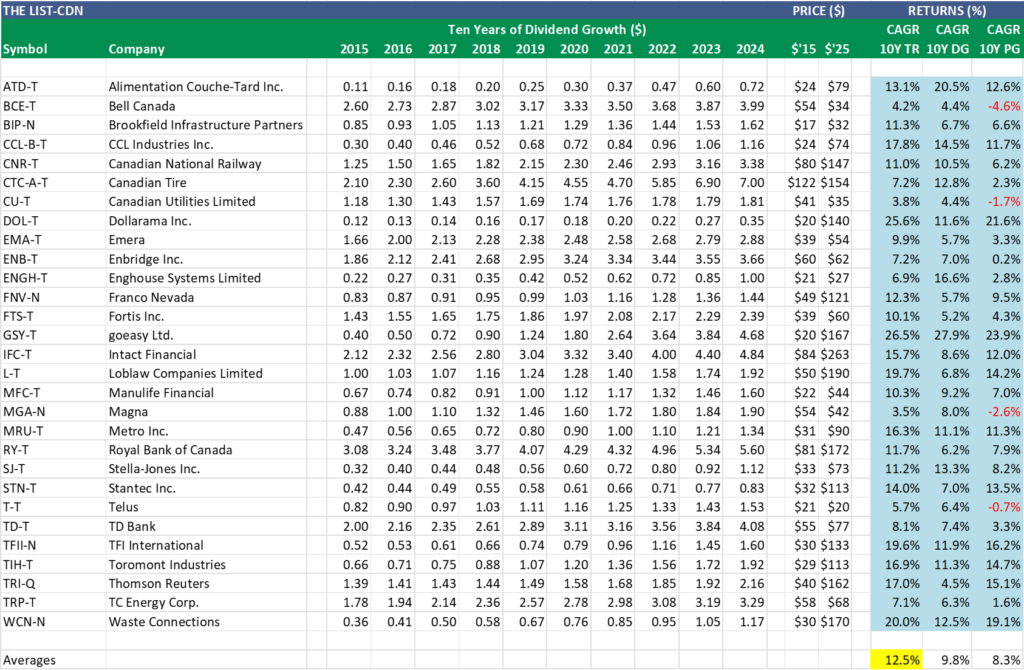
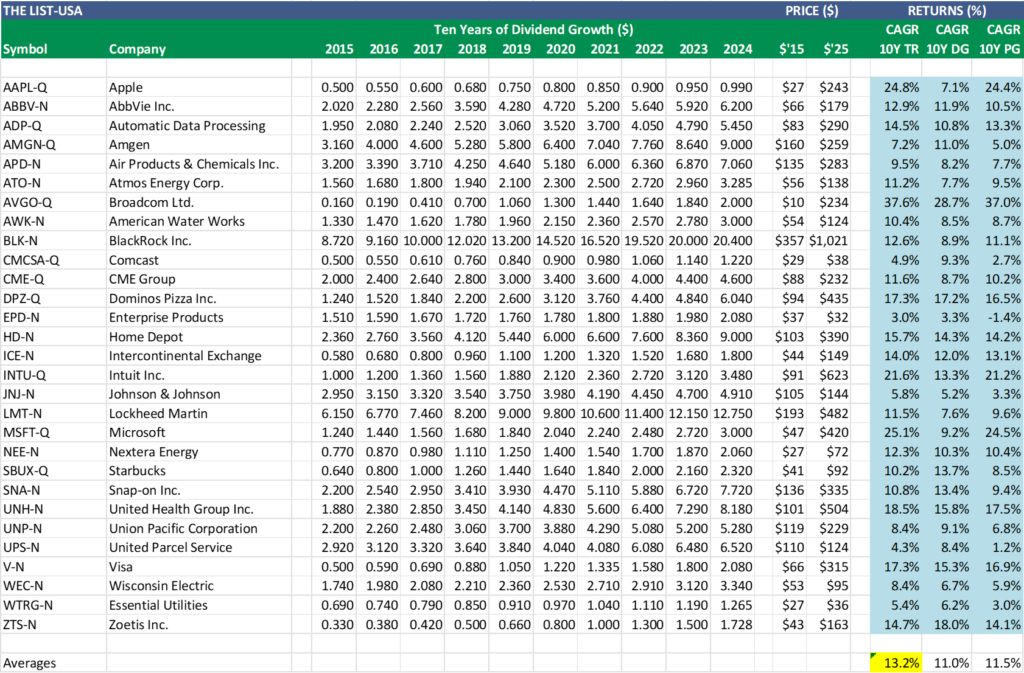
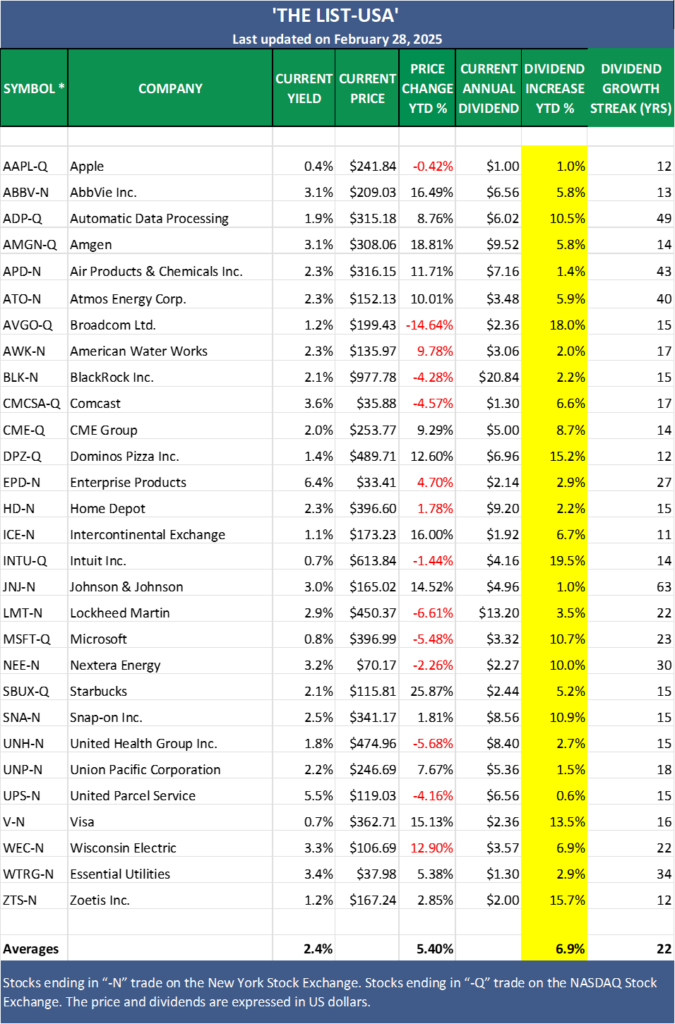
The 10YR average annual total returns (CAGR TR) for the companies we follow on ‘The List’ were 12.5% (CDN) and 13.2% (USA).
Note: The ‘Averages’ are based on an equal amount purchased in each company on January 1, 2015.
Wrap Up
Don’t let market noise distract you from the business of investing. We don’t rely on someone else buying our shares at a higher price. We rely on growing dividends to drive long-term capital gains.
That’s the power of a dividend-focused approach: It frees us from worrying about short-term market swings. Yes, prices fluctuate. But our portfolio revolves around a stable, compounding dividend core that delivers predictable income and long-term wealth, regardless of market volatility.
Join as a paying subscriber to gain full access to this post and exclusive, subscriber-only content. Plus, get real-time DGI alerts from our model signaling service whenever we make trades in our portfolios. We do the work; you stay in control. Subscribe today and take your dividend growth investing to the next level.
DGI Scorecard
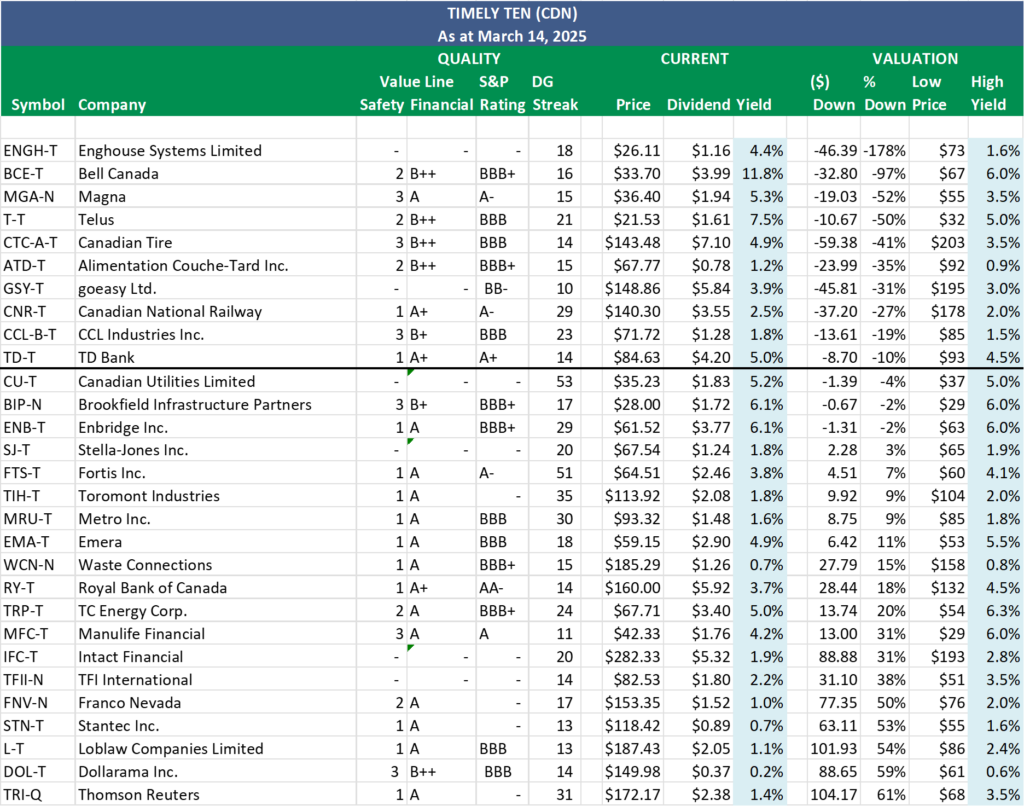
The List (2025)
The Magic Pants 2025 list includes 29 Canadian dividend growth stocks. Here are the criteria to be considered a candidate on ‘The List’:
- Dividend growth streak: 10 years or more.
- Market cap: Minimum one billion dollars.
- Diversification: Limit of five companies per sector, preferably two per industry.
- Cyclicality: Exclude REITs and pure-play energy companies due to high cyclicality.
Based on these criteria, companies are added or removed from ‘The List’ annually on January 1. Prices and dividends are updated weekly.
‘The List’ is not a portfolio but a coaching tool that helps us think about ideas and risk manage our model portfolio. We own some but not all the companies on ‘The List’. In other words, we might want to buy these companies when valuation looks attractive.
Our newsletter provides readers with a comprehensive insight into the implementation and advantages of our Canadian dividend growth investing strategy. This evidence-based, unbiased approach empowers DIY investors to outperform both actively managed dividend funds and passively managed indexes and dividend ETFs over longer-term horizons.
Performance of ‘The List’
Last week, dividend growth stayed the same up, with an average return of +7.0% YTD (income).
Last week, the price of ‘The List’ remained in negative territory but was up from the previous week, with an average YTD return of -0.18% (capital).
Even though prices may fluctuate, the dependable growth in our income does not. Stay the course. You will be happy you did.
Last week’s best performers on ‘The List’ were Alimentation Couche-Tard Inc. (ATD-T), up +3.84%; Manulife Financial (MFC-T), up +3.19%; and Canadian Tire (CTC-A-T), up +3.08%.
Telus (T-T) was the worst performer last week, down -7.15%.
| SYMBOL | COMPANY | YLD | PRICE | YTD % | DIV | YTD % | STREAK |
|---|---|---|---|---|---|---|---|
| ATD-T | Alimentation Couche-Tard Inc. | 1.1% | $70.37 | -10.98% | $0.78 | 8.3% | 15 |
| BCE-T | Bell Canada | 12.3% | $32.57 | -2.83% | $3.99 | 0.0% | 16 |
| BIP-N | Brookfield Infrastructure Partners | 6.0% | $28.72 | -9.86% | $1.72 | 6.2% | 17 |
| CCL-B-T | CCL Industries Inc. | 1.8% | $71.38 | -3.04% | $1.28 | 10.3% | 23 |
| CNR-T | Canadian National Railway | 2.6% | $138.40 | -5.71% | $3.55 | 5.0% | 29 |
| CTC-A-T | Canadian Tire | 4.8% | $147.90 | -3.78% | $7.10 | 1.4% | 14 |
| CU-T | Canadian Utilities Limited | 5.1% | $35.80 | 2.93% | $1.83 | 1.0% | 53 |
| DOL-T | Dollarama Inc. | 0.2% | $148.44 | 5.88% | $0.37 | 5.1% | 14 |
| EMA-T | Emera | 4.9% | $59.18 | 10.55% | $2.90 | 0.7% | 18 |
| ENB-T | Enbridge Inc. | 6.0% | $62.94 | 1.73% | $3.77 | 3.0% | 29 |
| ENGH-T | Enghouse Systems Limited | 4.4% | $26.46 | -2.22% | $1.16 | 16.0% | 18 |
| FNV-N | Franco Nevada | 1.0% | $155.83 | 28.65% | $1.52 | 5.6% | 17 |
| FTS-T | Fortis Inc. | 3.8% | $64.55 | 8.27% | $2.46 | 3.1% | 51 |
| GSY-T | goeasy Ltd. | 3.9% | $151.14 | -9.58% | $5.84 | 24.8% | 10 |
| IFC-T | Intact Financial | 1.9% | $280.63 | 6.72% | $5.32 | 9.9% | 20 |
| L-T | Loblaw Companies Limited | 1.1% | $191.99 | 0.93% | $2.05 | 7.0% | 13 |
| MFC-T | Manulife Financial | 4.0% | $43.68 | -0.59% | $1.76 | 10.0% | 11 |
| MGA-N | Magna | 5.3% | $36.42 | -12.75% | $1.94 | 2.1% | 15 |
| MRU-T | Metro Inc. | 1.6% | $95.00 | 5.36% | $1.48 | 10.4% | 30 |
| RY-T | Royal Bank of Canada | 3.6% | $162.92 | -5.43% | $5.92 | 5.7% | 14 |
| SJ-T | Stella-Jones Inc. | 1.8% | $67.03 | -8.17% | $1.24 | 10.7% | 20 |
| STN-T | Stantec Inc. | 0.8% | $117.77 | 4.12% | $0.89 | 7.3% | 13 |
| T-T | Telus | 8.1% | $19.99 | 1.83% | $1.61 | 5.2% | 21 |
| TD-T | TD Bank | 4.9% | $85.30 | 11.50% | $4.20 | 2.9% | 14 |
| TFII-N | TFI International | 2.2% | $81.93 | -38.22% | $1.80 | 12.5% | 14 |
| TIH-T | Toromont Industries | 1.8% | $114.84 | 1.54% | $2.08 | 8.3% | 35 |
| TRI-Q | Thomson Reuters | 1.4% | $170.01 | 4.70% | $2.38 | 10.2% | 31 |
| TRP-T | TC Energy Corp. | 4.9% | $69.50 | 1.88% | $3.40 | 3.3% | 24 |
| WCN-N | Waste Connections | 0.7% | $189.32 | 11.42% | $1.26 | 7.7% | 15 |
| Averages | 3.5% | -0.18% | 7.0% | 21 |
Note: Stocks ending in “-N or -Q” declare earnings and dividends in US dollars. To achieve currency consistency between dividends and share price for these stocks, we have shown dividends in US dollars and share price in US dollars (these stocks are listed on a US exchange). The dividends for their Canadian counterparts (-T) would be converted into CDN dollars and would fluctuate with the exchange rate.
PAID subscribers enjoy full access to our enhanced weekly newsletter, premium content, and easy-to-follow trade alerts so they can build DGI portfolios alongside ours. This service provides the resources to develop your DGI business plan confidently. We do the work; you stay in control!
It truly is the subscription that pays dividends!
The greatest investment you can make is in yourself. Are you ready to take that step?
For more articles and the full newsletter, check us out on magicpants.substack.com.