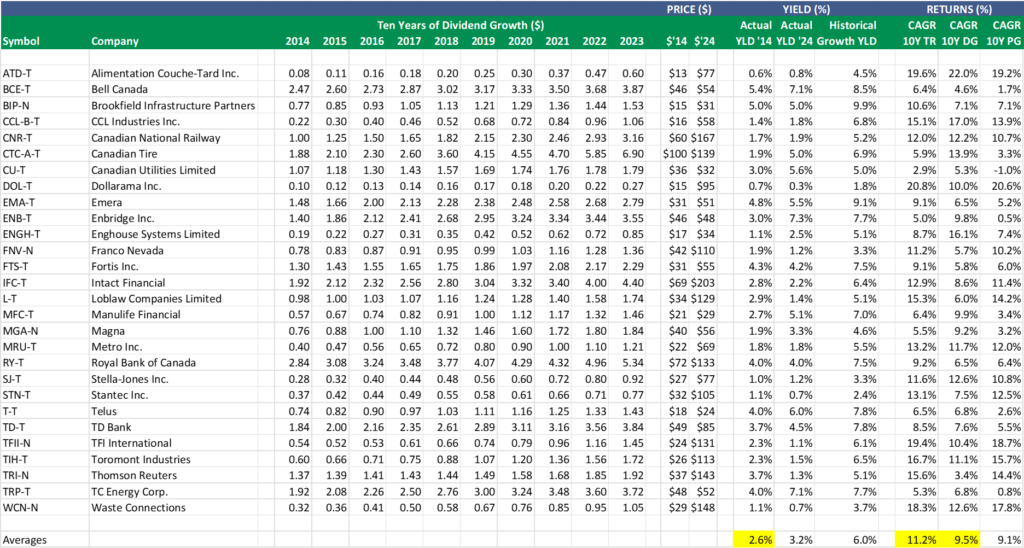
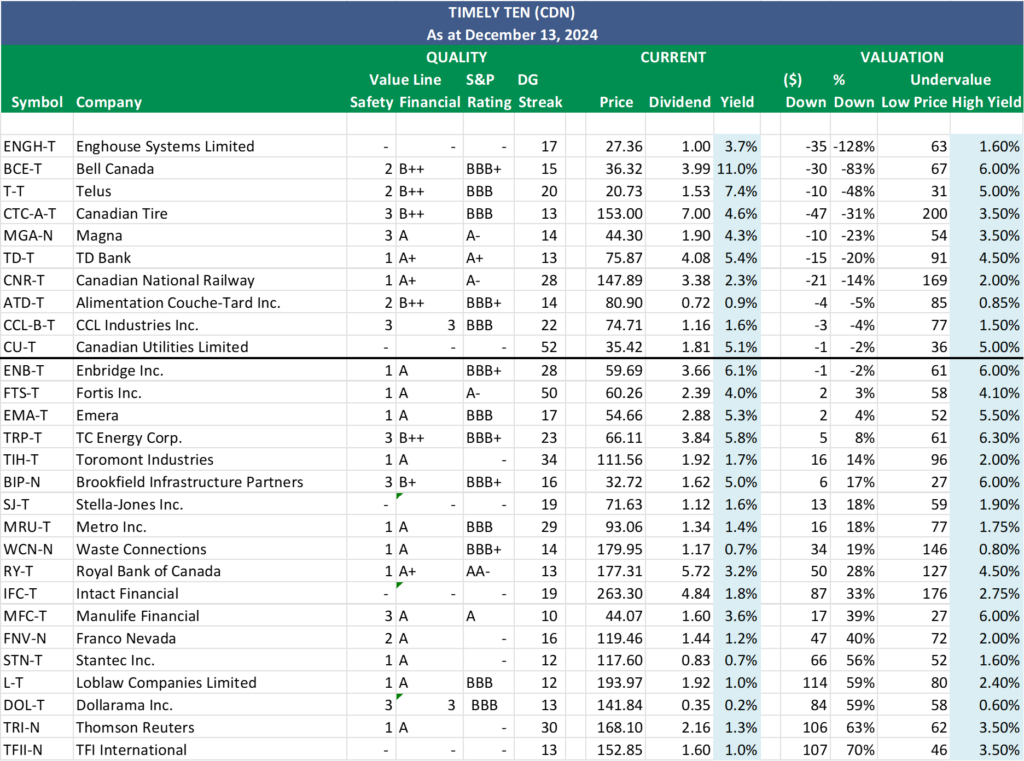
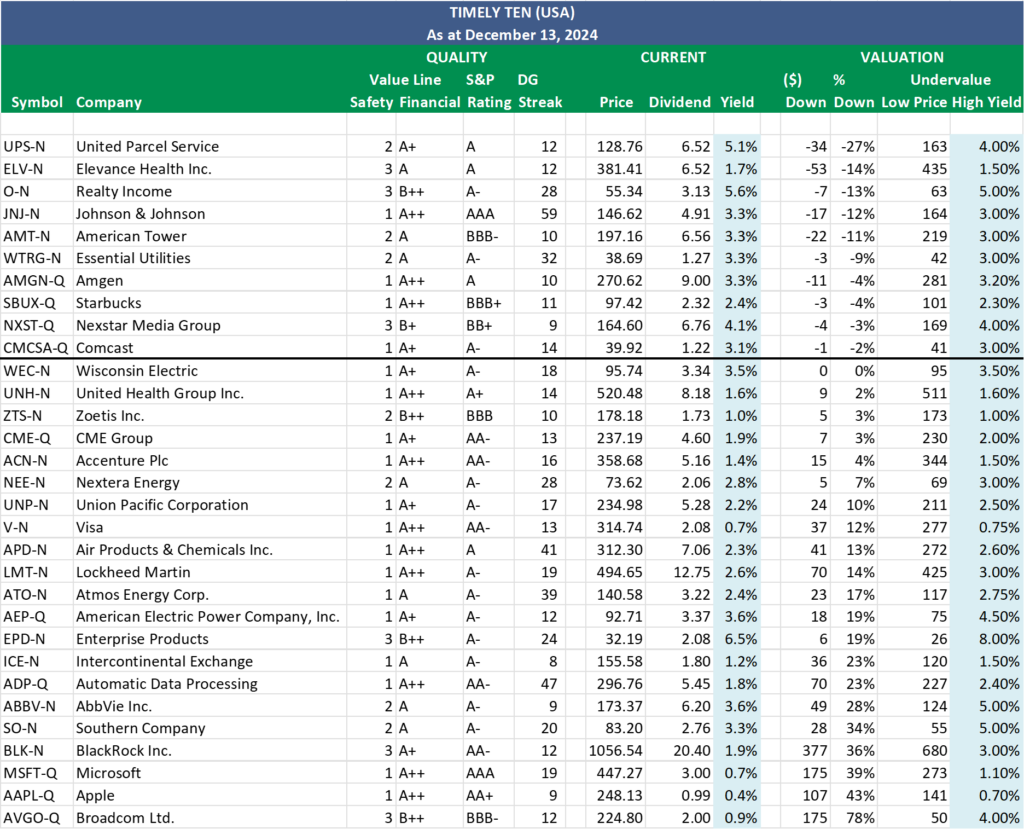
MP Market Review – December 27, 2024
Last updated by BM on December 31, 2024
Summary
This is a weekly installment of our MP Market Review series, which provides insights and updates on Canadian dividend growth companies we monitor on ‘The List’. To read all our newsletters and premium content be sure to check us out on magicpants.substack.com.
- This week, we introduce our 2025 version of ‘The List’.
- Last week, dividend growth of ‘The List’ stayed the same and is up by +9.2% YTD (income).
- Last week, the price of ‘The List’ was up with a return of +10.2% YTD (capital).
- Last week, there were no dividend announcements from companies on ‘The List’.
- Last week, there were no earnings reports from companies on ‘The List’.
- This week, no companies on ‘The List’ are due to report earnings.
DGI Clipboard
“If you look for companies that can raise their dividends year after year without milking operations, you will automatically be lead to high quality stocks.”
– Edmund Faltermayer, Fortune magazine, October 1990
Canada’s Dividend Growth Leaders: Our 2025 Watch List

Intro
As dividend growth investors, we see ourselves as an asset management business. Our “assets” are the many high-quality dividend growth companies we own in Canada and the United States.
One of the most powerful lessons I’ve learned about both investing and running a business came from two of my greatest mentors: Bill Gates and Warren Buffett. In a memorable moment, they were each asked to write down the one word they believed was most responsible for their success. Remarkably, they both wrote the same word: focus.
Gates and Buffett believe that focus, concentration on key goals, and the ability to say “no” to distractions are crucial to success in their respective fields.
Inspired by their words, I’ve created ‘The List’—a curated watchlist of quality dividend growth companies. This focused approach helps me avoid the noise of the broader market, making it easier to track key metrics and develop a deeper understanding of the selected businesses I may invest in.
‘The List’ is not a portfolio but a coaching tool that helps us think about ideas and risk manage our model portfolio. We own some but not all the companies on ‘The List’. In other words, we might want to buy these companies when valuation looks attractive.
To begin our selection for 2025, we review the listed companies on the Toronto Stock Exchange (TSX). The TSX is one of the world’s largest stock exchanges and the third largest in North America. It is home to over 700 companies across all sectors of the Canadian economy.
Here are the criteria to be considered a candidate on ‘The List’:
- Dividend growth streak: 10 years or more.
- Market cap: Minimum one billion dollars.
- Diversification: Limit of five companies per sector, preferably two per industry.
- Cyclicality: Exclude REITs and pure-play energy companies due to higher cyclicality.
By screening for the first two criteria, ten years of consecutive dividend growth and a market cap of one billion dollars or more, we narrow our candidates down to only 67 companies (less than 10% of the companies on the TSX).
We then winnow further using the final two criteria, diversification and cyclicality to ensure the companies selected represent stable businesses in all sectors of the Canadian economy.
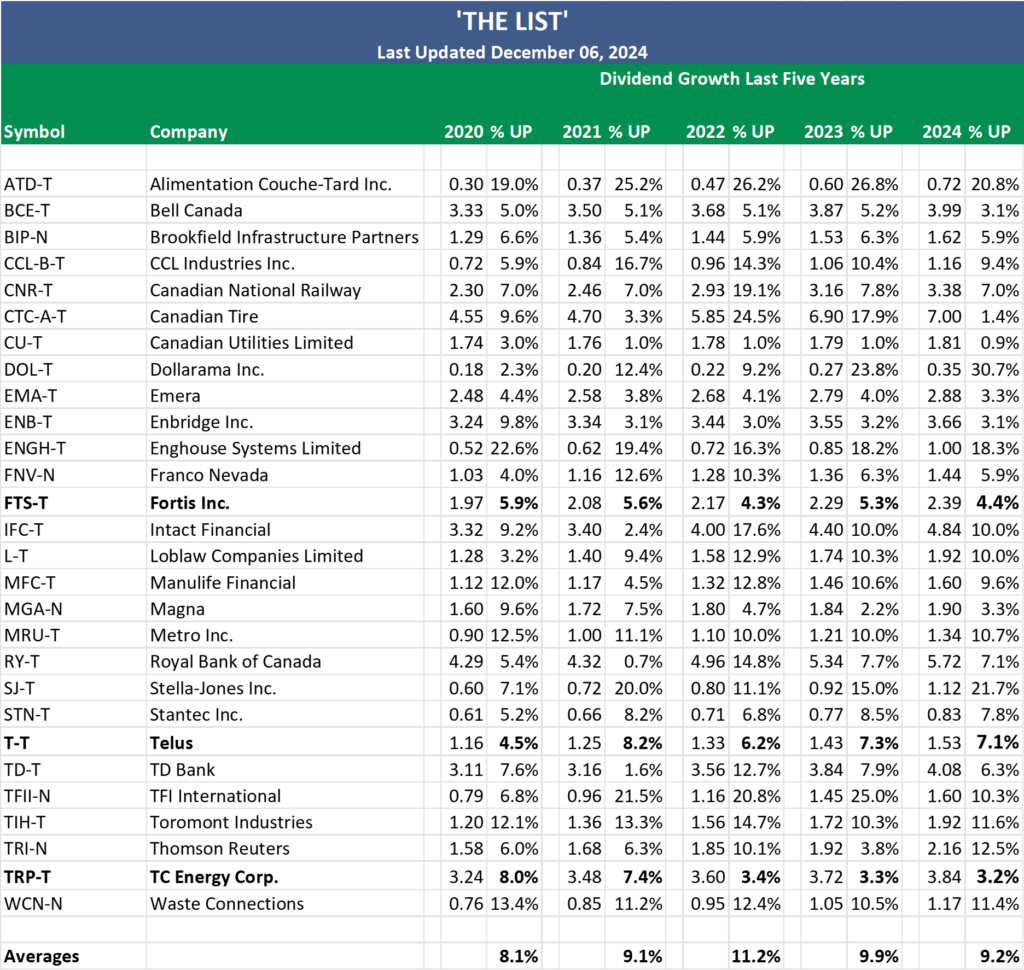
Unless their dividend streaks are interrupted, we typically don’t remove companies on ‘The List’. All 28 companies currently on ‘The List’ increased their dividends in 2024, securing their place on our watch list for 2025.
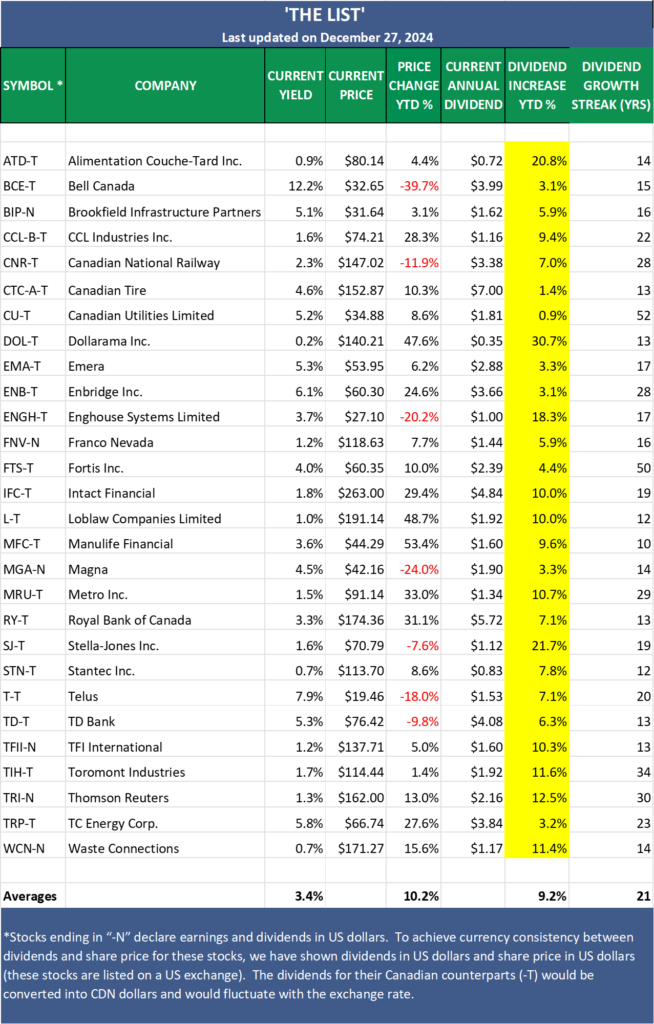
The highlighted column represents the true magic of what we do. In 2024, ‘The List’ delivered an impressive 9.2% increase in income on average. At this pace, our income could double in less than eight years—and over the course of a thirty-year retirement, it could double more than three times!
In addition, our capital increased by 10%+ on ‘The List,’ reinforcing the strength of our strategy. While ‘The List’ isn’t a portfolio in itself, it serves as a powerful tool to showcase the potential of disciplined dividend growth investing.
This is the transformative power of dividend growth investing. Unlike most retirees, we don’t worry about running out of income or capital. Instead, we focus on building a reliable, growing income stream that works for us in the long run.
Identifying Potential Candidates
One key to our success over the years has been our ability to identify companies with the potential to become the next generation of quality dividend growers. In 2025, we will examine the new companies that meet our criteria for the first time.
We’ve identified six companies on the TSX that will meet our first two criteria for inclusion on ‘The List’ in 2025:
- Dividend Growth Streak: At least 10 years.
- Market Cap: Minimum of one billion dollars.
Here are the candidates that qualify for the first time in 2025:

When evaluating new entrants against our final two criteria—diversification and cyclicality—we conduct a thorough ‘quality’ review process, similar to the one used when selecting companies for purchase in our MP Wealth-Builder Model Portfolio (CDN). The more quality indicators a company meets, the higher its overall quality.
The one company that stood out was goeasy Ltd. (GSY-T).
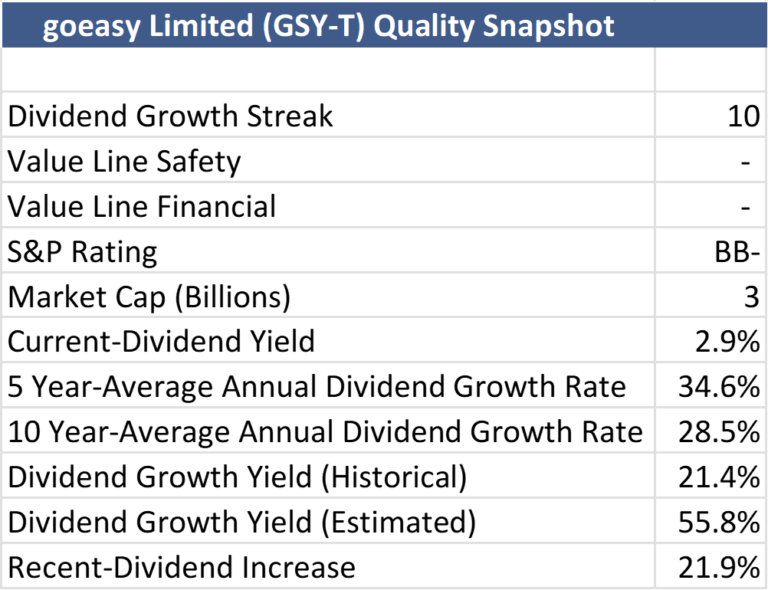
goeasy Ltd. is a financial services company with an annualized total return of 25.3% over the last ten years. The principal operating activities of the Company include: providing loans and other financial services to consumers and leasing household products to consumers. Customers can transact seamlessly through an omnichannel model that includes online and mobile platforms. The Company operates in two reportable segments: easyfinancial and easyhome. The easyfinancial reportable segment lends out capital in the form of unsecured and secured consumer loans to nonprime borrowers. easyfinancial’s product offering consists of unsecured and real estate-secured installment loans. The key revenue of the company is generated from easyfinancial.
goeasy Ltd. checks many of our ‘quality indicators’ and has earned its place as one of the top dividend growth stocks on the TSX over the past decade. While its shorter dividend streak slightly skews some of its quality metrics, the company’s performance remains impressive. Even if its growth rates over the next decade were only half as strong as the last, goeasy Ltd. would still rank near the top of most lists for both overall income and capital growth potential.
(GSY-T)’s small market cap and limited third-party financial coverage currently place it in our ‘non-Core’ category. To learn more about how we classify categories and determine position sizes for quality dividend growers, refer to our MP Wealth-Builder Model Portfolio (CDN) – Business Plan.
As a general rule, we aim to keep our watch list focused and manageable. That means maintaining around 30 companies on ‘The List.’
Looking ahead to 2025, with the addition of goeasy Ltd., our watch list has grown to 29 carefully selected dividend growth companies. These companies represent nine sectors of the Canadian economy and offer a balanced mix of diversification, starting yields, and growth rates.
Wrap Up
‘The List’ is designed to serve as a valuable resource for anyone looking to build or refine their own dividend growth investing (DGI) portfolio. Whether you seek stability or long-term income growth, this curated selection provides a solid foundation.
In next week’s newsletter we will begin reporting and coaching our dividend growth investing (DGI) process using the companies on the Canadian 2025 version of ‘The List’.
I will also introduce the 2025 United States version of ‘The List’ for our subscribers interested in adding some southern exposure to their DGI journey.
Happy New Year, and a special shout-out to all our new subscribers in 2024. I am not just interested in getting your subscription; I am interested in keeping it! Comments at the bottom of each post are welcome. It’s how we get better.
Become a paid subscriber and start building your portfolio confidently today. We do the work, and you stay in control!
DGI Scorecard
The List (2024)
The Magic Pants 2024 list includes 28 Canadian dividend growth stocks. Here are the criteria to be considered a candidate on ‘The List’:
- Dividend growth streak: 10 years or more.
- Market cap: Minimum one billion dollars.
- Diversification: Limit of five companies per sector, preferably two per industry.
- Cyclicality: Exclude REITs and pure-play energy companies due to high cyclicality.
Based on these criteria, companies are added or removed from ‘The List’ annually on January 1. Prices and dividends are updated weekly.
‘The List’ is not a portfolio but a coaching tool that helps us think about ideas and risk manage our model portfolio. We own some but not all the companies on ‘The List’. In other words, we might want to buy these companies when valuation looks attractive.
Our newsletter provides readers with a comprehensive insight into the implementation and advantages of our Canadian dividend growth investing strategy. This evidence-based, unbiased approach empowers DIY investors to outperform both actively managed dividend funds and passively managed indexes and dividend ETFs over longer-term horizons.
For those interested in something more, please upgrade to a paid subscriber; you get the enhanced weekly newsletter, access to premium content, full privileges on the new Substack website magicpants.substack.com and DGI alerts whenever we make stock transactions in our model portfolio.
Performance of ‘The List’
Last week, dividend growth of ‘The List’ stayed the same and has increased by +9.2% YTD (income). How much did your salary go up this year?
Last week, the average price return of ‘The List’ was up with a return of +10.2% YTD (capital).
Even though prices may fluctuate, the dependable growth in our income does not. Stay the course. You will be happy you did.
Last week’s best performers on ‘The List’ were Franco Nevada (FNV-N), up +2.08%; TD Bank (TD-T), up +1.85%; and Manulife Financial (MFC-T), up +1.75%.
Telus (T-T) was the worst performer last week, down -2.31%.
| SYMBOL | COMPANY | YLD | PRICE | YTD % | DIV | YTD % | STREAK |
|---|---|---|---|---|---|---|---|
| ATD-T | Alimentation Couche-Tard Inc. | 0.9% | $80.14 | 4.4% | $0.72 | 20.8% | 14 |
| BCE-T | Bell Canada | 12.2% | $32.65 | -39.7% | $3.99 | 3.1% | 15 |
| BIP-N | Brookfield Infrastructure Partners | 5.1% | $31.64 | 3.1% | $1.62 | 5.9% | 16 |
| CCL-B-T | CCL Industries Inc. | 1.6% | $74.21 | 28.3% | $1.16 | 9.4% | 22 |
| CNR-T | Canadian National Railway | 2.3% | $147.02 | -11.9% | $3.38 | 7.0% | 28 |
| CTC-A-T | Canadian Tire | 4.6% | $152.87 | 10.3% | $7.00 | 1.4% | 13 |
| CU-T | Canadian Utilities Limited | 5.2% | $34.88 | 8.6% | $1.81 | 0.9% | 52 |
| DOL-T | Dollarama Inc. | 0.2% | $140.21 | 47.6% | $0.35 | 30.7% | 13 |
| EMA-T | Emera | 5.3% | $53.95 | 6.2% | $2.88 | 3.3% | 17 |
| ENB-T | Enbridge Inc. | 6.1% | $60.30 | 24.6% | $3.66 | 3.1% | 28 |
| ENGH-T | Enghouse Systems Limited | 3.7% | $27.10 | -20.2% | $1.00 | 18.3% | 17 |
| FNV-N | Franco Nevada | 1.2% | $118.63 | 7.7% | $1.44 | 5.9% | 16 |
| FTS-T | Fortis Inc. | 4.0% | $60.35 | 10.0% | $2.39 | 4.4% | 50 |
| IFC-T | Intact Financial | 1.8% | $263.00 | 29.4% | $4.84 | 10.0% | 19 |
| L-T | Loblaw Companies Limited | 1.0% | $191.14 | 48.7% | $1.92 | 10.0% | 12 |
| MFC-T | Manulife Financial | 3.6% | $44.29 | 53.4% | $1.60 | 9.6% | 10 |
| MGA-N | Magna | 4.5% | $42.16 | -24.0% | $1.90 | 3.3% | 14 |
| MRU-T | Metro Inc. | 1.5% | $91.14 | 33.0% | $1.34 | 10.7% | 29 |
| RY-T | Royal Bank of Canada | 3.3% | $174.36 | 31.1% | $5.72 | 7.1% | 13 |
| SJ-T | Stella-Jones Inc. | 1.6% | $70.79 | -7.6% | $1.12 | 21.7% | 19 |
| STN-T | Stantec Inc. | 0.7% | $113.70 | 8.6% | $0.83 | 7.8% | 12 |
| T-T | Telus | 7.9% | $19.46 | -18.0% | $1.53 | 7.1% | 20 |
| TD-T | TD Bank | 5.3% | $76.42 | -9.8% | $4.08 | 6.3% | 13 |
| TFII-N | TFI International | 1.2% | $137.71 | 5.0% | $1.60 | 10.3% | 13 |
| TIH-T | Toromont Industries | 1.7% | $114.44 | 1.4% | $1.92 | 11.6% | 34 |
| TRI-N | Thomson Reuters | 1.3% | $162.00 | 13.0% | $2.16 | 12.5% | 30 |
| TRP-T | TC Energy Corp. | 5.8% | $66.74 | 27.6% | $3.84 | 3.2% | 23 |
| WCN-N | Waste Connections | 0.7% | $171.27 | 15.6% | $1.17 | 11.4% | 14 |
| Averages | 3.4% | 10.2% | 9.2% | 21 |
Note: Stocks ending in “-N” declare earnings and dividends in US dollars. To achieve currency consistency between dividends and share price for these stocks, we have shown dividends in US dollars and share price in US dollars (these stocks are listed on a US exchange). The dividends for their Canadian counterparts (-T) would be converted into CDN dollars and would fluctuate with the exchange rate.
PAID subscribers enjoy full access to our enhanced weekly newsletter, premium content, and easy-to-follow trade alerts so they can build DGI portfolios alongside ours. This service provides the resources to develop your DGI business plan confidently. We do the work; you stay in control!
It truly is the subscription that pays dividends!
The greatest investment you can make is in yourself. Are you ready to take that step?
For more articles and the full newsletter, check us out on magicpants.substack.com.


