MP Market Review – October 25, 2024
Last updated by BM on October 29, 2024
Summary
This is a weekly installment of our MP Market Review series, which provides insights and updates on Canadian dividend growth companies we monitor on ‘The List’. To read all our newsletters and premium content be sure to check us out on magicpants.substack.com.
- This week, Warren Buffett reminds us to always wait for the right pitch.
- Last week, dividend growth of ‘The List’ was up and has increased by +9.0% YTD (income).
- Last week, the price of ‘The List’ was down with a return of +12.9% YTD (capital).
- Last week, there were two dividend announcements from companies on ‘The List’.
- Last week, there were three earnings reports from companies on ‘The List’.
- This week, two companies on ‘The List’ are due to report earnings.
DGI Clipboard
“The stock market is a no-called-strike game. You don’t have to swing at everything—you can wait for your pitch.”
-Warren Buffett
Only Swing at the Right Opportunities!

Intro
Unfortunately, the Blue Jays didn’t make it to the World Series this year, but I thought a timely baseball anecdote in this week’s DGI Clipboard might help ease the sting.
Baseball and Investing
Warren Buffett often references Ted Williams, the legendary baseball player, to explain his philosophy on disciplined investing. In his 2005 Berkshire Hathaway shareholder letter, Buffett described how Williams approached hitting by dividing the strike zone into 77 squares, each about the size of a baseball. Williams knew his batting average would be much higher if he only swung at pitches in his “sweet spot,” or areas where he could hit well.
Buffett compares this selective approach to investing, noting that investors don’t have to swing at every “pitch” (investment opportunity) that comes their way. Instead, they should patiently wait for the right opportunities—those in their “sweet spot” of understanding and valuation. By only investing in situations they feel confident in, they can improve their “batting average,” or success rate, just as Williams did with his strategic approach at the plate. This analogy has been a cornerstone of Buffett’s approach to value investing: patience, discipline, and understanding the pitches (investments) that best suit one’s skills and knowledge.
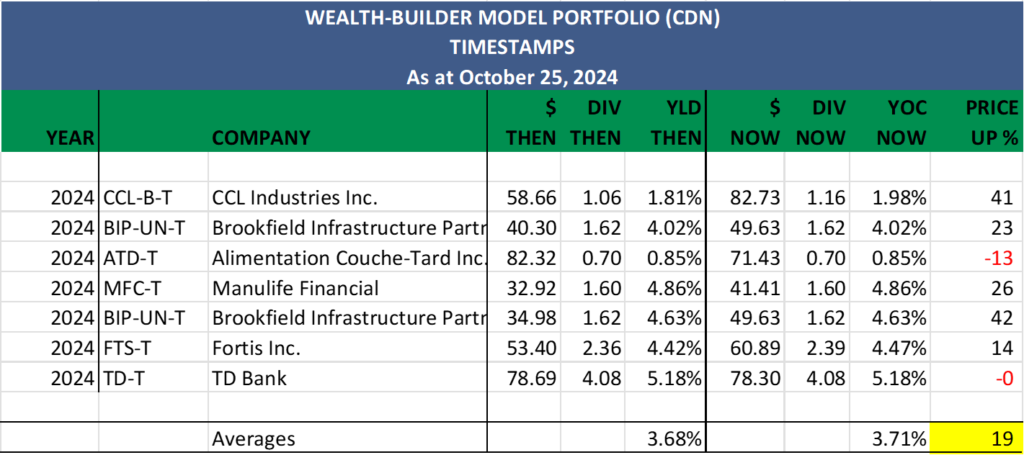
On average, we take just 15 to 20 “swings” each year, carefully choosing investments that land in our ‘sweet spot.’ This disciplined approach has served us well: in 2024, we’ve taken just seven swings, yet these have yielded an impressive average YTD capital gain of 19%.
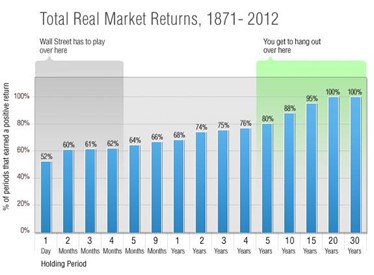
Our “batting average” improves further by holding these investments for the long term. That’s where the power of dividend growth investing (DGI) comes into play. For patient investors, DGI allows us to watch our investment thesis unfold over years, not just quarters. With DGI, there’s no rush to sell to see a return; we’re rewarded with consistent and growing dividends simply by holding. History has shown that longer holding periods improve the probability of a positive outcome.
Wrap Up
The longer we hold, the higher our dividend yield on cost (return from dividends alone) and the greater the likelihood of capital growth. Just as Ted Williams’ legendary .344 batting average is among the highest in baseball history, DGI investors can achieve a “batting average” over .800 (80%) by consistently buying high-quality dividend growers when they’re sensibly priced and holding. By holding these stocks for the long term (> five years), we let the compounding effect of dividends drive our returns—often leading to a price significantly higher than our original investment.
DGI Scorecard
The List (2024)
The Magic Pants 2024 list includes 28 Canadian dividend growth stocks. Here are the criteria to be considered a candidate on ‘The List’:
- Dividend growth streak: 10 years or more.
- Market cap: Minimum one billion dollars.
- Diversification: Limit of five companies per sector, preferably two per industry.
- Cyclicality: Exclude REITs and pure-play energy companies due to high cyclicality.
Based on these criteria, companies are added or removed from ‘The List’ annually on January 1. Prices and dividends are updated weekly.
‘The List’ is not a portfolio; it is a coaching tool that helps us think about ideas and risk manage our model portfolio. We own some but not all the companies on ‘The List’.
Our newsletter provides readers with a comprehensive insight into the implementation and advantages of our Canadian dividend growth investing strategy. This evidence-based, unbiased approach empowers DIY investors to outperform both actively managed dividend funds and passively managed indexes and dividend ETFs over longer-term horizons.
For those interested in something more, please upgrade to a paid subscriber; you get the enhanced weekly newsletter, access to premium content, full privileges on the new Substack website magicpants.substack.com and DGI alerts whenever we make stock transactions in our model portfolio.
Performance of ‘The List’
Last week, dividend growth of ‘The List’ was up and has now increased by +9.0% YTD (income). How much did your salary go up this year?
Last week, the average price return of ‘The List’ was down with a return of +12.9% YTD (capital).
Even though prices may fluctuate, the dependable growth in our income does not. Stay the course. You will be happy you did.
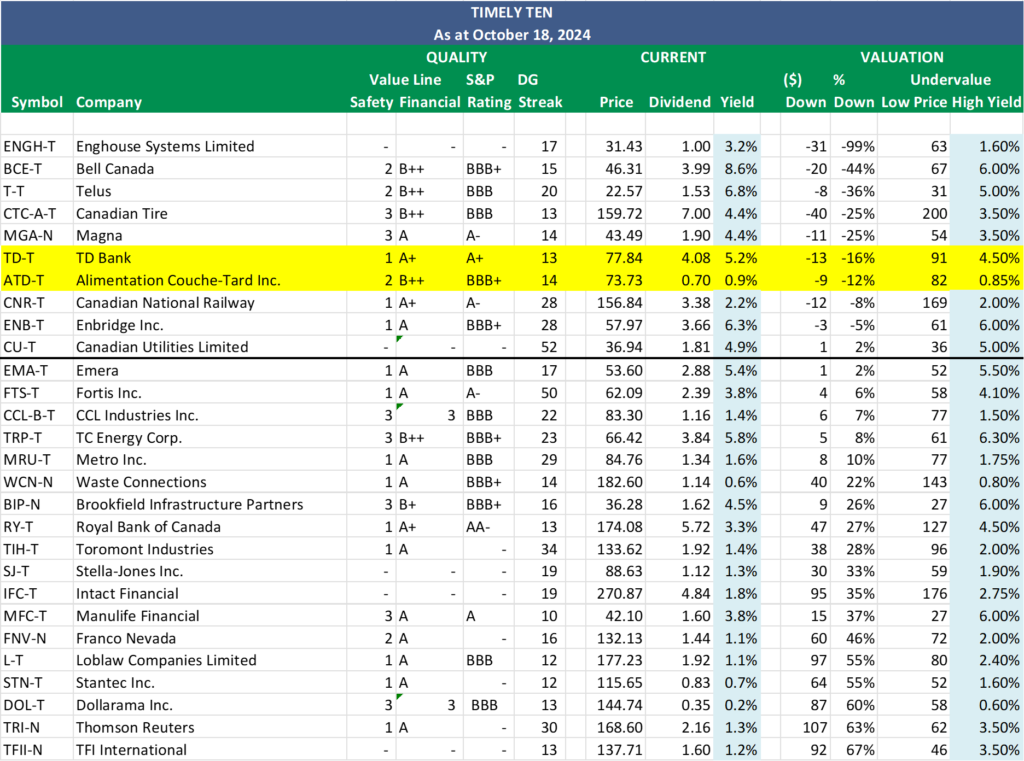
Last week’s best performers on ‘The List’ were Franco Nevada (FNV-N), up +2.64%; TD Bank (TD-T), up +0.59%; and CCL Industries Inc. (CCL-B-T), up -0.68%.
Toromont Industries (TIH-T) was the worst performer last week, down -5.64%.
| SYMBOL | COMPANY | YLD | PRICE | YTD % | DIV | YTD % | STREAK |
|---|---|---|---|---|---|---|---|
| ATD-T | Alimentation Couche-Tard Inc. | 1.0% | $71.43 | -6.9% | $0.70 | 17.4% | 14 |
| BCE-T | Bell Canada | 8.8% | $45.57 | -15.9% | $3.99 | 3.1% | 15 |
| BIP-N | Brookfield Infrastructure Partners | 4.5% | $35.70 | 16.3% | $1.62 | 5.9% | 16 |
| CCL-B-T | CCL Industries Inc. | 1.4% | $82.73 | 43.0% | $1.16 | 9.4% | 22 |
| CNR-T | Canadian National Railway | 2.2% | $154.25 | -7.6% | $3.38 | 7.0% | 28 |
| CTC-A-T | Canadian Tire | 4.5% | $156.92 | 13.2% | $7.00 | 1.4% | 13 |
| CU-T | Canadian Utilities Limited | 5.0% | $35.96 | 12.0% | $1.81 | 0.9% | 52 |
| DOL-T | Dollarama Inc. | 0.2% | $141.66 | 49.1% | $0.35 | 29.5% | 13 |
| EMA-T | Emera | 5.4% | $53.13 | 4.6% | $2.88 | 3.2% | 17 |
| ENB-T | Enbridge Inc. | 6.4% | $56.93 | 17.6% | $3.66 | 3.1% | 28 |
| ENGH-T | Enghouse Systems Limited | 3.2% | $30.93 | -8.9% | $1.00 | 18.3% | 17 |
| FNV-N | Franco Nevada | 1.1% | $135.62 | 23.1% | $1.44 | 5.9% | 16 |
| FTS-T | Fortis Inc. | 3.9% | $60.89 | 11.0% | $2.39 | 4.4% | 50 |
| IFC-T | Intact Financial | 1.8% | $267.38 | 31.5% | $4.84 | 10.0% | 19 |
| L-T | Loblaw Companies Limited | 1.1% | $173.00 | 34.6% | $1.92 | 10.0% | 12 |
| MFC-T | Manulife Financial | 3.9% | $41.41 | 43.4% | $1.60 | 9.6% | 10 |
| MGA-N | Magna | 4.5% | $41.98 | -24.4% | $1.90 | 3.3% | 14 |
| MRU-T | Metro Inc. | 1.6% | $81.71 | 19.3% | $1.34 | 10.7% | 29 |
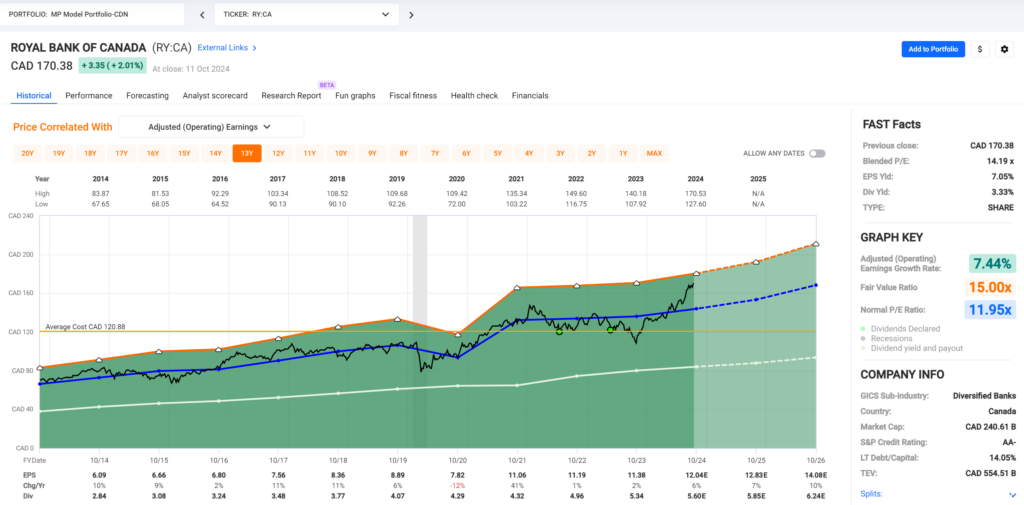
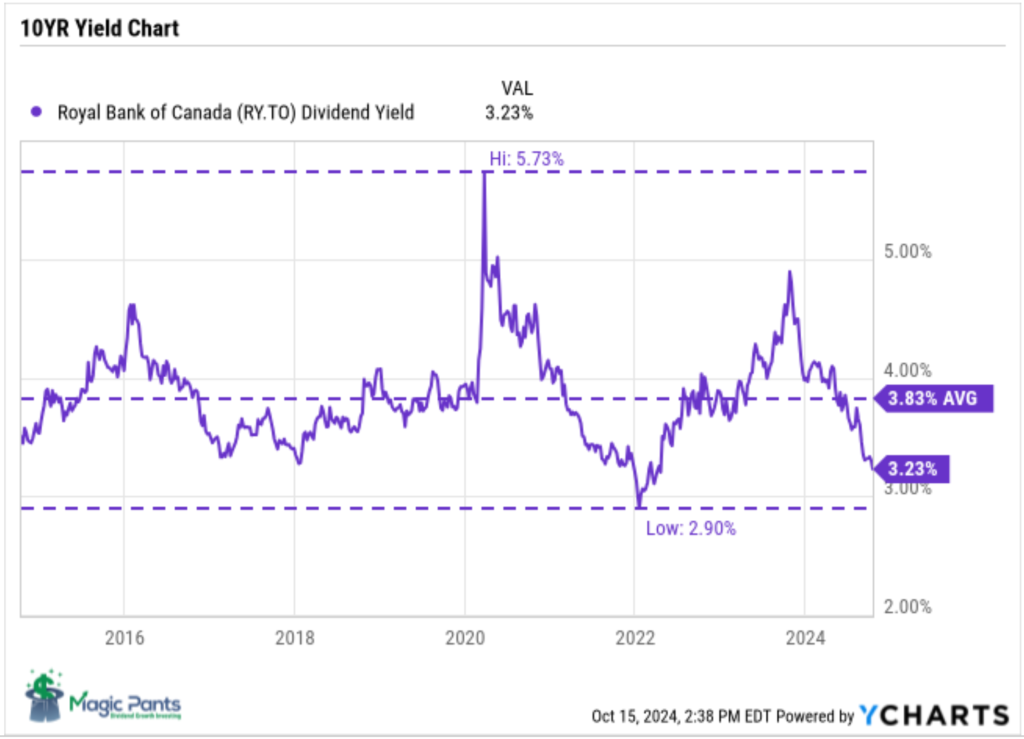
| RY-T | Royal Bank of Canada | 3.4% | $170.22 | 27.9% | $5.72 | 7.1% | 13 |
| SJ-T | Stella-Jones Inc. | 1.3% | $86.21 | 12.5% | $1.12 | 21.7% | 19 |
| STN-T | Stantec Inc. | 0.7% | $113.64 | 8.6% | $0.83 | 7.8% | 12 |
| T-T | Telus | 7.0% | $22.00 | -7.3% | $1.53 | 7.1% | 20 |
| TD-T | TD Bank | 5.2% | $78.30 | -7.5% | $4.08 | 6.3% | 13 |
| TFII-N | TFI International | 1.2% | $133.82 | 2.0% | $1.60 | 10.3% | 13 |
| TIH-T | Toromont Industries | 1.5% | $126.09 | 11.8% | $1.92 | 11.6% | 34 |
| TRI-N | Thomson Reuters | 1.3% | $164.78 | 15.0% | $2.16 | 12.5% | 30 |
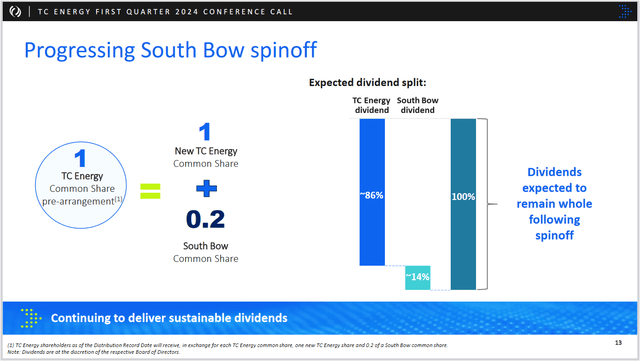
| TRP-T | TC Energy Corp. | 5.8% | $65.68 | 25.6% | $3.84 | 3.2% | 23 |
| WCN-N | Waste Connections | 0.7% | $175.80 | 18.7% | $1.17 | 11.4% | 14 |
| Averages | 3.2% | 12.9% | 9.0% | 21 |
Note: Stocks ending in “-N” declare earnings and dividends in US dollars. To achieve currency consistency between dividends and share price for these stocks, we have shown dividends in US dollars and share price in US dollars (these stocks are listed on a US exchange). The dividends for their Canadian counterparts (-T) would be converted into CDN dollars and would fluctuate with the exchange rate.
For more articles and the full newsletter, check us out on magicpants.substack.com. Don’t miss this opportunity to stay informed and make the most of your investments!