MP Market Review – September 20, 2024
Last updated by BM on September 24, 2024
Summary
This is a weekly installment of our MP Market Review series, which provides updates on the financial markets and Canadian dividend growth companies we monitor on ‘The List’.
- This week we share a ‘New Addition to Our ‘Timely Ten’: Couche-Tard’s 7-Eleven Bid: Risk or Opportunity for Investors?’.
- Last week, dividend growth of ‘The List’ stayed the course and has increased by +8.8% YTD (income).
- Last week, the price of ‘The List’ was down slightly with a return of +12.9% YTD (capital).
- Last week, there was one dividend announcement from a company on ‘The List’.
- Last week, there were no earnings reports from companies on ‘The List’.
- This week, no companies on ‘The List’ are due to report earnings.
DGI Clipboard
“Current yield, using its own historic yield as a guide, is, in my view, a fine valuation measure.”
– Tom Connolly
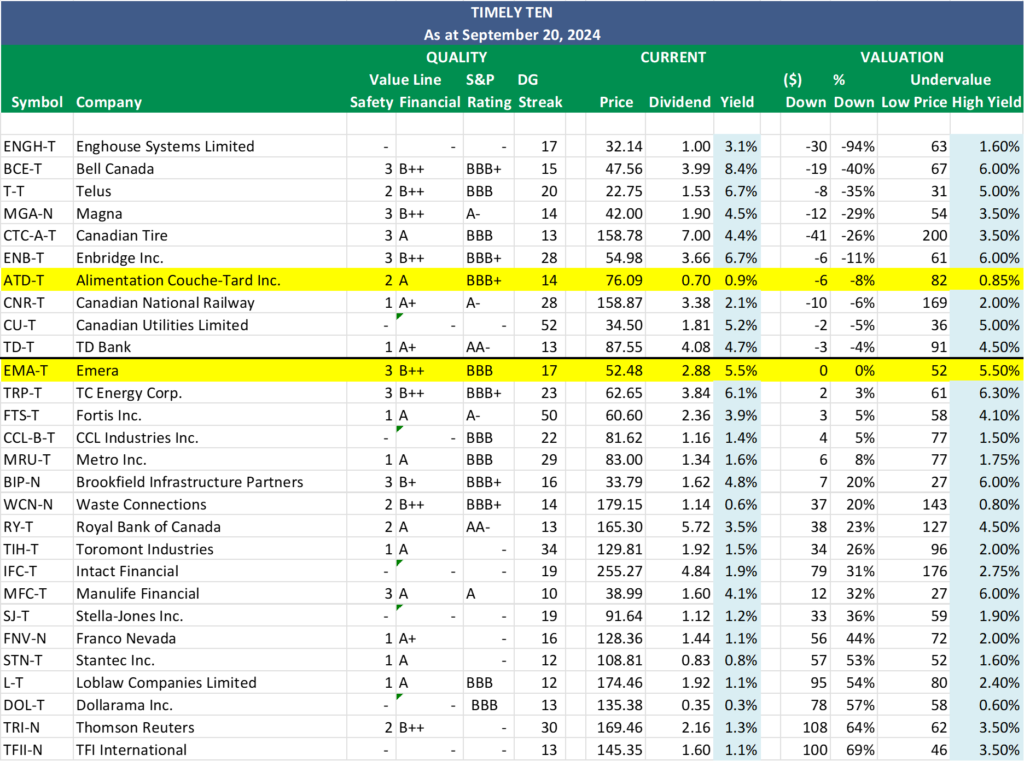
New Addition to Our ‘Timely Ten’: Couche-Tard’s 7-Eleven Bid: Risk or Opportunity for Investors?

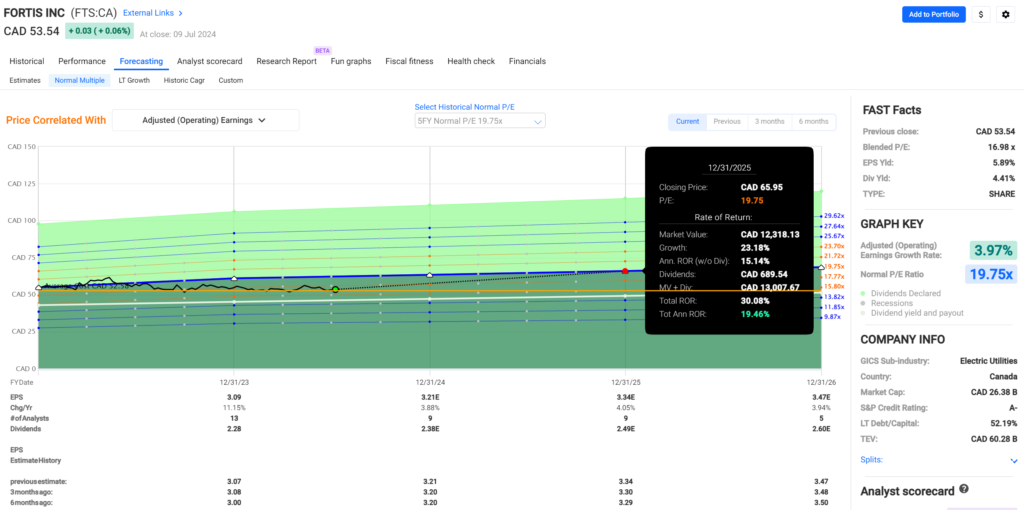
This month, we welcome a new candidate to our ‘Timely Ten’ list of the most undervalued dividend growth stocks: Alimentation Couche-Tard Inc. (Couche-Tard). It has climbed several spots, replacing Emera in our ‘Timely Ten.’
Recently, Couche-Tard approached Seven & i Holdings Co. Ltd., the Japanese parent company of 7-Eleven, with a bold acquisition proposal. If successful, this move would position the Montreal-based company as a dominant force in the global convenience store industry.
The market, however, is speculating that to acquire 7-Eleven, Couche-Tard may need to take on significant debt and potentially divest some U.S. assets, creating uncertainty. But where there is uncertainty, there can also be opportunity.
We saw a similar scenario in early 2021 when Couche-Tard made a $25 billion bid for European grocer Carrefour SA. The stock dropped below $40, and we seized that moment to buy shares (Green Dot) in this high-quality company.
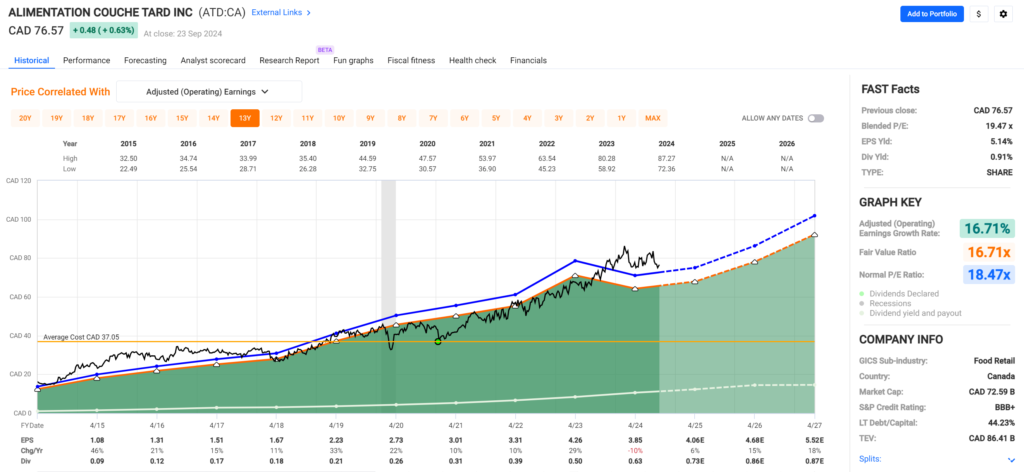
The bid for Carrefour was ultimately dropped after strong opposition from the French government, which cited the need to “preserve the country’s food security and sovereignty.” Despite this setback, Couche-Tard’s stock more than doubled in value afterward.
The key takeaway is that while we can’t predict the future, investing in quality dividend growers that meet our valuation criteria increases the probability of long-term success. By staying patient and focusing on quality and value, we increase the probability of successful investment outcomes.
Many of the remaining ‘Timely Ten’ have been regulars on the list this year, indicating that their challenges might take longer to resolve. This reinforces our commitment to continuously monitoring all companies on ‘The List,’ as we aim to avoid tying up capital for extended periods in favour of seizing better opportunities in quality companies that have temporarily fallen out of favour.
Here’s a recap on how we select our ‘Timely Ten’:
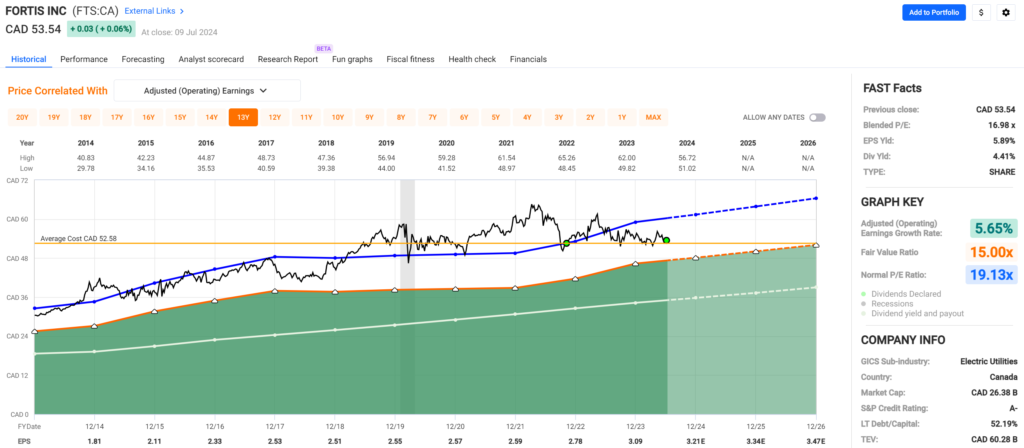
Step three in our process involves monitoring our quality dividend growers regularly, which can become quite challenging depending on the number of companies we track. Fortunately, we rely on ‘The List’ instead of the vast array of stocks in the index, which streamlines our task. Nevertheless, we continually seek methods to enhance our efficiency. Through dividend yield theory, we’ve discovered an approach that has proven remarkably effective in aiding us with our efforts over the years.
Dividend yield theory is a simple and intuitive approach to valuing dividend growth stocks. It suggests that the dividend yield of quality dividend growth stocks tends to revert to the mean over time, assuming that the underlying business model remains stable. In practical terms, if a stock pays a dividend yield above its ten-year average annual yield, its price will likely increase to return the yield to its historical average. Knowing that price and yield go in opposite directions, this theory helps us find stocks poised for a positive price correction.
We have pre-screened our candidates using the criteria we initially laid out in building ‘The List’. This helps us considerably narrow the universe of investable stocks.
- Dividend growth streak: 10 years or more.
- Market cap: Minimum one billion dollars.
- Diversification: Limit of five companies per sector, preferably two per industry.
- Cyclicality: Exclude REITs and pure-play energy companies due to high cyclicality.
Next, we rank ‘The List’ by how significantly each stock is priced below its fair value (Low Price), as calculated using dividend yield theory. To determine fair value, divide the current dividend by what you consider to be the stock’s historically high yield.
All companies above the thick black line have a current price below fair value (sensibly priced). The stocks above the thick black line make up our ‘Timely Ten’.
When making investment decisions, always prioritize a company’s ‘quality’ over a ‘sensible price’. For more details on stock selection and our quality indicators, refer to our free sample Business Plan.
If you’re a new investor without any positions in the ‘Timely Ten’, now is the time to start your research and get to work.
DGI Scorecard
The List (2024)
The Magic Pants 2024 list includes 28 Canadian dividend growth stocks. Here are the criteria to be considered a candidate on ‘The List’:
- Dividend growth streak: 10 years or more.
- Market cap: Minimum one billion dollars.
- Diversification: Limit of five companies per sector, preferably two per industry.
- Cyclicality: Exclude REITs and pure-play energy companies due to high cyclicality.
Based on these criteria, companies are added or removed from ‘The List’ annually on January 1. Prices and dividends are updated weekly.
While ‘The List’ is not a standalone portfolio, it functions admirably as an initial guide for those seeking to broaden their investment portfolio and attain superior returns in the Canadian stock market. Our newsletter provides readers with a comprehensive insight into the implementation and advantages of our Canadian dividend growth investing strategy. This evidence-based, unbiased approach empowers DIY investors to outperform both actively managed dividend funds and passively managed indexes and dividend ETFs over longer-term horizons.
For those interested in something more, please upgrade to a paid subscriber; you get the enhanced weekly newsletter, access to premium content, full privileges on the new Substack website magicpants.substack.com and DGI alerts whenever we make stock transactions in our model portfolio.
Performance of ‘The List’
Last week, dividend growth of ‘The List’ stayed the course and has now increased by +8.8% YTD (income).
Last week, the price return of ‘The List’ was down with a return of +12.9% YTD (capital).
Even though prices may fluctuate, the dependable growth in our income does not. Stay the course. You will be happy you did.
Last week’s best performers on ‘The List’ were Magna (MGA-N), up +4.48%; Enghouse Systems Limited (ENGH-T), up +4.28%; and TD Bank (TD-T), up +3.56%.
Metro Inc. (MRU-T) was the worst performer last week, down -4.00%.
| SYMBOL | COMPANY | YLD | PRICE | YTD % | DIV | YTD % | STREAK |
|---|---|---|---|---|---|---|---|
| ATD-T | Alimentation Couche-Tard Inc. | 0.9% | $76.09 | -0.9% | $0.70 | 17.4% | 14 |
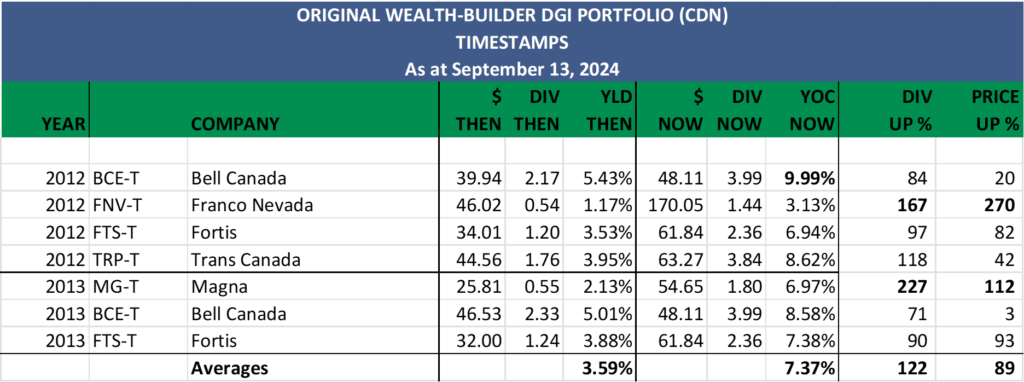
| BCE-T | Bell Canada | 8.4% | $47.56 | -12.2% | $3.99 | 3.1% | 15 |
| BIP-N | Brookfield Infrastructure Partners | 4.8% | $33.79 | 10.1% | $1.62 | 5.9% | 16 |
| CCL-B-T | CCL Industries Inc. | 1.4% | $81.62 | 41.1% | $1.16 | 9.4% | 22 |
| CNR-T | Canadian National Railway | 2.1% | $158.87 | -4.8% | $3.38 | 7.0% | 28 |
| CTC-A-T | Canadian Tire | 4.4% | $158.78 | 14.6% | $7.00 | 1.4% | 13 |
| CU-T | Canadian Utilities Limited | 5.2% | $34.50 | 7.4% | $1.81 | 0.9% | 52 |
| DOL-T | Dollarama Inc. | 0.3% | $135.38 | 42.5% | $0.35 | 29.5% | 13 |
| EMA-T | Emera | 5.5% | $52.48 | 3.3% | $2.88 | 3.2% | 17 |
| ENB-T | Enbridge Inc. | 6.7% | $54.98 | 13.6% | $3.66 | 3.1% | 28 |
| ENGH-T | Enghouse Systems Limited | 3.1% | $32.14 | -5.4% | $1.00 | 18.3% | 17 |
| FNV-N | Franco Nevada | 1.1% | $128.36 | 16.6% | $1.44 | 5.9% | 16 |
| FTS-T | Fortis Inc. | 3.9% | $60.60 | 10.5% | $2.36 | 3.3% | 50 |
| IFC-T | Intact Financial | 1.9% | $255.27 | 25.6% | $4.84 | 10.0% | 19 |
| L-T | Loblaw Companies Limited | 1.1% | $174.46 | 35.7% | $1.92 | 10.0% | 12 |
| MFC-T | Manulife Financial | 4.1% | $38.99 | 35.0% | $1.60 | 9.6% | 10 |
| MGA-N | Magna | 4.5% | $42.00 | -24.3% | $1.90 | 3.3% | 14 |
| MRU-T | Metro Inc. | 1.6% | $83.00 | 21.2% | $1.34 | 10.7% | 29 |
| RY-T | Royal Bank of Canada | 3.5% | $165.30 | 24.2% | $5.72 | 7.1% | 13 |
| SJ-T | Stella-Jones Inc. | 1.2% | $91.64 | 19.6% | $1.12 | 21.7% | 19 |
| STN-T | Stantec Inc. | 0.8% | $108.81 | 4.0% | $0.83 | 7.8% | 12 |
| T-T | Telus | 6.7% | $22.75 | -4.1% | $1.53 | 7.1% | 20 |
| TD-T | TD Bank | 4.7% | $87.55 | 3.4% | $4.08 | 6.3% | 13 |
| TFII-N | TFI International | 1.1% | $145.35 | 10.8% | $1.60 | 10.3% | 13 |
| TIH-T | Toromont Industries | 1.5% | $129.81 | 15.1% | $1.92 | 11.6% | 34 |
| TRI-N | Thomson Reuters | 1.3% | $169.46 | 18.2% | $2.16 | 10.2% | 30 |
| TRP-T | TC Energy Corp. | 6.1% | $62.65 | 19.8% | $3.84 | 3.2% | 23 |
| WCN-N | Waste Connections | 0.6% | $179.15 | 20.9% | $1.14 | 8.6% | 14 |
| Averages | 3.2% | 12.9% | 8.8% | 21 |
Note: Stocks ending in “-N” declare earnings and dividends in US dollars. To achieve currency consistency between dividends and share price for these stocks, we have shown dividends in US dollars and share price in US dollars (these stocks are listed on a US exchange). The dividends for their Canadian counterparts (-T) would be converted into CDN dollars and would fluctuate with the exchange rate.
Check us out on magicpants.substack.com for more info in this week’s issue….