MP Market Review – August 23, 2024
Last updated by BM on August 26, 2024
Summary
This is a weekly installment of our MP Market Review series, which provides updates on the financial markets and Canadian dividend growth companies we monitor on ‘The List’.
- Investing Isn’t About Perfection—It’s About Winning the Long Game
- Last week, dividend growth of ‘The List’ stayed the course and has increased by +8.8% YTD (income).
- Last week, the price of ‘The List’ was up with a return of +10.8% YTD (capital).
- Last week, there were no dividend announcements from companies on ‘The List’.
- Last week, there was one earnings report from a company on ‘The List’.
- This week, one company on ‘The List’ is due to report earnings.
DGI Clipboard
“In tennis, perfection is impossible… In the 1,526 singles matches I played in my career, I won almost 80% of those matches… Now, I have a question for all of you… what percentage of the POINTS do you think I won in those matches? Only 54%.”
-Roger Federer
Investing Isn’t About Perfection—It’s About Winning the Long Game

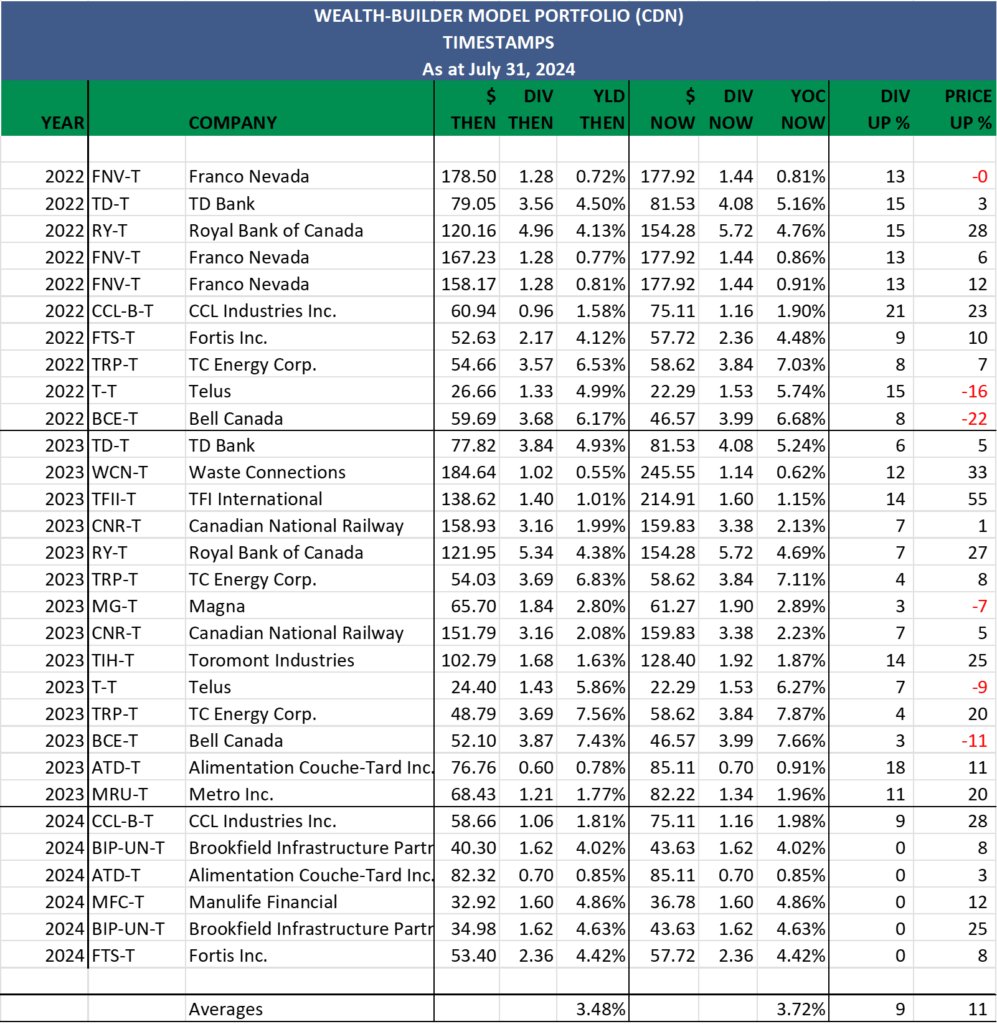
While preparing the latest quarterly report for our model portfolio, I was struck by a quote from Roger Federer. It reminded me of the ‘Timestamps’ chart I include each quarter for our paid subscribers. This chart tracks the performance of our original stock purchases based on their end-of-quarter prices. We derive our portfolio’s winning percentage by calculating the percentage of purchases currently above their original cost.
Federer’s insight is powerful: despite winning 80% of his matches, he only won 54% of the points. This mirrors our experience when investing.
As of July 31, 2024, our winning percentage also stands at 80%. This means that twenty-four of our thirty purchases for the model portfolio are now higher than when we originally bought them. However, this wasn’t always the case. Many of our purchases initially declined before they rose in value, and at times, our winning percentage was barely above 50%.
Like Federer, we focused on the long game and did not get caught up in short-term market fluctuations. We held onto our strong dividend growers and often added to our positions when prices dipped below our initial or second purchase. This confidence in our process, combined with our incremental buying strategy, not only improved our winning percentage but also contributed to higher overall returns in our portfolio as stock prices eventually recovered.
The ‘Timestamps’ chart below illustrates our winning percentage on purchases made in the model portfolio as of July 31, 2024.
We have an advantage over Federer because our game lasts longer. What will our winning percentage look like three, five, or ten years from now? The probability is that it will be significantly higher as dividend growth fuels price appreciation. This is why dividend growth investing (DGI) stands out as one of the safest and most predictable approaches to investing I’ve encountered.
Perfection might be impossible in investing, just as in tennis, but with a long-term horizon, we believe our strategy gets us closer than most.
DGI Scorecard
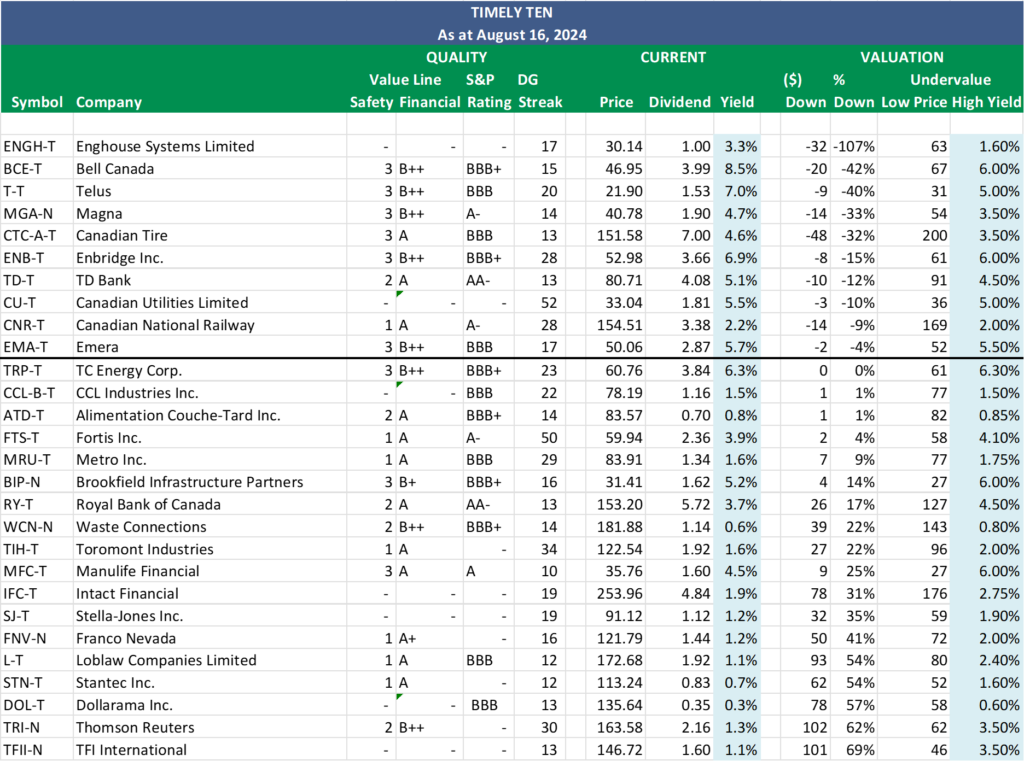
The List (2024)
The Magic Pants 2024 list includes 28 Canadian dividend growth stocks. Here are the criteria to be considered a candidate on ‘The List’:
- Dividend growth streak: 10 years or more.
- Market cap: Minimum one billion dollars.
- Diversification: Limit of five companies per sector, preferably two per industry.
- Cyclicality: Exclude REITs and pure-play energy companies due to high cyclicality.
Based on these criteria, companies are added or removed from ‘The List’ annually on January 1. Prices and dividends are updated weekly.
While ‘The List’ is not a standalone portfolio, it functions admirably as an initial guide for those seeking to broaden their investment portfolio and attain superior returns in the Canadian stock market. Our newsletter provides readers with a comprehensive insight into the implementation and advantages of our Canadian dividend growth investing strategy. This evidence-based, unbiased approach empowers DIY investors to outperform both actively managed dividend funds and passively managed indexes and dividend ETFs over longer-term horizons.
For those interested in something more, please upgrade to a paid subscriber; you get the enhanced weekly newsletter, access to premium content, full privileges on the new Substack website magicpants.substack.com and DGI alerts whenever we make stock transactions in our model portfolio.
Performance of ‘The List’
Last week, dividend growth of ‘The List’ stayed the course and has now increased by +8.8% YTD (income).
Last week, the price return of ‘The List’ was up again with a return of +10.8% YTD (capital).
Even though prices may fluctuate, the dependable growth in our income does not. Stay the course. You will be happy you did.
Last week’s best performers on ‘The List’ were Brookfield Infrastructure Partners (BIP-N), up +4.39%; Magna (MGA-N), up +4.36%; and Canadian National Railway (CNR-T), up +2.72%.
Alimentation Couche-Tard Inc. (ATD-T) was the worst performer last week, down -6.34%.
| SYMBOL | COMPANY | YLD | PRICE | YTD % | DIV | YTD % | STREAK |
|---|---|---|---|---|---|---|---|
| ATD-T | Alimentation Couche-Tard Inc. | 0.9% | $78.27 | 2.0% | $0.70 | 17.4% | 14 |
| BCE-T | Bell Canada | 8.4% | $47.26 | -12.8% | $3.99 | 3.1% | 15 |
| BIP-N | Brookfield Infrastructure Partners | 4.9% | $32.79 | 6.8% | $1.62 | 5.9% | 16 |
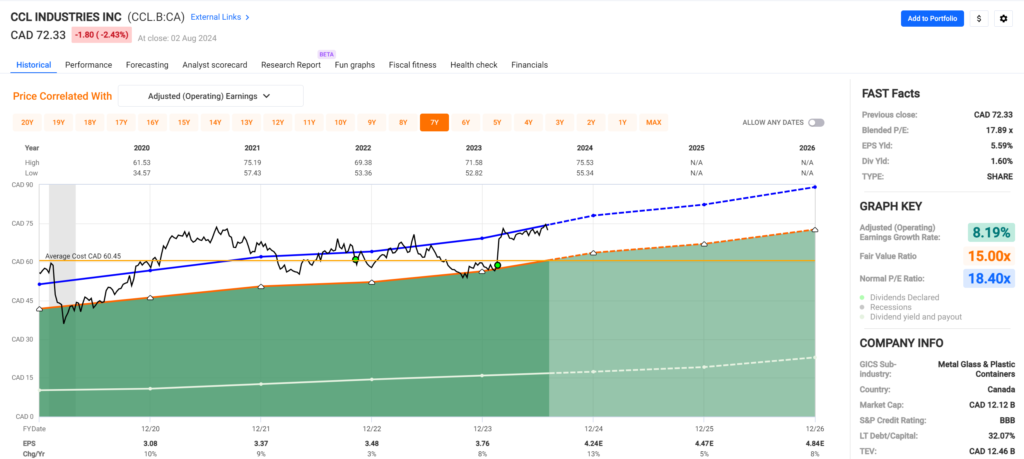
| CCL-B-T | CCL Industries Inc. | 1.5% | $77.09 | 33.3% | $1.16 | 9.4% | 22 |
| CNR-T | Canadian National Railway | 2.1% | $158.71 | -4.9% | $3.38 | 7.0% | 28 |
| CTC-A-T | Canadian Tire | 4.5% | $154.93 | 11.8% | $7.00 | 1.4% | 13 |
| CU-T | Canadian Utilities Limited | 5.5% | $33.18 | 3.3% | $1.81 | 0.9% | 52 |
| DOL-T | Dollarama Inc. | 0.3% | $135.18 | 42.3% | $0.35 | 29.5% | 13 |
| EMA-T | Emera | 5.7% | $50.38 | -0.8% | $2.87 | 3.0% | 17 |
| ENB-T | Enbridge Inc. | 6.8% | $53.60 | 10.7% | $3.66 | 3.1% | 28 |
| ENGH-T | Enghouse Systems Limited | 3.3% | $30.01 | -11.7% | $1.00 | 18.3% | 17 |
| FNV-N | Franco Nevada | 1.2% | $123.54 | 12.2% | $1.44 | 5.9% | 16 |
| FTS-T | Fortis Inc. | 4.0% | $59.49 | 8.5% | $2.36 | 3.3% | 50 |
| IFC-T | Intact Financial | 1.9% | $252.52 | 24.2% | $4.84 | 10.0% | 19 |
| L-T | Loblaw Companies Limited | 1.1% | $172.91 | 34.5% | $1.92 | 10.0% | 12 |
| MFC-T | Manulife Financial | 4.4% | $36.68 | 27.0% | $1.60 | 9.6% | 10 |
| MGA-N | Magna | 4.5% | $42.56 | -23.3% | $1.90 | 3.3% | 14 |
| MRU-T | Metro Inc. | 1.6% | $84.00 | 22.6% | $1.34 | 10.7% | 29 |
| RY-T | Royal Bank of Canada | 3.7% | $156.09 | 17.3% | $5.72 | 7.1% | 13 |
| SJ-T | Stella-Jones Inc. | 1.2% | $92.11 | 20.2% | $1.12 | 21.7% | 19 |
| STN-T | Stantec Inc. | 0.7% | $114.50 | 9.4% | $0.83 | 7.8% | 12 |
| T-T | Telus | 7.0% | $21.73 | -8.4% | $1.53 | 7.1% | 20 |
| TD-T | TD Bank | 5.1% | $80.18 | -5.3% | $4.08 | 6.3% | 13 |
| TFII-N | TFI International | 1.1% | $150.13 | 14.4% | $1.60 | 10.3% | 13 |
| TIH-T | Toromont Industries | 1.6% | $123.60 | 9.6% | $1.92 | 11.6% | 34 |
| TRI-N | Thomson Reuters | 1.3% | $166.24 | 16.0% | $2.16 | 10.2% | 30 |
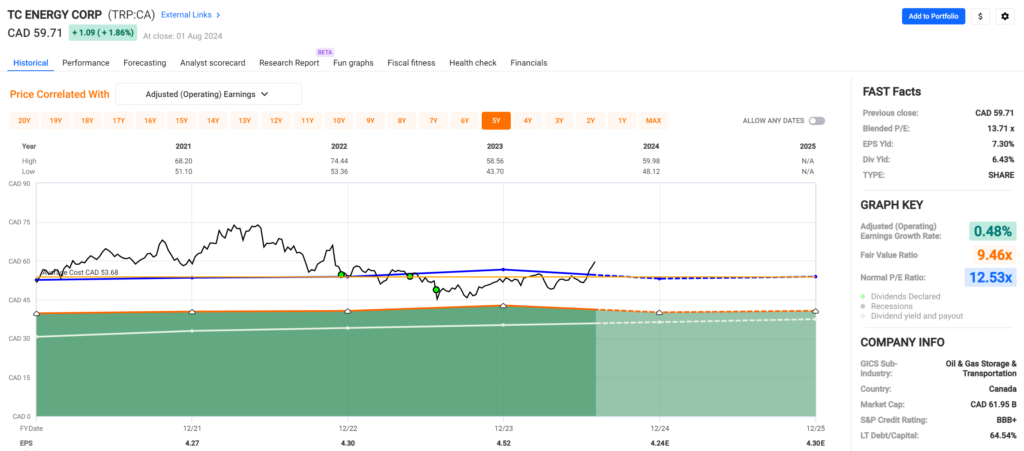
| TRP-T | TC Energy Corp. | 6.3% | $60.89 | 16.4% | $3.84 | 3.2% | 23 |
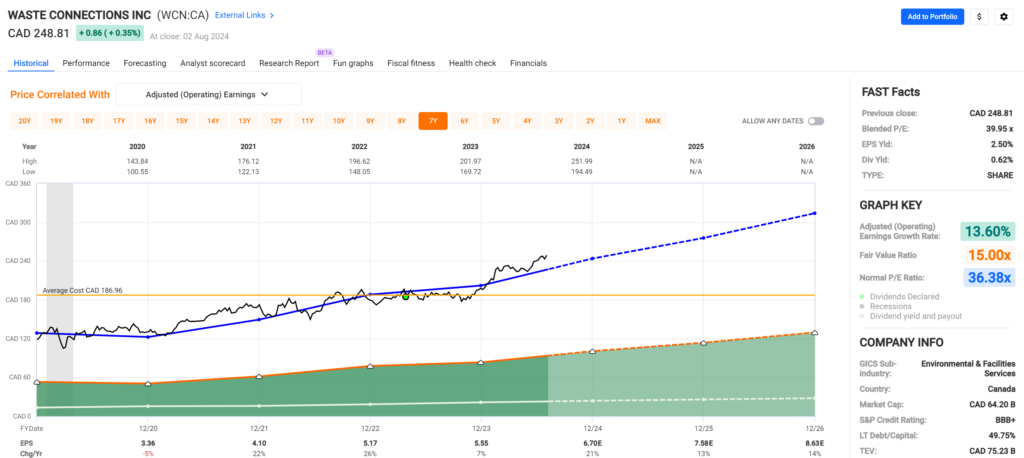
| WCN-N | Waste Connections | 0.6% | $186.43 | 25.8% | $1.14 | 8.6% | 14 |
| Averages | 3.3% | 10.8% | 8.8% | 21 |
Note: Stocks ending in “-N” declare earnings and dividends in US dollars. To achieve currency consistency between dividends and share price for these stocks, we have shown dividends in US dollars and share price in US dollars (these stocks are listed on a US exchange). The dividends for their Canadian counterparts (-T) would be converted into CDN dollars and would fluctuate with the exchange rate.
Check us out on magicpants.substack.com for more info in this week’s issue….