MP Market Review – July 26, 2024
Last updated by BM on July 29, 2024
Summary
This is a weekly installment of our MP Market Review series, which provides updates on the financial markets and Canadian dividend growth companies we monitor on ‘The List’.
- Would You Purchase an Apartment Building If the Tenants Did Not Pay Rent?
- Last week, dividend growth of ‘The List’ stayed the course and has increased by +8.8% YTD (income).
- Last week, the price of ‘The List’ was up with a return of +9.2% YTD (capital).
- Last week, there were no dividend announcements from companies on ‘The List’.
- Last week, there were four earnings reports from companies on ‘The List’.
- This week, eleven companies on ‘The List’ are due to report earnings.
DGI Clipboard
“Stocks, like any other investment, only have value because of their ability to return cash to their owners – if not now, then eventually.”
-Tom Connolly
Would You Purchase an Apartment Building If the Tenants Did Not Pay Rent?

This week, I was reading a white paper by one of my mentors, Tom Connolly. He posed an intriguing question: Would you purchase an apartment building if the tenants did not pay rent?
At first glance, the answer is obvious: of course you wouldn’t. But isn’t that what most investors do when buying a stock that doesn’t pay a dividend?
Our strategy focuses exclusively on companies that pay dividends and, even better, those that offer growing dividends. The more income our quality dividend growers produce, the higher another investor is willing to pay. This growing income is the secret sauce in our strategy and what sets us apart.
It might take a few years to see how a growing dividend drives the price forward in your Dividend Growth Investing (DGI) portfolio, but when it eventually happens—and it will—you’ll wonder why it took you so long to figure it out.
As a bonus, this week, we’re offering free subscribers a snapshot of all the trades in our model DGI portfolio since its inception on May 1, 2022. The model portfolio is an example of our strategy and process in action. Although we are only a couple of years into our business plan, the chart clearly shows that, on average, dividend growth (DIV UP %) and price growth (PRICE UP %) are in sync.
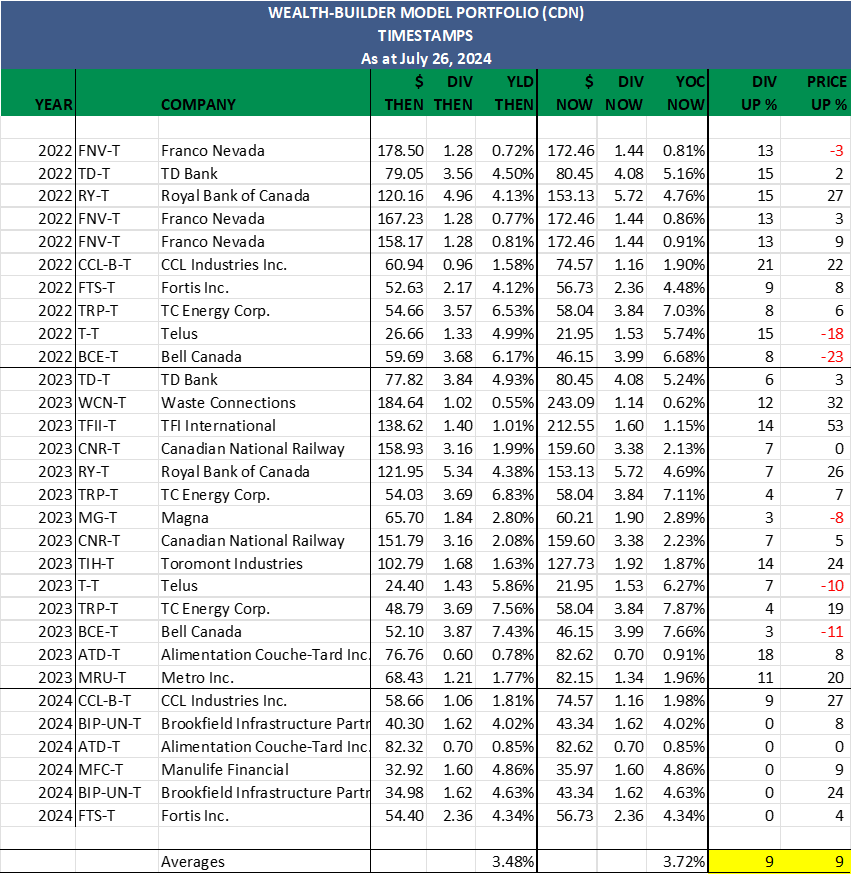
Given a longer-term horizon of five to ten years, the average results will continue to align, and individual stock differences will be closer together, much like CCL Industries and Fortis Inc. above. This phenomenon is what makes our total returns from DGI so dependable.
Another observation from the chart is that our ‘batting average’—the probability of achieving a positive outcome on our trades—is also quite high at 80%. As our investment horizon lengthens, our batting average will get even higher, making our initial capital investment safer. Such a high batting average in the short term demonstrates that our valuation measures are working.
DGI Scorecard
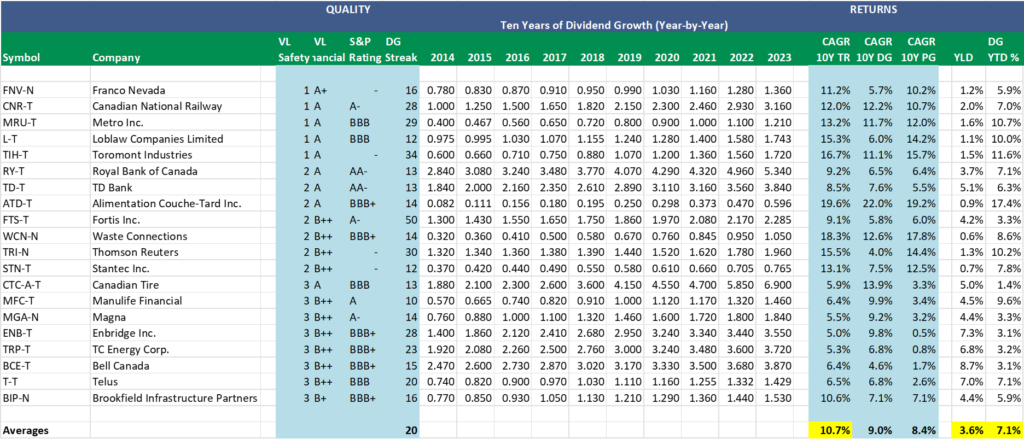
The List (2024)
The Magic Pants 2024 list includes 28 Canadian dividend growth stocks. Here are the criteria to be considered a candidate on ‘The List’:
- Dividend growth streak: 10 years or more.
- Market cap: Minimum one billion dollars.
- Diversification: Limit of five companies per sector, preferably two per industry.
- Cyclicality: Exclude REITs and pure-play energy companies due to high cyclicality.
Based on these criteria, companies are added or removed from ‘The List’ annually on January 1. Prices and dividends are updated weekly.
While ‘The List’ is not a standalone portfolio, it functions admirably as an initial guide for those seeking to broaden their investment portfolio and attain superior returns in the Canadian stock market. Our newsletter provides readers with a comprehensive insight into the implementation and advantages of our Canadian dividend growth investing strategy. This evidence-based, unbiased approach empowers DIY investors to outperform both actively managed dividend funds and passively managed indexes and dividend ETFs over longer-term horizons.
For those interested in something more, please upgrade to a paid subscriber; you get the enhanced weekly newsletter, access to premium content, full privileges on the new Substack website magicpants.substack.com and DGI alerts whenever we make stock transactions in our model portfolio.
Performance of ‘The List’
Last week, dividend growth of ‘The List’ stayed the course and has now increased by +8.8% YTD (income).
Last week, the price return of ‘The List’ was up with a return of +9.2% YTD (capital).
Even though prices may fluctuate, the dependable growth in our income does not. Stay the course. You will be happy you did.
Last week’s best performers on ‘The List’ were Canadian Utilities Limited (CU-T), up +4.69%; Emera (EMA-T), up +4.32%; and Dollarama Inc. (DOL-T), up +3.12%.
Canadian National Railway (CNR-T) was the worst performer last week, down -3.66%.
| SYMBOL | COMPANY | YLD | PRICE | YTD % | DIV | YTD % | STREAK |
|---|---|---|---|---|---|---|---|
| ATD-T | Alimentation Couche-Tard Inc. | 0.8% | $82.62 | 7.6% | $0.70 | 17.4% | 14 |
| BCE-T | Bell Canada | 8.6% | $46.15 | -14.8% | $3.99 | 3.1% | 15 |
| BIP-N | Brookfield Infrastructure Partners | 5.2% | $31.36 | 2.2% | $1.62 | 5.9% | 16 |
| CCL-B-T | CCL Industries Inc. | 1.6% | $74.57 | 28.9% | $1.16 | 9.4% | 22 |
| CNR-T | Canadian National Railway | 2.1% | $159.60 | -4.4% | $3.38 | 7.0% | 28 |
| CTC-A-T | Canadian Tire | 4.9% | $143.99 | 3.9% | $7.00 | 1.4% | 13 |
| CU-T | Canadian Utilities Limited | 5.7% | $31.95 | -0.5% | $1.81 | 0.9% | 52 |
| DOL-T | Dollarama Inc. | 0.3% | $130.91 | 37.8% | $0.35 | 29.5% | 13 |
| EMA-T | Emera | 5.9% | $49.01 | -3.5% | $2.87 | 3.0% | 17 |
| ENB-T | Enbridge Inc. | 7.2% | $50.72 | 4.8% | $3.66 | 3.1% | 28 |
| ENGH-T | Enghouse Systems Limited | 3.3% | $30.23 | -11.0% | $1.00 | 18.3% | 17 |
| FNV-N | Franco Nevada | 1.2% | $124.64 | 13.2% | $1.44 | 5.9% | 16 |
| FTS-T | Fortis Inc. | 4.2% | $56.73 | 3.4% | $2.36 | 3.3% | 50 |
| IFC-T | Intact Financial | 2.0% | $244.71 | 20.4% | $4.84 | 10.0% | 19 |
| L-T | Loblaw Companies Limited | 1.1% | $168.73 | 31.3% | $1.92 | 10.0% | 12 |
| MFC-T | Manulife Financial | 4.4% | $35.97 | 24.5% | $1.60 | 9.6% | 10 |
| MGA-N | Magna | 4.4% | $43.53 | -21.6% | $1.90 | 3.3% | 14 |
| MRU-T | Metro Inc. | 1.6% | $82.15 | 19.9% | $1.34 | 10.7% | 29 |
| RY-T | Royal Bank of Canada | 3.7% | $153.13 | 15.1% | $5.72 | 7.1% | 13 |
| SJ-T | Stella-Jones Inc. | 1.2% | $95.91 | 25.2% | $1.12 | 21.7% | 19 |
| STN-T | Stantec Inc. | 0.7% | $118.97 | 13.7% | $0.83 | 7.8% | 12 |
| T-T | Telus | 7.0% | $21.95 | -7.5% | $1.53 | 7.1% | 20 |
| TD-T | TD Bank | 5.1% | $80.45 | -5.0% | $4.08 | 6.3% | 13 |
| TFII-N | TFI International | 1.0% | $153.78 | 17.2% | $1.60 | 10.3% | 13 |
| TIH-T | Toromont Industries | 1.5% | $127.73 | 13.2% | $1.92 | 11.6% | 34 |
| TRI-N | Thomson Reuters | 1.3% | $161.70 | 12.8% | $2.16 | 10.2% | 30 |
| TRP-T | TC Energy Corp. | 6.6% | $58.04 | 11.0% | $3.84 | 3.2% | 23 |
| WCN-N | Waste Connections | 0.6% | $175.66 | 18.6% | $1.14 | 8.6% | 14 |
| Averages | 3.3% | 9.2% | 8.8% | 21 |
Note: Stocks ending in “-N” declare earnings and dividends in US dollars. To achieve currency consistency between dividends and share price for these stocks, we have shown dividends in US dollars and share price in US dollars (these stocks are listed on a US exchange). The dividends for their Canadian counterparts (-T) would be converted into CDN dollars and would fluctuate with the exchange rate.
Check us out on magicpants.substack.com for more info in this week’s issue….