“You have a pair of pants. In the left pocket, you have $100. You take $1 out of the left pocket and put in the right pocket. You now have $101. There is no diminution of dollars in your left pocket. That is one magic pair of pants.”

MP Market Review – June 28, 2024

Last updated by BM on July 2, 2024

Summary


This is a weekly installment of our MP Market Review series, which provides updates on the financial markets and Canadian dividend growth companies we monitor on ‘The List’.

  • How to ‘Bondify’ your DGI Portfolio in this week’s newsletter.
  • Last week, dividend growth of ‘The List’ stayed the course and has increased by +8.8% YTD (income).
  • Last week, the price of ‘The List’ was up with a return of +3.9% YTD (capital).
  • Last week, there were no dividend announcements from companies on ‘The List’.
  • Last week, there was an earnings report from a company on ‘The List’.
  • This week, no companies on ‘The List’ are due to report earnings.

DGI Clipboard


“You want to start your dividend growth retirement portfolio as early as you can so that, come retirement, more of your portfolio is ‘bondified’. That way, most of your retirement portfolio is free from market risk. Bondified, to me, means the distance between your purchase price and the current price is really large.”

– Tom Connolly

‘Bondify’ your DGI Portfolio by Selecting Quality Companies at Sensible Prices 

Not every stock on ‘The List’ ends up in our dividend growth investing (DGI) portfolio. ‘The List’ is a teaching tool that screens for candidates based on a set criterion across the universe of dividend growth stocks in Canada. To end up in our portfolio a candidate would need to score high on ‘quality’ using our many quality indicators. Then and only then would we look at valuation.

Despite the superior quality of our dividend growers, we exercise caution and do not initiate or augment a position unless the stock is ‘sensibly priced.’ Here are the four methods we use to assess valuation. 

  1. Historical Fundamentals
  2. Dividend Yield Theory
  3. CAPE Ratio
  4. Graham Value 

In today’s post we will review the ‘historical fundamentals’ method of arriving at a sensible price using Fortis Inc. (FTS-T), one of the highest quality candidates on ‘The List’. 

Historical Fundamentals 

A company’s operating results will determine its stock price in the long run. Analyzing a company’s historical fundamentals provides insight into how the business has been valued over an extended period. Many of the stocks we invest in have a ‘narrow valuation corridor,’ meaning the stock price follows a path that rarely deviates from its historical trading range. A company’s P/E (Price to Adjusted Operating Earnings), OCF (Price to Operating Cash Flow), EBITDA (Price to Earnings Before Interest, Taxes, and Amortization), and Sales (Price to Sales) ranges tell us a lot about how a company has been traditionally valued.

Purchasing at the bottom of these ranges or selling at the top has helped us manage our entry and exit points to enhance returns.

We use the Fundamental Analyzer Software Tool (FASTgraphs) to visualize how a company has been historically valued. We like to see it trading within its typical ‘valuation corridor’ based on a ten-to-twelve-year timeline. This gives us a clearer picture of how the stock has traded in different economic cycles.

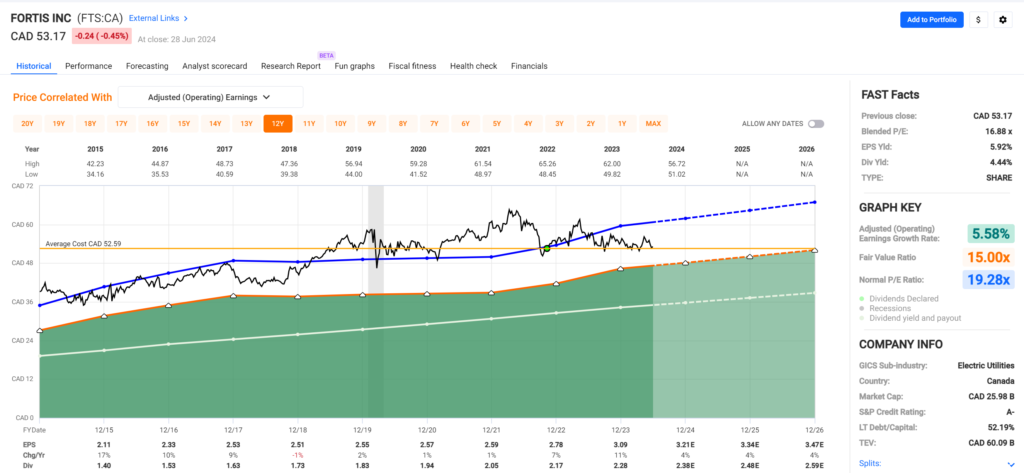
FASTgraphs – “FG” 

The following colours/lines on the “FG” chart shown below represent: 

  • Black line: Price
  • White line: Dividend
  • Orange line: Graham average of usually 15 P/E (price/earnings) for most stocks
  • Blue line: Normal P/E
  • Dashed or dotted lines: Estimates only
  • Green area: Earnings

Source: FASTgraphs

Having the luxury of viewing several fundamental metrics in one graphic certainly helps to assess a company’s current valuation quickly and look for any patterns. Selecting a trading cycle of at least a decade also helps eliminate any short-term bias. It gives a pretty good idea of how a company reacts to recessionary and volatile market periods.

Fortis Inc.’s price (black line) is surprisingly stable throughout all periods and closely tracks its average price-to-earnings ratio (blue line). We also quickly notice that both the earnings (green area) and dividends (white line) have increased at about the same rate over the last decade, indicating that management has been careful not to overextend themselves when paying out dividends.

Regarding entry and exit points, it doesn’t get more straightforward than Fortis Inc. Buying when the price dips are at or below the average P/E (blue line) and selling when it rises well above provides a high probability of a successful trading outcome. Alternatively, holding and adding to your position when the price falls below the average P/E (blue line) would have generated a growing income stream far beyond what any bond or GIC could have provided. A price (black line) that has also risen proportionately ensures that your initial investment is only becoming safer (from the market) as time passes. This is why one of my mentors, Tom Connolly, likes to call companies like Fortis Inc. ‘bondified.’

To top it off, Fortis Inc. has been paying a growing dividend for over 50 consecutive years!

We originally purchased Fortis Inc. for our model portfolio in November last year. With an above-average starting yield and another 4-6% dividend increase likely to be announced in September, the valuation, based on ‘historical fundamentals’, is again becoming compelling.

DGI Scorecard

 
The List (2024)


The Magic Pants 2024 list includes 28 Canadian dividend growth stocks. Here are the criteria to be considered a candidate on ‘The List’:

  1. Dividend growth streak: 10 years or more.
  2. Market cap: Minimum one billion dollars.
  3. Diversification: Limit of five companies per sector, preferably two per industry.
  4. Cyclicality: Exclude REITs and pure-play energy companies due to high cyclicality.

Based on these criteria, companies are added or removed from ‘The List’ annually on January 1. Prices and dividends are updated weekly.

While ‘The List’ is not a standalone portfolio, it functions admirably as an initial guide for those seeking to broaden their investment portfolio and attain superior returns in the Canadian stock market. Our newsletter provides readers with a comprehensive insight into the implementation and advantages of our Canadian dividend growth investing strategy. This evidence-based, unbiased approach empowers DIY investors to outperform both actively managed dividend funds and passively managed indexes and dividend ETFs over longer-term horizons.

For those interested in something more, please upgrade to a paid subscriber; you get the enhanced weekly newsletter, access to premium content, full privileges on the new Substack website magicpants.substack.com and DGI alerts whenever we make stock transactions in our model portfolio.

Performance of ‘The List’


Last week, dividend growth of ‘The List’ stayed the course and has now increased by +8.8% YTD (income).

Last week, the price return of ‘The List’ was up with a return of +3.9% YTD (capital).

Even though prices may fluctuate, the dependable growth in our income does not. Stay the course. You will be happy you did.

Last week’s best performers on ‘The List’ were TFI International (TFII-N), up +6.08%; Stella-Jones Inc. (SJ-T), up +3.85%; and Manulife Financial (MFC-T), up +3.58%.

Telus (T-T) was the worst performer last week, down -4.08%.

SYMBOL COMPANY YLD PRICE YTD % DIV YTD % STREAK
ATD-T Alimentation Couche-Tard Inc. 0.9% $76.77 0.0% $0.70 17.4% 14
BCE-T Bell Canada 9.0% $44.31 -18.2% $3.99 3.1% 15
BIP-N Brookfield Infrastructure Partners 5.9% $27.44 -10.6% $1.62 5.9% 16
CCL-B-T CCL Industries Inc. 1.6% $71.94 24.4% $1.16 9.4% 22
CNR-T Canadian National Railway 2.1% $161.66 -3.1% $3.38 7.0% 28
CTC-A-T Canadian Tire 5.2% $135.74 -2.1% $7.00 1.4% 13
CU-T Canadian Utilities Limited 6.1% $29.55 -8.0% $1.81 0.9% 52
DOL-T Dollarama Inc. 0.3% $124.91 31.5% $0.35 29.5% 13
EMA-T Emera 6.3% $45.65 -10.1% $2.87 3.0% 17
ENB-T Enbridge Inc. 7.5% $48.67 0.6% $3.66 3.1% 28
ENGH-T Enghouse Systems Limited 3.3% $30.17 -11.2% $1.00 18.3% 17
FNV-N Franco Nevada 1.2% $118.52 7.6% $1.44 5.9% 16
FTS-T Fortis Inc. 4.4% $53.17 -3.1% $2.36 3.3% 50
IFC-T Intact Financial 2.1% $228.01 12.1% $4.84 10.0% 19
L-T Loblaw Companies Limited 1.2% $158.70 23.5% $1.92 10.0% 12
MFC-T Manulife Financial 4.4% $36.43 26.1% $1.60 9.6% 10
MGA-N Magna 4.5% $41.90 -24.5% $1.90 3.3% 14
MRU-T Metro Inc. 1.8% $75.79 10.6% $1.34 10.7% 29
RY-T Royal Bank of Canada 3.9% $145.65 9.5% $5.72 7.1% 13
SJ-T Stella-Jones Inc. 1.3% $89.27 16.5% $1.12 21.7% 19
STN-T Stantec Inc. 0.7% $114.53 9.4% $0.83 7.8% 12
T-T Telus 7.4% $20.71 -12.7% $1.53 7.1% 20
TD-T TD Bank 5.4% $75.20 -11.2% $4.08 6.3% 13
TFII-N TFI International 1.1% $145.16 10.6% $1.60 10.3% 13
TIH-T Toromont Industries 1.6% $121.13 7.4% $1.92 11.6% 34
TRI-N Thomson Reuters 1.3% $168.57 17.6% $2.16 10.2% 30
TRP-T TC Energy Corp. 7.4% $51.86 -0.9% $3.84 3.2% 23
WCN-N Waste Connections 0.7% $175.36 18.4% $1.14 8.6% 14
Averages 3.5% 3.9% 8.8% 21

Note: Stocks ending in “-N” declare earnings and dividends in US dollars. To achieve currency consistency between dividends and share price for these stocks, we have shown dividends in US dollars and share price in US dollars (these stocks are listed on a US exchange). The dividends for their Canadian counterparts (-T) would be converted into CDN dollars and would fluctuate with the exchange rate.

Check us out on magicpants.substack.com for more info in this week’s issue….

MP Market Review – June 21, 2024

Last updated by BM on June 24, 2024

Summary


This is a weekly installment of our MP Market Review series, which provides updates on the financial markets and Canadian dividend growth companies we monitor on ‘The List’.

  • Unlocking Wealth: The 7% in 10 Years Dividend Growth Test in this week’s newsletter.
  • Last week, dividend growth of ‘The List’ stayed the course and has increased by +8.8% YTD (income).
  • Last week, price return of ‘The List’ was down with a return of +2.5% YTD (capital).
  • Last week, there were no dividend announcements from companies on ‘The List’.
  • Last week, there were no earnings reports from companies on ‘The List’.
  • This week, one company on ‘The List’ is due to report earnings.

DGI Clipboard


“Dividend growth is the hidden magic in plain sight. We hold because after ten years, our yield is at least 5%, on average 7% and often about 10%.”

-Tom Connolly

Unlocking Wealth: The 7% in 10 Years Dividend Growth Test

Our strategy and the safety of our capital hinges on the growing income generated by a select group of quality companies. While stock prices may vary, our overall income consistently increases. The downside is the need for patience for this growth. What are we waiting for? The dividend, the income, the yield.

Our strategy and our safety depends upon the growing income from a few leading companies, not the market, not a fund, nor over-diversification.

A quick test I like to perform is our “7% in 10 Years” test. This test helps identify dividend growth stocks that are attractive investments today. If your income stream (without reinvesting dividends) is projected to grow to a yield of 7% in ten years, then it has the potential to be a good investment opportunity.

In monetary terms, if you invest $10,000 today, you can expect to receive $700 annually from dividends alone within ten years. How does an investment bought today generate a 7% return on dividends alone ten years from now? The answer is that the dividend grows!

One reason I use 7% as my numerical goal is that equities have historically provided around 7% returns over the last 100 years. Generating a return within a decade equal to the stock market’s historical total return from the dividend alone demonstrates the magic of dividend growth investing.

Another advantage of using at least a decade as your investment horizon is that the distance between your purchase and current prices is typically significant.

Let’s look at an example of growing yield and its effect on price using a company on ‘The List’:

An investment in CCL Industries Inc. on January 1, 2014, would now generate a ‘growth yield’ of 7.39%. An investor would outperform most indexes and dividend fund managers on dividends alone from this quality dividend grower in less than a decade. Imagine the growth yield in another ten years!

How did the price react to this growing yield?

Not bad as well. The price went up four and a half times!

Formulas for calculating historical and estimated growth yield:

  • Historical Growth Yield Calculation: (Current Dividend / Price on Jan. 1, 2014)
  • Estimated Forward Growth: (Current Yield * 5YR average annual dividend growth rate ^ Period (10 years)

Not all companies on ‘The List’ will generate a 7% dividend return in ten years, but assembling a portfolio with growth yield in mind is a conservative way to win with dividend growth investing. This simple test helps screen for quality dividend growth companies.

DGI Scorecard

 
The List (2024)


The Magic Pants 2024 list includes 28 Canadian dividend growth stocks. Here are the criteria to be considered a candidate on ‘The List’:

  1. Dividend growth streak: 10 years or more.
  2. Market cap: Minimum one billion dollars.
  3. Diversification: Limit of five companies per sector, preferably two per industry.
  4. Cyclicality: Exclude REITs and pure-play energy companies due to high cyclicality.

Based on these criteria, companies are added or removed from ‘The List’ annually on January 1. Prices and dividends are updated weekly.

While ‘The List’ is not a standalone portfolio, it functions admirably as an initial guide for those seeking to broaden their investment portfolio and attain superior returns in the Canadian stock market. Our newsletter provides readers with a comprehensive insight into the implementation and advantages of our Canadian dividend growth investing strategy. This evidence-based, unbiased approach empowers DIY investors to outperform both actively managed dividend funds and passively managed indexes and dividend ETFs over longer-term horizons.

For those interested in something more, please upgrade to a paid subscriber; you get the enhanced weekly newsletter, access to premium content, full privileges on the new Substack website magicpants.substack.com and DGI alerts whenever we make stock transactions in our model portfolio.

Performance of ‘The List’


Last week, dividend growth of ‘The List’ stayed the course and has now increased by +8.8% YTD (income).

Last week, price return of ‘The List’ was down with a return of +2.5% YTD (capital).

Even though prices may fluctuate, the dependable growth in our income does not. Stay the course. You will be happy you did.

Last week’s best performers on ‘The List’ were Waste Connections (WCN-N), up +3.56%; Alimentation Couche-Tard Inc. (ATD-T), up +2.83%; and Manulife Financial (MFC-T), up +1.94%.

Canadian National Railway (CNR-T) was the worst performer last week, down -4.29%.

SYMBOL COMPANY YLD PRICE YTD % DIV YTD % STREAK
ATD-T Alimentation Couche-Tard Inc. 0.9% $78.05 1.7% $0.70 17.4% 14
BCE-T Bell Canada 8.9% $44.65 -17.6% $3.99 3.1% 15
BIP-N Brookfield Infrastructure Partners 6.0% $26.95 -12.2% $1.62 5.9% 16
CCL-B-T CCL Industries Inc. 1.6% $71.04 22.8% $1.16 9.4% 22
CNR-T Canadian National Railway 2.1% $160.11 -4.1% $3.38 7.0% 28
CTC-A-T Canadian Tire 5.1% $136.25 -1.7% $7.00 1.4% 13
CU-T Canadian Utilities Limited 6.2% $29.29 -8.8% $1.81 0.9% 52
DOL-T Dollarama Inc. 0.3% $124.03 30.5% $0.35 29.5% 13
EMA-T Emera 6.4% $44.68 -12.0% $2.87 3.0% 17
ENB-T Enbridge Inc. 7.7% $47.50 -1.9% $3.66 3.1% 28
ENGH-T Enghouse Systems Limited 3.4% $29.73 -12.5% $1.00 18.3% 17
FNV-N Franco Nevada 1.2% $116.72 6.0% $1.44 5.9% 16
FTS-T Fortis Inc. 4.5% $52.70 -3.9% $2.36 3.3% 50
IFC-T Intact Financial 2.2% $223.03 9.7% $4.84 10.0% 19
L-T Loblaw Companies Limited 1.2% $154.24 20.0% $1.92 10.0% 12
MFC-T Manulife Financial 4.5% $35.17 21.8% $1.60 9.6% 10
MGA-N Magna 4.5% $42.22 -23.9% $1.90 3.3% 14
MRU-T Metro Inc. 1.8% $74.07 8.1% $1.34 10.7% 29
RY-T Royal Bank of Canada 4.0% $142.03 6.8% $5.72 7.1% 13
SJ-T Stella-Jones Inc. 1.3% $85.96 12.2% $1.12 21.7% 19
STN-T Stantec Inc. 0.7% $111.83 6.9% $0.83 7.8% 12
T-T Telus 7.1% $21.59 -9.0% $1.53 7.1% 20
TD-T TD Bank 5.5% $73.96 -12.7% $4.08 6.3% 13
TFII-N TFI International 1.2% $136.84 4.3% $1.60 10.3% 13
TIH-T Toromont Industries 1.6% $118.01 4.6% $1.92 11.6% 34
TRI-N Thomson Reuters 1.3% $165.22 15.3% $2.16 10.2% 30
TRP-T TC Energy Corp. 7.3% $52.71 0.8% $3.84 3.2% 23
WCN-N Waste Connections 0.7% $174.61 17.9% $1.14 8.6% 14
Averages 3.5% 2.5% 8.8% 21

Note: Stocks ending in “-N” declare earnings and dividends in US dollars. To achieve currency consistency between dividends and share price for these stocks, we have shown dividends in US dollars and share price in US dollars (these stocks are listed on a US exchange). The dividends for their Canadian counterparts (-T) would be converted into CDN dollars and would fluctuate with the exchange rate.

Check us out on magicpants.substack.com for more info in this week’s issue….

MP Market Review – June 14, 2024

Last updated by BM on June 17, 2024

Summary


This is a weekly installment of our MP Market Review series, which provides updates on the financial markets and Canadian dividend growth companies we monitor on ‘The List’.

  • Getting a Head Start on ‘The List’ for 2025 in this week’s newsletter.
  • Last week, dividend growth of ‘The List’ stayed the course and has increased by +8.8% YTD (income).
  • Last week, price return of ‘The List’ was down with a return of +3.1% YTD (capital).
  • Last week, there were no dividend announcements from companies on ‘The List’.
  • Last week, there were two earnings reports from companies on ‘The List’.
  • This week, no companies on ‘The List’ are due to report earnings.

DGI Clipboard


“This is one of the keys to successful investing: focus on the companies, not on the stocks.”

– Peter Lynch

Getting a Head Start on ‘The List’ for 2025

As we approach the midpoint of 2024, it’s the perfect time to start scouting candidates for next year’s list. Monitoring potential additions closely allows us to evaluate how they compare to our existing list of members.

While we’re comfortable building a portfolio of quality dividend growers from our current list, we always keep an eye on potential future candidates. This forward-thinking approach has paid off in the past, as evidenced by our early additions of TFII-N and MFC-T before launching our public-facing model portfolio in 2022, both of which have proven excellent choices.

Identifying Potential Candidates

We’ve identified six companies on the TSX that will meet our first two criteria for inclusion on ‘The List’ in 2025:

Dividend Growth Streak: At least 10 years.

Market Cap: Minimum of one billion dollars.

Evaluating Candidates

When deciding who stays and who goes, we focus on two additional criteria:

Diversification: We limit it to five companies per sector, preferably two per industry.

Cyclicality: We exclude REITs and pure-play energy companies due to their high cyclicality.

Four of the six potential candidates are in the Financial Services sector, meaning they must be compared against our existing list to determine if there’s room for them based on our diversification criteria.

All the Financial Services companies on our current list have increased their dividends in 2024, making it likely they will remain on next year’s list unless something changes with their long-term earnings power. Thus, only one spot may be available for a new candidate in this sector. The same holds for the Consumer Cyclical and Consumer Defensive sectors, with only one spot open.

Final Decision

The final decision will depend on assessing their cyclicality against our remaining quality indicators. We also like to keep our list manageable. For us, manageability for our Canadian candidates means less than thirty companies on ‘The List’.

Your Input

I welcome your analysis on which of these up-and-coming dividend growers you believe should be on ‘The List’ for next year. Feel free to share your insights!

DGI Scorecard

 
The List (2024)


The Magic Pants 2024 list includes 28 Canadian dividend growth stocks. Here are the criteria to be considered a candidate on ‘The List’:

  1. Dividend growth streak: 10 years or more.
  2. Market cap: Minimum one billion dollars.
  3. Diversification: Limit of five companies per sector, preferably two per industry.
  4. Cyclicality: Exclude REITs and pure-play energy companies due to high cyclicality.

Based on these criteria, companies are added or removed from ‘The List’ annually on January 1. Prices and dividends are updated weekly.

While ‘The List’ is not a standalone portfolio, it functions admirably as an initial guide for those seeking to broaden their investment portfolio and attain superior returns in the Canadian stock market. Our newsletter provides readers with a comprehensive insight into the implementation and advantages of our Canadian dividend growth investing strategy. This evidence-based, unbiased approach empowers DIY investors to outperform both actively managed dividend funds and passively managed indexes and dividend ETFs over longer-term horizons.

For those interested in something more, please upgrade to a paid subscriber; you get the enhanced weekly newsletter, access to premium content, full privileges on the new Substack website magicpants.substack.com and DGI alerts whenever we make stock transactions in our model portfolio.

Performance of ‘The List’


Last week, dividend growth of ‘The List’ stayed the course and has now increased by +8.8% YTD (income).

Last week, price return of ‘The List’ was down with a return of +3.1% YTD (capital).

Even though prices may fluctuate, the dependable growth in our income does not. Stay the course. You will be happy you did.

Last week’s best performers on ‘The List’ were Enghouse Systems Limited (ENGH-T), up +5.0%; Waste Connections (WCN-N), up +1.85%; and CCL Industries Inc. (CCL-B-T), up +0.86%.

Alimentation Couche-Tard Inc. (ATD-T) was the worst performer last week, down -5.29%.

SYMBOL COMPANY YLD PRICE YTD % DIV YTD % STREAK
ATD-T Alimentation Couche-Tard Inc. 0.9% $75.90 -1.1% $0.70 17.4% 14
BCE-T Bell Canada 8.8% $45.18 -16.6% $3.99 3.1% 15
BIP-N Brookfield Infrastructure Partners 5.9% $27.53 -10.3% $1.62 5.9% 16
CCL-B-T CCL Industries Inc. 1.6% $72.68 25.7% $1.16 9.4% 22
CNR-T Canadian National Railway 2.0% $167.29 0.3% $3.38 7.0% 28
CTC-A-T Canadian Tire 5.2% $135.15 -2.5% $7.00 1.4% 13
CU-T Canadian Utilities Limited 5.9% $30.46 -5.2% $1.81 0.9% 52
DOL-T Dollarama Inc. 0.3% $123.85 30.3% $0.35 29.5% 13
EMA-T Emera 6.3% $45.81 -9.8% $2.87 3.0% 17
ENB-T Enbridge Inc. 7.6% $48.25 -0.3% $3.66 3.1% 28
ENGH-T Enghouse Systems Limited 3.3% $30.46 -10.3% $1.00 18.3% 17
FNV-N Franco Nevada 1.2% $116.18 5.5% $1.44 5.9% 16
FTS-T Fortis Inc. 4.4% $53.69 -2.1% $2.36 3.3% 50
IFC-T Intact Financial 2.2% $222.40 9.4% $4.84 10.0% 19
L-T Loblaw Companies Limited 1.2% $156.35 21.6% $1.92 10.0% 12
MFC-T Manulife Financial 4.6% $34.50 19.5% $1.60 9.6% 10
MGA-N Magna 4.5% $42.19 -24.0% $1.90 3.3% 14
MRU-T Metro Inc. 1.8% $73.99 8.0% $1.34 10.7% 29
RY-T Royal Bank of Canada 4.0% $142.87 7.4% $5.72 7.1% 13
SJ-T Stella-Jones Inc. 1.3% $85.00 11.0% $1.12 21.7% 19
STN-T Stantec Inc. 0.7% $113.27 8.2% $0.83 7.8% 12
T-T Telus 7.0% $21.72 -8.4% $1.53 7.1% 20
TD-T TD Bank 5.5% $74.53 -12.0% $4.08 6.3% 13
TFII-N TFI International 1.2% $137.60 4.9% $1.60 10.3% 13
TIH-T Toromont Industries 1.6% $117.56 4.2% $1.92 11.6% 34
TRI-N Thomson Reuters 1.3% $167.33 16.7% $2.16 10.2% 30
TRP-T TC Energy Corp. 7.2% $53.25 1.8% $3.84 3.2% 23
WCN-N Waste Connections 0.7% $168.61 13.8% $1.14 8.6% 14
Averages 3.5% 3.1% 8.8% 21

Note: Stocks ending in “-N” declare earnings and dividends in US dollars. To achieve currency consistency between dividends and share price for these stocks, we have shown dividends in US dollars and share price in US dollars (these stocks are listed on a US exchange). The dividends for their Canadian counterparts (-T) would be converted into CDN dollars and would fluctuate with the exchange rate.

Check us out on magicpants.substack.com for more info in this week’s issue….

MP Market Review – June 7, 2024

Last updated by BM on June 10, 2024

Summary


This is a weekly installment of our MP Market Review series, which provides updates on the financial markets and Canadian dividend growth companies we monitor on ‘The List’.

  • Growth Stocks vs. Dividend Growth Investing, in this week’s newsletter.
  • Last week, dividend growth of ‘The List’ stayed the course and has increased by +8.8% YTD (income).
  • Last week, price return of ‘The List’ was up with a return of +5.2% YTD (capital).
  • Last week, there were no dividend announcements from companies on ‘The List’.
  • Last week, there was no earnings reports from a company on ‘The List’.
  • This week, two companies on ‘The List’ are due to report earnings.

DGI Clipboard


“Where all think alike, no one thinks very much.”

-Walter Lippmann

Growth Stocks vs. Dividend Growth Investing

I was recently invited to join a prestigious investment club founded in 1979. Reviewing the club’s history and bylaws, I realized I was being asked to join the ‘Growth Stock Crowd’. I had tried this approach before and found it challenging. This prompted me to compare the differences between growth stock investing and my preferred method of dividend growth investing for our readers.

The Growth Stock Crowd

Growth stock investors aim to buy stocks at the right time, focusing on companies with rapid growth potential. The goal is to sell these stocks for significant profits and repeat this process continually. Even the most brilliant investors experience both wins and losses, averaging about 7%-9% long-term returns. Perfect market timing and stock selection are unrealistic, as no one can consistently win. Over time, investors hope to improve their skills and achieve more wins than losses.

The Dividend Growth Crowd

In contrast, dividend growth investors like me take a different approach. With years of experience, I may not consider myself extraordinarily intelligent, but I know basic math, how to research earnings reports, and how to assess valuations. More importantly, I have the discipline and patience honed from running my own business for twenty-five years.

Dividend growth investors are passionate about a steady, predictable way to build a secure financial future. Our investment time horizon is indefinite, so we remain undistracted by short-term market fluctuations. We invest in quality companies that consistently pay and grow dividends. Daily share price changes, the broader economic picture, and other details are secondary to a company’s ability to increase its dividend payments. Historically, as dividends grow, so does the stock price. This combination of growing income and capital appreciation is the secret sauce in our strategy, with annualized long-term total returns in the 10%-12% range.

Key Differences Between Growth and Dividend Growth Investing

Growth stock investors juggle multiple factors: selecting the right stocks, assessing current prices, evaluating company products, and timing the perfect sale to make a profit. This process must be repeated continually with different companies.

On the other hand, dividend growth investors focus on ensuring that their chosen companies will continue to pay and increase dividends annually. Lists of companies that have increased dividends for over ten years, even during tough times, are readily available. We follow one such list on this blog every week.

While growth stock investors sell their stocks to realize profits, dividend growth investors rarely sell because doing so would reduce their growing income. This income can also be reinvested in sensibly priced dividend growth companies to increase our returns.

Wrap Up

I plan to attend the investment club’s next meeting to learn more. Life has taught me that personal growth comes from stepping out of your comfort zone occasionally. At the very least, I will meet some interesting people passionate about investing.

DGI Scorecard

 
The List (2024)


The Magic Pants 2024 list includes 28 Canadian dividend growth stocks. Here are the criteria to be considered a candidate on ‘The List’:

  1. Dividend growth streak: 10 years or more.
  2. Market cap: Minimum one billion dollars.
  3. Diversification: Limit of five companies per sector, preferably two per industry.
  4. Cyclicality: Exclude REITs and pure-play energy companies due to high cyclicality.

Based on these criteria, companies are added or removed from ‘The List’ annually on January 1. Prices and dividends are updated weekly.

While ‘The List’ is not a standalone portfolio, it functions admirably as an initial guide for those seeking to broaden their investment portfolio and attain superior returns in the Canadian stock market. Our newsletter provides readers with a comprehensive insight into the implementation and advantages of our Canadian dividend growth investing strategy. This evidence-based, unbiased approach empowers DIY investors to outperform both actively managed dividend funds and passively managed indexes and dividend ETFs over longer-term horizons.

For those interested in something more, please upgrade to a paid subscriber; you get the enhanced weekly newsletter, access to premium content, full privileges on the new Substack website magicpants.substack.com and DGI alerts whenever we make stock transactions in our model portfolio.

Performance of ‘The List’


Last week, dividend growth of ‘The List’ stayed the course and has now increased by +8.8% YTD (income).

Last week, ‘The List’ ‘s price return was up, with a +5.2% YTD (capital).

Even though prices may fluctuate, the dependable growth in our income does not. Stay the course. You will be happy you did.

Last week’s best performers on ‘The List’ were TFI International (TFII-N), up +6.59%; Enghouse Systems Limited (ENGH-T), up +6.11%; and Stella-Jones Inc. (SJ-T), up +5.58%.

Franco Nevada (FNV-N) was the worst performer last week, down -5.04%.

SYMBOL COMPANY YLD PRICE YTD % DIV YTD % STREAK
ATD-T Alimentation Couche-Tard Inc. 0.9% $80.14 4.4% $0.70 17.4% 14
BCE-T Bell Canada 8.5% $47.09 -13.1% $3.99 3.1% 15
BIP-N Brookfield Infrastructure Partners 5.7% $28.55 -7.0% $1.62 5.9% 16
CCL-B-T CCL Industries Inc. 1.6% $72.06 24.6% $1.16 9.4% 22
CNR-T Canadian National Railway 2.0% $170.91 2.4% $3.38 7.0% 28
CTC-A-T Canadian Tire 5.0% $138.69 0.1% $7.00 1.4% 13
CU-T Canadian Utilities Limited 5.8% $31.31 -2.5% $1.81 0.9% 52
DOL-T Dollarama Inc. 0.3% $127.12 33.8% $0.35 29.5% 13
EMA-T Emera 6.0% $47.58 -6.3% $2.87 3.0% 17
ENB-T Enbridge Inc. 7.4% $49.21 1.7% $3.66 3.1% 28
ENGH-T Enghouse Systems Limited 3.4% $29.01 -14.6% $1.00 18.3% 17
FNV-N Franco Nevada 1.2% $117.56 6.7% $1.44 5.9% 16
FTS-T Fortis Inc. 4.3% $55.07 0.4% $2.36 3.3% 50
IFC-T Intact Financial 2.1% $228.54 12.4% $4.84 10.0% 19
L-T Loblaw Companies Limited 1.2% $160.93 25.2% $1.92 10.0% 12
MFC-T Manulife Financial 4.5% $35.59 23.2% $1.60 9.6% 10
MGA-N Magna 4.3% $43.76 -21.2% $1.90 3.3% 14
MRU-T Metro Inc. 1.8% $75.19 9.8% $1.34 10.7% 29
RY-T Royal Bank of Canada 3.9% $146.35 10.0% $5.72 7.1% 13
SJ-T Stella-Jones Inc. 1.3% $85.90 12.1% $1.12 21.7% 19
STN-T Stantec Inc. 0.7% $112.99 8.0% $0.83 7.8% 12
T-T Telus 6.7% $22.76 -4.0% $1.53 7.1% 20
TD-T TD Bank 5.3% $76.45 -9.7% $4.08 6.3% 13
TFII-N TFI International 1.1% $141.00 7.5% $1.60 10.3% 13
TIH-T Toromont Industries 1.6% $120.22 6.6% $1.92 11.6% 34
TRI-N Thomson Reuters 1.3% $170.75 19.1% $2.16 10.2% 30
TRP-T TC Energy Corp. 7.1% $54.18 3.6% $3.84 3.2% 23
WCN-N Waste Connections 0.7% $165.54 11.7% $1.14 8.6% 14
Averages 3.4% 5.2% 8.8% 21

Note: Stocks ending in “-N” declare earnings and dividends in US dollars. To achieve currency consistency between dividends and share price for these stocks, we have shown dividends in US dollars and share price in US dollars (these stocks are listed on a US exchange). The dividends for their Canadian counterparts (-T) would be converted into CDN dollars and would fluctuate with the exchange rate.

Check us out on magicpants.substack.com for more info in this week’s issue….

MP Market Review – May 31, 2024

Last updated by BM on June 3, 2024

Summary


This is a weekly installment of our MP Market Review series, which provides updates on the financial markets and Canadian dividend growth companies we monitor on ‘The List’.

  • MP Wealth Builder Model Portfolio (CDN) Delivers Strong Results. Highlights in this week’s newsletter.
  • Last week, dividend growth of ‘The List’ was up and has increased by +8.8% YTD (income).
  • Last week, price return of ‘The List’ was down with a return of +4.3% YTD (capital).
  • Last week, there was one dividend announcement from a company on ‘The List’.
  • Last week, there was one earnings report from a company on ‘The List’.
  • This week, no companies on ‘The List’ are due to report earnings.

DGI Clipboard


“A true investor buys for the dividend return.”

– Steve Hanke

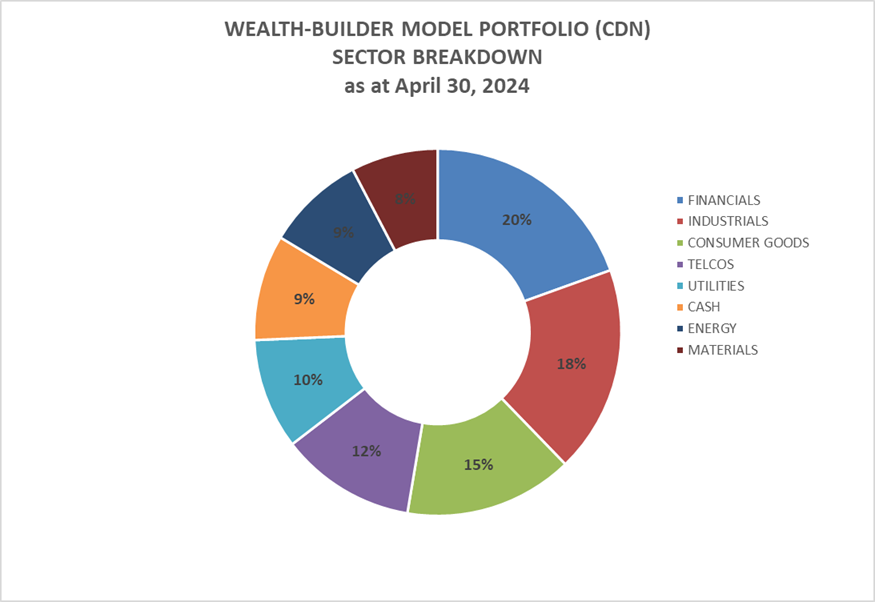
MP Wealth Builder Model Portfolio (CDN) Delivers Strong Results

Last week, we shared our latest quarterly and second-year financial results for the MP Wealth Builder Model Portfolio (CDN). PAID Subscribers can access the full document in our ‘Premium Content’ section and receive DGI alerts whenever we buy or sell within the portfolio. Here are some highlights:

In the quarterly review, I reiterated our approach as DIY dividend growth investors:

This is about buying businesses, not just stocks.

Trusting Canada’s top companies, led by exceptional management teams and supported by thousands of dedicated employees, is key to achieving financial freedom.

We consider our portfolio an asset management business, with our assets being the many dividend growth companies we own. Our plan is to shift from working for our investments to managing our assets and growing our ownership in the investments that work for us.

We continue to outperform our benchmarks with respect to total return and exceed our income and dividend return projections. The MP Wealth-Builder Model Portfolio (CDN) now has a dividend return of 3.69% and continued to grow due to thirteen dividend increase announcements in the last quarter alone. It won’t be long before our return from dividends alone surpasses the total return of the benchmarks.

Our model portfolio now includes seventeen companies spanning seven economic sectors. Despite its concentration, we have achieved significant diversification across several industries.

Our approach is to own the best in each sector, not the most. Think quality, not quantity.

Wrap Up:

For those new to the blog, our model portfolio is being built and managed based on an initial $100,000 investment over the first four years of our business plan, with monthly contributions of $1,000 beginning in year two.

Investors can easily observe the effects of our strategy with more significant amounts of invested capital if they wish. For instance, using the same position sizes as our $100,000 plan, a million-dollar business plan would have generated ten times the annual income and capital gains. The principles of our strategy remain consistent, whether you are investing $1,000 per month, $100,000, or any amount in between.

Our evidence-based, unbiased approach empowers DIY investors to outperform both actively managed dividend funds and passively managed indexes and dividend ETFs over longer-term horizons.

Sign up as a paid subscriber today and start generating real wealth. We do the work, and you stay in control.

DGI Scorecard

 
The List (2024)


The Magic Pants 2024 list includes 28 Canadian dividend growth stocks. Here are the criteria to be considered a candidate on ‘The List’:

  1. Dividend growth streak: 10 years or more.
  2. Market cap: Minimum one billion dollars.
  3. Diversification: Limit of five companies per sector, preferably two per industry.
  4. Cyclicality: Exclude REITs and pure-play energy companies due to high cyclicality.

Based on these criteria, companies are added or removed from ‘The List’ annually on January 1. Prices and dividends are updated weekly.

While ‘The List’ is not a standalone portfolio, it functions admirably as an initial guide for those seeking to broaden their investment portfolio and attain superior returns in the Canadian stock market. Our newsletter provides readers with a comprehensive insight into the implementation and advantages of our Canadian dividend growth investing strategy. This evidence-based, unbiased approach empowers DIY investors to outperform both actively managed dividend funds and passively managed indexes and dividend ETFs over longer-term horizons.

For those interested in something more, please upgrade to a paid subscriber; you get the enhanced weekly newsletter, access to premium content, full privileges on the new Substack website magicpants.substack.com and DGI alerts whenever we make stock transactions in our model portfolio.

Performance of ‘The List’


Last week, dividend growth of ‘The List’ went up on the announcement from Royal Bank of Canada and has now increased by +8.8% YTD (income).

Last week, ‘The List’ ‘s price return was down, with a +4.3% YTD (capital).

Even though prices may fluctuate, the dependable growth in our income does not. Stay the course. You will be happy you did.

Last week’s best performers on ‘The List’ were Dollarama Inc. (DOL-T), up +3.84%; Royal Bank of Canada (RY-T), up +3.52%; and Bell Canada (BCE-T), up +1.59%.

Enghouse Systems Limited (ENGH-T) was the worst performer last week, down -5.07%.

SYMBOL COMPANY YLD PRICE YTD % DIV YTD % STREAK
ATD-T Alimentation Couche-Tard Inc. 0.9% $79.55 3.6% $0.70 17.4% 14
BCE-T Bell Canada 8.6% $46.62 -14.0% $3.99 3.1% 15
BIP-N Brookfield Infrastructure Partners 5.6% $28.89 -5.9% $1.62 5.9% 16
CCL-B-T CCL Industries Inc. 1.7% $70.25 21.5% $1.16 9.4% 22
CNR-T Canadian National Railway 1.9% $173.50 4.0% $3.38 7.0% 28
CTC-A-T Canadian Tire 5.1% $136.04 -1.8% $7.00 1.4% 13
CU-T Canadian Utilities Limited 5.8% $31.08 -3.2% $1.81 0.9% 52
DOL-T Dollarama Inc. 0.3% $129.00 35.8% $0.35 29.5% 13
EMA-T Emera 6.0% $47.46 -6.6% $2.87 3.0% 17
ENB-T Enbridge Inc. 7.3% $49.83 3.0% $3.66 3.1% 28
ENGH-T Enghouse Systems Limited 3.7% $27.34 -19.5% $1.00 18.3% 17
FNV-N Franco Nevada 1.2% $123.80 12.4% $1.44 5.9% 16
FTS-T Fortis Inc. 4.3% $54.51 -0.6% $2.36 3.3% 50
IFC-T Intact Financial 2.1% $228.04 12.2% $4.84 10.0% 19
L-T Loblaw Companies Limited 1.2% $158.30 23.1% $1.92 10.0% 12
MFC-T Manulife Financial 4.5% $35.40 22.6% $1.60 9.6% 10
MGA-N Magna 4.2% $45.21 -18.5% $1.90 3.3% 14
MRU-T Metro Inc. 1.8% $72.63 6.0% $1.34 10.7% 29
RY-T Royal Bank of Canada 3.8% $148.98 12.0% $5.72 7.1% 13
SJ-T Stella-Jones Inc. 1.4% $81.36 6.2% $1.12 21.7% 19
STN-T Stantec Inc. 0.8% $110.00 5.1% $0.83 7.8% 12
T-T Telus 6.8% $22.41 -5.5% $1.53 7.1% 20
TD-T TD Bank 5.4% $76.20 -10.0% $4.08 6.3% 13
TFII-N TFI International 1.2% $132.28 0.8% $1.60 10.3% 13
TIH-T Toromont Industries 1.6% $119.04 5.5% $1.92 11.6% 34
TRI-N Thomson Reuters 1.3% $172.11 20.1% $2.16 10.2% 30
TRP-T TC Energy Corp. 7.3% $52.56 0.5% $3.84 3.2% 23
WCN-N Waste Connections 0.7% $164.32 10.9% $1.14 8.6% 14
Averages 3.4% 4.3% 8.8% 21

Note: Stocks ending in “-N” declare earnings and dividends in US dollars. To achieve currency consistency between dividends and share price for these stocks, we have shown dividends in US dollars and share price in US dollars (these stocks are listed on a US exchange). The dividends for their Canadian counterparts (-T) would be converted into CDN dollars and would fluctuate with the exchange rate.

Check us out on magicpants.substack.com for more info in this week’s issue….

We buy quality individual dividend growth stocks when they are sensibly priced and hold for the growing income.