MP Market Review – May 24, 2024
Last updated by BM on May 27, 2024
Summary
This is a weekly installment of our MP Market Review series, which provides updates on the financial markets and Canadian dividend growth companies we monitor on ‘The List’.
- Two essential charts to review before investing in DGI companies in this week’s newsletter.
- Last week, dividend growth of ‘The List’ stayed the same and has increased by +8.6% YTD (income).
- Last week, price return of ‘The List’ was down with a return of +5.1% YTD (capital).
- Last week, there were no dividend announcements from companies on ‘The List’.
- Last week, there was one earnings report from a company on ‘The List’.
This week, one company on ‘The List’ is due to report earnings.
DGI Clipboard
“We know from research on the stock market in general and from research we have conducted on dividend growth stocks that there is a high correlation between the growth of the dividend and the growth of a stock’s price. Our research indicates that over 10 to 12 year cycles, the correlation between dividend growth and the stock price appreciation has been approximately 80% and over 25- year cycles it’s close to 90%.”
-Ned Davis Research
Two Essential Charts for Smart Dividend Growth Investing

Finding companies with a historical alignment between dividend growth and price growth and purchasing them when their current yields exceed historical averages is a straightforward strategy for successful dividend growth investing.
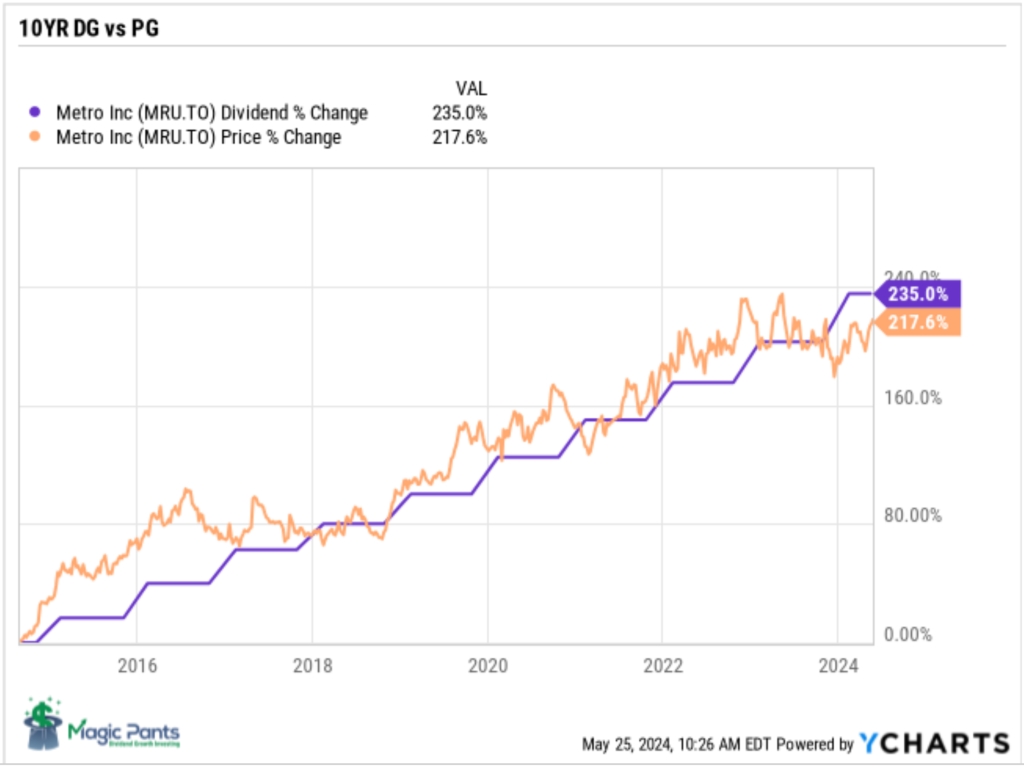
Metro Inc. serves as a prime example within our ‘Core’ category stocks. Let’s examine two crucial charts: dividend growth (DG) versus price growth (PG) alignment and the 10-year yield chart for this quality dividend grower.
Dividend Growth vs. Price Growth Alignment
Over the past decade, Metro Inc.’s stock price has closely mirrored its dividend growth. The price rarely stays out of alignment for long. Dividend growth stocks that behave this way are some of the highest-quality companies in your portfolio. In addition, recognizing and acting on this short-lived misalignment can lead to outperformance in your portfolio returns.
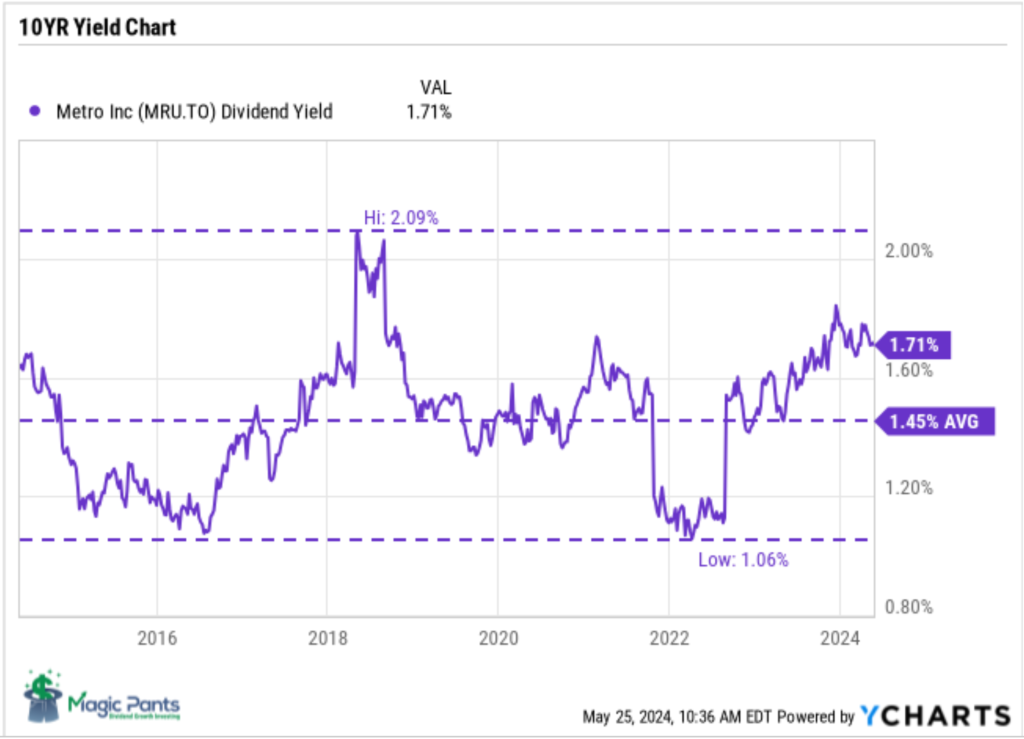
10-Year Yield Chart
The key to our process is identifying value (sensible price) to maximize the return on our investment. How do we know what a sensible price looks like? Dividend yields can help paint a picture.
The average dividend yield for Metro Inc. over the past decade is 1.45%. If you were patient and purchased Metro Inc. when its yield was higher than the average yield you would have been rewarded with an outsized return.
Dividend yield theory is a simple and intuitive approach to valuing dividend growth stocks. It suggests that the dividend yield of quality dividend growth stocks tends to revert to the mean over time, assuming that the underlying business model remains stable. In practical terms, if a stock pays a dividend yield above its ten-year average annual yield, its price will likely increase to return the yield to its historical average. Knowing that price and yield go in opposite directions helps us find stocks that are poised for a positive price correction.
Metro Inc. is certainly one of those stocks that supports this theory.
Conclusion
For conservative investors, history suggests that purchasing Metro Inc. when it is above its average yield has provided outsized capital returns over simply buying at any time.
Final Thoughts
The ten-year dividend growth vs. price growth and yield charts would be invaluable tools if you could rely on only two charts for analyzing and purchasing DGI stocks. They provide clear insights into how dividend growth drives price growth and identify optimal buying opportunities based on yield.
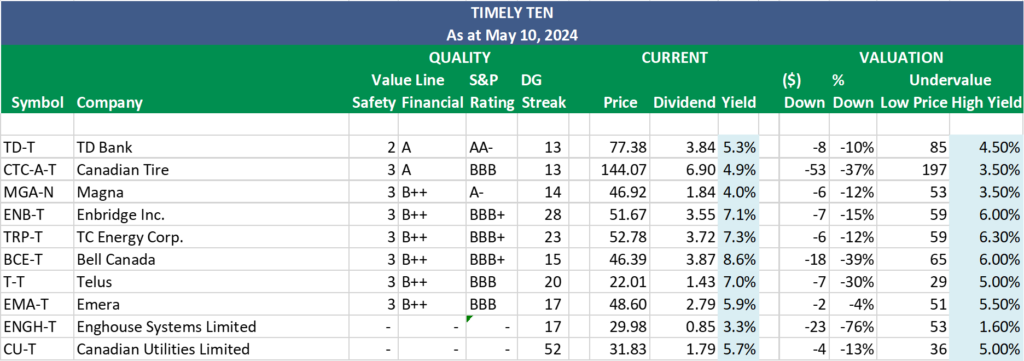
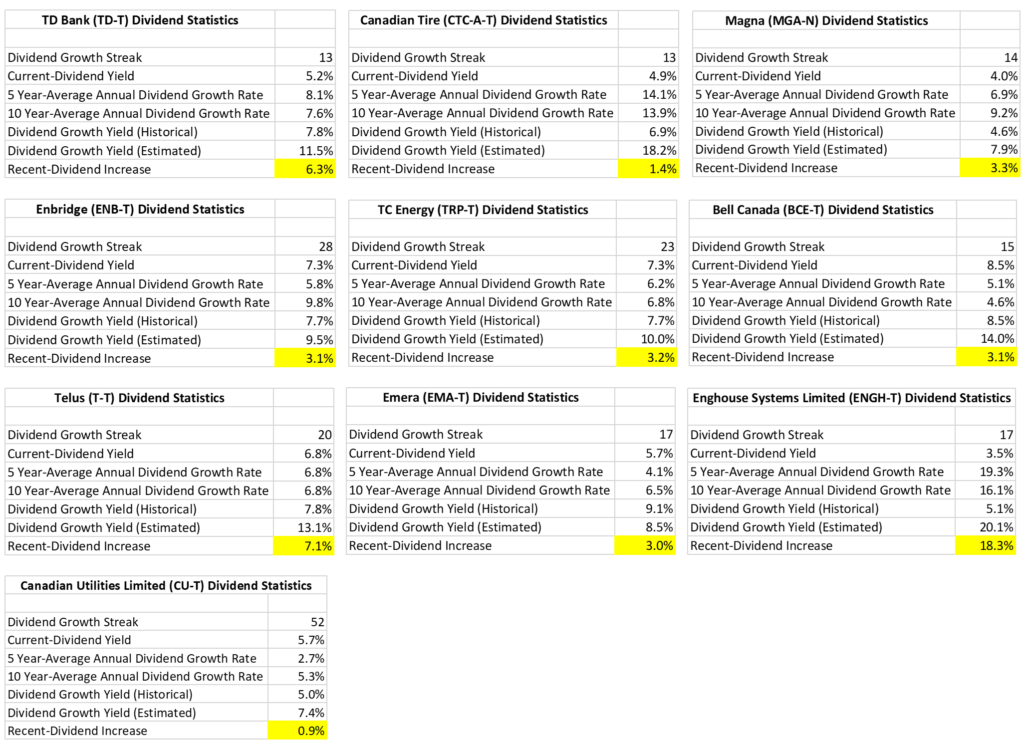
DGI Scorecard
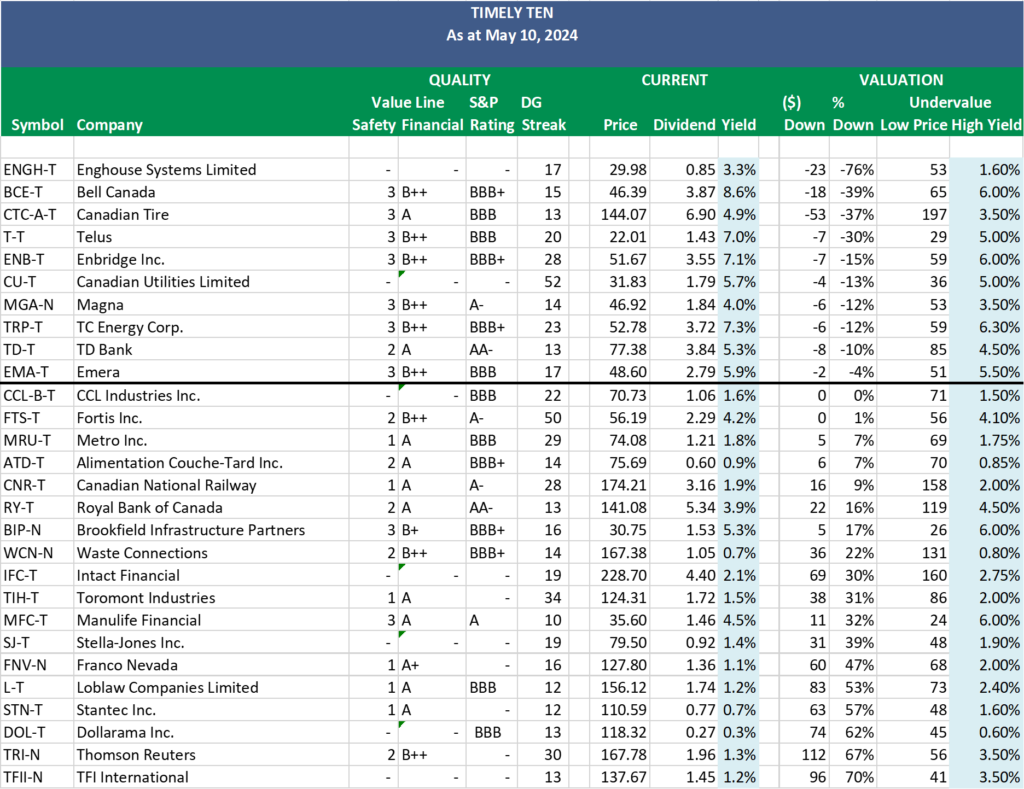
The List (2024)
The Magic Pants 2024 list includes 28 Canadian dividend growth stocks. Here are the criteria to be considered a candidate on ‘The List’:
- Dividend growth streak: 10 years or more.
- Market cap: Minimum one billion dollars.
- Diversification: Limit of five companies per sector, preferably two per industry.
- Cyclicality: Exclude REITs and pure-play energy companies due to high cyclicality.
Based on these criteria, companies are added or removed from ‘The List’ annually on January 1. Prices and dividends are updated weekly.
While ‘The List’ is not a standalone portfolio, it functions admirably as an initial guide for those seeking to broaden their investment portfolio and attain superior returns in the Canadian stock market. Our newsletter provides readers with a comprehensive insight into the implementation and advantages of our Canadian dividend growth investing strategy. This evidence-based, unbiased approach empowers DIY investors to outperform both actively managed dividend funds and passively managed indexes and dividend ETFs over longer-term horizons.
For those interested in something more, please upgrade to a paid subscriber; you get the enhanced weekly newsletter, access to premium content, full privileges on the new Substack website magicpants.substack.com and DGI alerts whenever we make stock transactions in our model portfolio.
Performance of ‘The List’
Last week, dividend growth of ‘The List’ stayed the same and has increased by +8.6% YTD (income).
Last week, ‘The List’ ‘s price return was down, with a +5.1% YTD (capital).
Even though prices may fluctuate, the dependable growth in our income does not. Stay the course. You will be happy you did.
Last week’s best performers on ‘The List’ were Alimentation Couche-Tard Inc. (ATD-T), up +6.37%; Thomson Reuters (TRI-N), up +2.79%; and Stantec Inc. (STN-T), up +2.74%.
Canadian Tire (CTC-A-T) was the worst performer last week, down -5.15%.
| SYMBOL | COMPANY | YLD | PRICE | YTD % | DIV | YTD % | STREAK |
|---|---|---|---|---|---|---|---|
| ATD-T | Alimentation Couche-Tard Inc. | 0.9% | $80.21 | 4.5% | $0.70 | 17.4% | 14 |
| BCE-T | Bell Canada | 8.7% | $45.89 | -15.3% | $3.99 | 3.1% | 15 |
| BIP-N | Brookfield Infrastructure Partners | 5.4% | $30.10 | -1.9% | $1.62 | 5.9% | 16 |
| CCL-B-T | CCL Industries Inc. | 1.6% | $72.01 | 24.5% | $1.16 | 9.4% | 22 |
| CNR-T | Canadian National Railway | 1.9% | $173.35 | 3.9% | $3.38 | 7.0% | 28 |
| CTC-A-T | Canadian Tire | 5.1% | $136.75 | -1.3% | $7.00 | 1.4% | 13 |
| CU-T | Canadian Utilities Limited | 5.7% | $31.57 | -1.7% | $1.81 | 0.9% | 52 |
| DOL-T | Dollarama Inc. | 0.3% | $124.23 | 30.7% | $0.35 | 29.5% | 13 |
| EMA-T | Emera | 5.9% | $48.87 | -3.8% | $2.87 | 3.0% | 17 |
| ENB-T | Enbridge Inc. | 7.4% | $49.53 | 2.3% | $3.66 | 3.1% | 28 |
| ENGH-T | Enghouse Systems Limited | 3.5% | $28.80 | -15.2% | $1.00 | 18.3% | 17 |
| FNV-N | Franco Nevada | 1.2% | $122.01 | 10.8% | $1.44 | 5.9% | 16 |
| FTS-T | Fortis Inc. | 4.3% | $54.53 | -0.6% | $2.36 | 3.3% | 50 |
| IFC-T | Intact Financial | 2.1% | $228.99 | 12.6% | $4.84 | 10.0% | 19 |
| L-T | Loblaw Companies Limited | 1.2% | $156.66 | 21.9% | $1.92 | 10.0% | 12 |
| MFC-T | Manulife Financial | 4.4% | $36.31 | 25.7% | $1.60 | 9.6% | 10 |
| MGA-N | Magna | 4.2% | $45.35 | -18.3% | $1.90 | 3.3% | 14 |
| MRU-T | Metro Inc. | 1.8% | $74.56 | 8.8% | $1.34 | 10.7% | 29 |
| RY-T | Royal Bank of Canada | 3.8% | $143.92 | 8.2% | $5.52 | 3.4% | 13 |
| SJ-T | Stella-Jones Inc. | 1.3% | $85.11 | 11.1% | $1.12 | 21.7% | 19 |
| STN-T | Stantec Inc. | 0.7% | $111.53 | 6.6% | $0.83 | 7.8% | 12 |
| T-T | Telus | 6.9% | $22.22 | -6.3% | $1.53 | 7.1% | 20 |
| TD-T | TD Bank | 5.3% | $77.28 | -8.7% | $4.08 | 6.3% | 13 |
| TFII-N | TFI International | 1.2% | $133.48 | 1.7% | $1.60 | 10.3% | 13 |
| TIH-T | Toromont Industries | 1.6% | $121.66 | 7.8% | $1.92 | 11.6% | 34 |
| TRI-N | Thomson Reuters | 1.2% | $175.79 | 22.6% | $2.16 | 10.2% | 30 |
| TRP-T | TC Energy Corp. | 7.3% | $52.43 | 0.2% | $3.84 | 3.2% | 23 |
| WCN-N | Waste Connections | 0.7% | $165.47 | 11.7% | $1.14 | 8.6% | 14 |
| Averages | 3.4% | 5.1% | 8.6% | 21 |
Note: Stocks ending in “-N” declare earnings and dividends in US dollars. To achieve currency consistency between dividends and share price for these stocks, we have shown dividends in US dollars and share price in US dollars (these stocks are listed on a US exchange). The dividends for their Canadian counterparts (-T) would be converted into CDN dollars and would fluctuate with the exchange rate.
Check us out on magicpants.substack.com for more info in this week’s issue….