“You have a pair of pants. In the left pocket, you have $100. You take $1 out of the left pocket and put in the right pocket. You now have $101. There is no diminution of dollars in your left pocket. That is one magic pair of pants.”

MP Market Review – August 26, 2022

Last updated by BM on August 29, 2022

Summary

  • This article is part of our weekly series (MP Market Review) highlighting the performance and activity from the previous week related to the financial markets and Canadian dividend growth companies we follow on ‘The List’.
  • Last week, ‘The List’ was down slightly with a minus -0.2% YTD price return (capital). Dividend growth of ‘The List’ remains at +10.2% YTD, demonstrating the rise in income over the last year.
  • Last week, there were no dividend increases from companies on ‘The List’.
  • Last week, there were two earnings reports from companies on ‘The List’.
  • One company on ‘The List’ is due to report earnings this week.
  • Are you looking to build an income portfolio of your own? When you become a premium subscriber, you get exclusive access to the MP Wealth-Builder Model Portfolio (CDN) and subscriber-only content. Start building real wealth today! Learn More

“The evidence is clear. If you like the idea of lower volatility, shallow losses in bear markets and higher long-term returns, then it would be prudent to increase your allocation to high-quality dividend-paying stocks.”

Noah Solomon, Financial Post article

Stocks the undisputed champion for scoring long-term returns (Financial Post)

The author compares a wide range of historical returns on several types of investments. He cautions investors not to invest in a stock-only portfolio unless they meet three criteria.

“The 100-per-cent stock portfolio is a double-edged sword. If you can 1) stick with it through stomach-churning bear market losses, 2) have a (very) long-term horizon, and 3) don’t need to sell assets for any reason, then strapping yourself into the roller coaster of a 100-per-cent stock portfolio may indeed be the optimal solution. Conversely, it would be difficult to identify a worse alternative for those who do not meet these criteria.”

Our dividend growth strategy seems well aligned with his criteria.

  1. We only buy quality, so bear markets don’t bother us as we know our companies will still be there and be profitable coming out of downturns.
  2. Our time horizon is very long (ten years and more).
  3. We don’t need to sell to generate income and pay bills. We have growing dividends.

My favourite part of the article, though, is this graphic.

Another quote we like from the article is this one:

“With respect to the emotional fortitude required to stand pat through bear markets, there is considerable evidence that many investors are simply incapable of doing this.”

A time-tested dividend growth strategy focused on income and predictable capital returns over the long term certainly helps us with our ‘emotional fortitude’.

If a DGI strategy interests you, please subscribe to our Magic Pants DGI Premium Membership, and you can learn how to build a robust dividend growth portfolio of your own.

Performance of ‘The List’

Last week, ‘The List’ was down slightly with a minus -0.2% YTD price return (capital). Dividend growth of ‘The List’ remains at +10.2% YTD, demonstrating the rise in income over the last year.

The best performers last week on ‘The List’ were TFI International (TFII-N), up +5.19%; TC Energy Corp. (TRP-T), up +2.32%; and Brookfield Infrastructure Partners (BIP-N), up +1.32%.

Magna (MGA-N) was the worst performer last week, down -5.12%.

Recent News

Rule of 20 says market bottom much lower (Globe & Mail)

“The investing rule of 20 states that when a new U.S. bull market starts, the trailing price to earnings (PE) ratio of the S&P 500 added to the inflation rate will result in a number less than 20. Unfortunately, right now the trailing PE ratio is 20.2 and the inflation rate is 8.5.”

Following this rule, inflation would need to go to zero, the S&P 500 would have to fall 40 percent more, or earnings would have to be reported 50 percent above expectations. All three scenarios look improbable in the short term.

There is also mention of CAPE being abnormally high, one of the valuation metrics we use to arrive at a sensible price for our quality dividend growers.

The bear market rally is unravelling. Here’s why it may be two years until stocks truly bottom. (Globe & Mail)

A few months ago, since the markets in the United States entered a bear market, we have been commenting on ‘bear market bounces,’ and the data from past bear markets have backed us up. This article looks at the data and arrives at a similar conclusion. The bear market is likely to continue for at least a year. Based on the behaviour of the market last Friday and particularly the comments from Federal Reserve Chair Jerome Powell, we are in for some more pain in the short term.

There was some excellent advice later on in the article.

“Play the long game by being patient and nimble – since intermittent rallies will come and go – and focus mostly on capital preservation.”

Purchasing individual, quality, dividend growers at sensible prices helps us preserve our capital.

One company on ‘The List’ is due to report earnings this week. ATD-T is another of the handful of companies on ‘The List’ that follows an off-cycle reporting schedule.

Alimentation Couche-Tard Inc. (ATD-T) will release its first-quarter 2023 results on Wednesday, August 31, 2022, before markets open.

Dividend Increases

Last week, there were no dividend increases from companies on ‘The List’.

Earnings Releases

Royal Bank (RY-T) and TD Bank (TD-T) follow an off-cycle reporting schedule. Their year ends on October 31 each year. Last week, both companies reported their Q3 Fiscal 2022 earnings.


Royal Bank (RY-T)

Highlights:

Outlook:

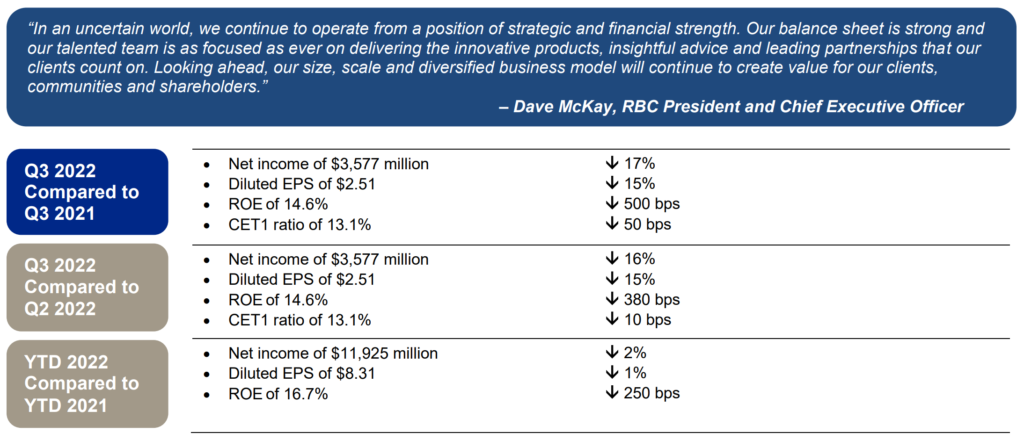
“Despite the complicated macroeconomic backdrop, we are operating from a position of strength across our capital, liquidity and allowance coverage ratios. I am confident our competitive advantages will drive premium growth going forward. Our premium return on equity was a source of strong internal capital generation and double-digit growth in book value per share. Our priorities in deploying our capital have not changed. We remain focused on building on our momentum and driving accretive, organic growth. Which I will speak to a little later. As part of our commitment to delivering long-term value for our shareholders, we bought back over 10 million shares while paying $1.8 billion of dividends this quarter. We remain well-positioned to execute on key strategic priorities via acquisitions should they meet our strategic and financial requirements. And we are looking forward to working with our new colleagues following the anticipated close of Brewin Dolphin acquisition later this year. Finally, we are comfortable with operating at a higher capital ratio at this point in the cycle. We believe this is the prudent thing to do given the uncertain environment. Our liquidity coverage ratio provides a $66 billion buffer over the regulatory minimum. And we expect to continue to fund the majority of our organic loan growth in our personal and commercial banking businesses through our large client deposit base.”

See the full Earnings Release here


Toronto Dominion Bank (TD-T)

 “Continued business momentum, increased customer activity and the benefits of our deposit rich franchise contributed to TD’s strong performance in the third quarter,” said Bharat Masrani, Group President and CEO, TD Bank Group. “Investments in talent and innovation, combined with our focus on prudent risk and financial management, strengthened our business and extended our competitive advantage.”

Highlights:

THIRD QUARTER HIGHLIGHTS

  • Reported diluted earnings per share were $1.75, compared with $1.92.
  • Adjusted diluted earnings per share were $2.09, compared with $1.96.
  • Reported net income was $3,214 million, compared with $3,545 million.
  • Adjusted net income was $3,813 million, compared with $3,628 million.

YEAR-TO-DATE FINANCIAL HIGHLIGHTS

  • Reported diluted earnings per share were $5.85, compared with $5.68.
  • Adjusted diluted earnings per share were $6.18, compared with $5.83.
  • Reported net income was $10,758 million, compared with $10,517 million.
  • Adjusted net income was $11,360 million, compared with $10,783 million.

Outlook:

“We enter the final quarter of fiscal 2022 with growing businesses, a powerful brand and a proven ability to drive consistent execution across the Bank,” added Masrani. “In a complex macroeconomic environment, we are well-positioned to continue investing in our business and create long-term value for our shareholders.” 

See the full Earnings Release here


Below is a snapshot of ‘The List’ from last Friday’s close. For a sortable version of ‘The List’, please click on The List menu item.

‘The List’ is not meant to be a template for investors to copy exactly. Instead, its purpose is to provide investment ideas and a real-time illustration of dividend growth investing in action. It is not a ‘Buy List’ nor does it reflect the composition or returns of our Magic Pants Wealth-Builder (CDN) Portfolio. It is only a starting point for our analysis and discussion.


The List (2022)
Last updated by BM on August 26, 2022

*Note: The following graph is wide, you can scroll to the right on your device to see more of the data.

SYMBOL COMPANY YLD PRICE YTD % DIV YTD % STREAK
AQN-N Algonquin Power & Utilities 5.0% $14.15 -1.4% $0.70 5.4% 11
ATD-T Alimentation Couche-Tard Inc. 0.8% $56.97 9.3% $0.44 18.1% 12
BCE-T Bell Canada 5.6% $64.65 -1.9% $3.64 4.0% 13
BIP-N Brookfield Infrastructure Partners 3.3% $43.01 5.6% $1.44 5.9% 14
CCL-B-T CCL Industries 1.5% $64.27 -5.2% $0.96 14.3% 20
CNR-T Canadian National Railway 1.8% $160.99 3.9% $2.93 19.1% 26
CTC-A-T Canadian Tire 3.6% $161.24 -12.0% $5.85 24.5% 11
CU-T Canadian Utilities Limited 4.3% $41.23 12.6% $1.78 1.0% 50
DOL-T Dollarama Inc. 0.3% $80.48 26.9% $0.22 9.2% 11
EMA-T Emera 4.3% $61.35 -2.0% $2.65 2.9% 15
ENB-T Enbridge Inc. 6.1% $56.80 14.7% $3.44 3.0% 26
ENGH-T Enghouse Systems Limited 2.2% $32.33 -29.5% $0.72 16.3% 15
FNV-N Franco Nevada 1.0% $126.96 -6.7% $1.28 10.3% 14
FTS-T Fortis 3.6% $58.83 -2.7% $2.14 2.9% 48
IFC-T Intact Financial 2.1% $192.44 17.5% $4.00 17.6% 17
L-T Loblaws 1.3% $117.31 14.2% $1.54 12.4% 10
MGA-N Magna 3.1% $58.98 -27.7% $1.80 4.7% 12
MRU-T Metro 1.6% $70.06 4.5% $1.10 12.2% 27
RY-T Royal Bank of Canada 4.0% $124.97 -8.7% $4.96 14.8% 11
SJ-T Stella-Jones Inc. 1.9% $41.08 1.0% $0.80 11.1% 17
STN-T Stantec Inc. 1.1% $63.22 -9.9% $0.71 6.8% 10
TD-T TD Bank 4.1% $86.87 -12.6% $3.56 12.7% 11
TFII-N TFI International 1.0% $107.33 -3.1% $1.08 12.5% 11
TIH-T Toromont Industries 1.4% $105.49 -7.2% $1.52 15.2% 32
TRP-T TC Energy Corp. 5.4% $65.74 10.1% $3.57 4.4% 21
T-T Telus 4.4% $30.10 1.1% $1.33 6.2% 18
WCN-N Waste Connections 0.7% $139.64 4.2% $0.92 8.9% 12
Averages 2.8% -0.2% 10.2% 18

MP Market Review – August 19, 2022

Last updated by BM on August 22, 2022

Summary

  • This article is part of our weekly series (MP Market Review) highlighting the performance and activity from the previous week related to the financial markets and Canadian dividend growth companies we follow on ‘The List’.
  • Last week, ‘The List’ was up again with a +1.2% YTD price return (capital). Dividend growth of ‘The List’ remains at +10.2% YTD, demonstrating the rise in income over the last year.
  • Last week, there were no dividend increases from companies on ‘The List’.
  • Last week, there were no earnings reports from companies on ‘The List’.
  • Two companies on ‘The List’ are due to report Q3 earnings this week.
  • Are you looking for a portfolio of ideas like these? Magic Pants DGI Premium Membership Subscribers get exclusive access to the MP Wealth-Builder Model Portfolio (CDN). Learn More

 “Investing shouldn’t feel like going into a casino as a customer. It should feel like owning the casino.”

-Rida Morwa, Seeking Alpha Contributor

Second quarter 2022 earnings are now posted. You can see the Analyst estimates and actual results in a table at the bottom of ‘The List’ menu item. During earnings season, we update all twenty-seven companies on ‘The List’. We also include the earnings highlights and updated guidance in our Weekly Reviews during the earnings reporting season to help readers get to know the companies they invest in a little bit better.

This recent earnings season coincided with an upbeat stock market here in Canada. For the most part, earnings were pretty good, especially when compared to estimates. Twenty of the twenty-seven companies we follow beat estimates (74%). There were a few cautionary warnings in some of the reports, so we are not yet in the camp that thinks the bull market is back.

Benjamin Graham once remarked that earnings are the principal factor driving stock prices. We also like to see a favourable earnings report before investing in a company.

Reviewing quarterly earnings reports is part of our due diligence process. Much like the casino, which does its due diligence on every game it offers, we, too, are taking a calculated risk that over time the odds will be substantially in our favour if we stick to our process and do our research properly.

An investment strategy that is time-tested, focused on income, and predictable over the long term allows everyday investors to take control of their future and enjoy building real wealth without the stress of constant trading and unpredictable price fluctuations.

If this strategy interests you, please subscribe to our Magic Pants DGI Premium Membership, and you can build a dividend growth portfolio alongside ours.

Performance of ‘The List’

Last week, ‘The List’ was up with a +1.2% YTD price return (capital). Dividend growth of ‘The List’ remains at +10.2% YTD, demonstrating the rise in income over the last year.

The best performers last week on ‘The List’ were Loblaws (L-T), up +4.75%; Canadian Tire (CTC-A-T), up +3.78%; and Metro (MRU-T), up +2.45%.

TFI International (TFII-N) was the worst performer last week, down -5.14%.

Recent News

Tuesday’s TSX breakouts: This company has raised its dividend for 18 consecutive years (Globe & Mail)

This is a good article on one of the stocks in ‘The List’, (SJ-T). Lots of analysis and price targets from various analysts.

Stella-Jones (SJ-T) has rebounded nicely from its 2022 lows. We will let you decide after reading the article if you think there is more upside in the short run from today’s price.

P.S. Our consecutive dividend growth streak only shows 17 consecutive years as we only update ‘The List’ once at the end of each fiscal year.

The case for Canada: A BlackRock senior strategist on energy, banks, bonds and why our market rules in 2022 (Globe & Mail)

“The overarching theme is that the period of steady growth, declining inflation and lengthening business cycles is over. We’re bracing for volatility. We think that central banks are going to have to veer between focusing on the politics of inflation and focusing on the economic consequences of controlling inflation. And that means the bull market in stocks and bonds that prevailed for most of the past four decades is unlikely to repeat itself.”

The author likes Canada because it has a lot of commodities and energy names. We like this quote from the article.

“Within stocks, the focus is on earnings quality and resilience.”

Two companies on ‘The List’ are due to report Q3 earnings this week.  

Both Royal Bank (RY-T) and TD Bank (TD-T) follow an off-cycle reporting schedule. Their fiscal year ends on October 31 each year. This means that their fiscal Q3 earnings are the first of ‘The List’ to report each quarter.

Royal Bank (RY-T) will release its third-quarter 2022 results on Wednesday, August 24, 2022, before markets open.

TD Bank TD-T) will release its third-quarter 2022 results on Thursday, August 25, 2022, before markets open.

Dividend Increases

Last week, there were no dividend increases from companies on ‘The List’.

Earnings Releases

Last week, there were no earnings reports from companies on ‘The List’.

Below is a snapshot of ‘The List’ from last Friday’s close. For a sortable version of ‘The List’, please click on The List menu item.

‘The List’ is not meant to be a template for investors to copy exactly. Instead, its purpose is to provide investment ideas and a real-time illustration of dividend growth investing in action. It is not a ‘Buy List’ nor does it reflect the composition or returns of our Magic Pants Wealth-Builder (CDN) Portfolio. It is only a starting point for our analysis and discussion.

The List (2022)
Last updated by BM on August 19, 2022

*Note: The following graph is wide, you can scroll to the right on your device to see more of the data.

SYMBOL COMPANY YLD PRICE YTD % DIV YTD % STREAK
AQN-N Algonquin Power & Utilities 4.9% $14.27 -0.6% $0.70 5.4% 11
ATD-T Alimentation Couche-Tard Inc. 0.7% $59.06 13.4% $0.44 18.1% 12
BCE-T Bell Canada 5.5% $66.04 0.2% $3.64 4.0% 13
BIP-N Brookfield Infrastructure Partners 3.4% $42.45 4.2% $1.44 5.9% 14
CCL-B-T CCL Industries 1.5% $65.06 -4.0% $0.96 14.3% 20
CNR-T Canadian National Railway 1.8% $164.73 6.4% $2.93 19.1% 26
CTC-A-T Canadian Tire 3.5% $168.94 -7.8% $5.85 24.5% 11
CU-T Canadian Utilities Limited 4.3% $41.18 12.5% $1.78 1.0% 50
DOL-T Dollarama Inc. 0.3% $80.35 26.7% $0.22 9.2% 11
EMA-T Emera 4.2% $62.83 0.4% $2.65 2.9% 15
ENB-T Enbridge Inc. 6.1% $56.25 13.5% $3.44 3.0% 26
ENGH-T Enghouse Systems Limited 2.2% $32.81 -28.5% $0.72 16.3% 15
FNV-N Franco Nevada 1.0% $128.52 -5.6% $1.28 10.3% 14
FTS-T Fortis 3.5% $60.32 -0.3% $2.14 2.9% 48
IFC-T Intact Financial 2.0% $195.54 19.4% $4.00 17.6% 17
L-T Loblaws 1.2% $123.59 20.3% $1.54 12.4% 10
MGA-N Magna 2.9% $62.16 -23.8% $1.80 4.7% 12
MRU-T Metro 1.5% $72.37 8.0% $1.10 12.2% 27
RY-T Royal Bank of Canada 3.8% $129.05 -5.7% $4.96 14.8% 11
SJ-T Stella-Jones Inc. 2.0% $41.00 0.8% $0.80 11.1% 17
STN-T Stantec Inc. 1.1% $65.77 -6.3% $0.71 6.8% 10
TD-T TD Bank 4.1% $87.45 -12.0% $3.56 12.7% 11
TFII-N TFI International 1.1% $102.03 -7.9% $1.08 12.5% 11
TIH-T Toromont Industries 1.4% $106.43 -6.4% $1.52 15.2% 32
TRP-T TC Energy Corp. 5.6% $64.25 7.6% $3.57 4.4% 21
T-T Telus 4.3% $30.74 3.3% $1.33 6.2% 18
WCN-N Waste Connections 0.6% $141.87 5.8% $0.92 8.9% 12
Averages 2.8% 1.2% 10.2% 18

MP Market Review – August 12, 2022

Last updated by BM on August 15, 2022

Summary

  • This article is part of our weekly series (MP Market Review) highlighting the performance and activity from the previous week related to the financial markets and Canadian dividend growth companies we follow on ‘The List’.
  • Last week, ‘The List’ was up with a +0.6% YTD price return (capital). Dividend growth of ‘The List’ remains at +10.2% YTD, demonstrating the rise in income over the last year.
  • Last week, there were no dividend increases from companies on ‘The List’.
  • Last week, there were eight earnings reports from companies on ‘The List’.
  • No companies on ‘The List’ are due to report earnings this week.
  • Are you looking for a portfolio of ideas like these? Magic Pants DGI Premium Membership Subscribers get exclusive access to the MP Wealth-Builder Model Portfolio (CDN). Learn More

 “Our approach to saving is all wrong: We need to think about monthly income, not net worth.”

– Robert C. Merton, HBR (2014)

I was speaking with a couple of our young subscribers recently who wanted a quick way to calculate how much capital they would need to invest today to generate a certain amount of income in the future.

Accurately, predicting future income is one of the great things about the dividend growth strategy as it is something that has proven very reliable over the years. Let us show you how.

First, we need to calculate our estimated yield at some point in the future on the capital we will be investing today. We call this future yield our Growth Yield.

Estimating Growth Yield can be calculated by taking the current (or starting) dividend yield and multiplying it by the average annual forward dividend growth rate to the power of the period in question (5 for the next five years, 10 for the next ten years). We will use ten years for our demonstration.

We assume a starting yield of 3% today and dividend growth of 7% each year over the next ten years. These are the same conservative assumptions we make in our Model Portfolio (CDN) Business Plan.

Current Yield * Average Annual Forward Dividend Growth Rate ^ Period = Estimated Growth Yield

3.0 * 1.07 ^ 10 = 5.9%

Next, we need to know how much income we will require a decade from now. Let’s assume $70,000 annually. By taking the desired income and dividing it by our new estimated Growth Yield we get our answer.

$70,000 / 5.9% = $1,186,440

The subscribers would need to invest ~ one million two hundred thousand dollars today in a portfolio of individual dividend growth stocks with an initial average yield of 3% and grow their dividends on average by 7% per year. They should have ~ $70,000 in yearly dividends from their original investment in only ten years.

By changing the formula’s inputs (starting yield, dividend growth and time), you can arrive at your desired income and initial capital requirements.

As a bonus, their capital should also have increased (~10% annually), and their income will continue to grow to protect them from inflation. This exercise does not include any new contributions (cash or reinvested dividends) to their original capital over the decade. The compounding of reinvested dividends is a powerful force for younger investors who may not need the income in the short term and will accelerate the achievement of their investing goals.

An investment strategy that is time-tested, focused on income, and predictable over the long term allows everyday investors to take control of their future and enjoy building real wealth without the stress of constant trading and unpredictable price fluctuations.

If this strategy interests you, please subscribe to our Magic Pants DGI Premium Membership, and you can build a dividend growth portfolio alongside ours.

Performance of ‘The List’

Last week, ‘The List’ was up with a +0.6% YTD price return (capital). Dividend growth of ‘The List’ remains at +10.2% YTD, demonstrating the rise in income over the last year.

The best performers last week on ‘The List’ were Stella-Jones Inc. (SJ-T), up +7.33%; Magna (MGA-N), up +6.59%; and Stantec Inc. (STN-T), up +4.41%.

Canadian Tire (CTC-A-T) was the worst performer last week, down -3.98%.

Recent News

Has Inflation Peaked? Sam and Robert Kovacs (Seeking Alpha Contributors)

One of the narratives sparking the upturn in the stock markets recently is that inflation has peaked and that interest rate hikes may not be as aggressive going forward.

In this article, the authors agree that one component of inflation (gas prices) has indeed reversed course but this may only be temporary. Food and shelter costs are still rising and gas prices could reverse course and head even higher.

The authors advise caution and warn not to be too quick to jump back into the market full throttle just yet.

#Quad4 (Bulls, Beware)

Another service we subscribe to is Hedgeye. Hedgeye proposes an active investing strategy based on four quads. The one we are in now is Quad4 (Growth and Inflation both slowing). Here is what they have to say about our current environment.

“The facts belie that rosy outlook. By our estimation, inflation will remain sticky (even as inflation slows from multi-decade highs). Combine this with the U.S. economy on the precipice of a major multi-quarter slowdown and we have a recipe for serious hardship for most Americans. (For investors, this outlook posits #Quad4 market risk according to our Growth, Inflation, Policy model.)

Financial pressure is already hurting cash-strapped U.S. consumers. Here’s an alarming stat. According to the U.S. Census Bureau, about 15% of U.S. renters (representing 8.4 million Americans) are late on making their monthly rent payments (for the period June 1 to June 13). Millions of these struggling Americans will see their leases run off in the coming months.

Getting back to the Fed.

With sticky inflation, we think the Fed will need to raise rates into an impending #Quad4 slowdown which will exacerbate the existing squeeze on American consumers. In this environment, job cuts broaden as U.S. corporates feel the bite of economic malaise. As we recently detailed in our 154-slide Mid-Quarter Update presentation, we’re already seeing many of these dynamics play out.

In other words, bulls beware.”

No companies on ‘The List’ are due to report earnings this week.

Dividend Increases

Last week, there were no dividend increases from companies on ‘The List’.

Earnings Releases

Last week, eight companies on ‘The List’ reported their Q2 Fiscal 2022 earnings. We will begin with Metro’s latest earnings report.

Metro (MRU-T)

Metro, follows an off-cycle reporting schedule. Its fiscal year ends at the end of September. This means that its fiscal Q3 is reported in line with the Q2 Fiscal 2022 earnings of ‘The List’.

“We are pleased with the performance of our food and pharmacy businesses in the third quarter, which was achieved in a challenging operating environment with increasing inflationary pressures as well as ongoing labor shortages that are impacting the supply chain and our operations. I want to thank our teams who strive to deliver the best value possible to customers in these inflationary times with our multiple formats, effective promotional strategies and strong private label offering. Finally, we are on track with our supply chain modernization program as the transition to our fully automated frozen food distribution center in Toronto is now complete and the ramp-up is progressing well”, declared Eric La Flèche, President and Chief Executive Officer.

Highlights:

  • Sales of $5,865.5 million, up 2.5%
  • Food same-store sales up 1.1%
  • Pharmacy same-store sales up 7.2%
  • Net earnings of $275.0 million, up 9.0% and adjusted net earnings(1) of $283.8 million, up 8.7%
  • Fully diluted net earnings per share of $1.14, up 10.7%, and adjusted fully diluted net earnings per share of $1.18, up 11.3%

Outlook:

“We continue to face higher than normal inflationary pressures and labor shortages, and it is difficult to predict how long this situation will last. If prolonged, this environment could put pressure on margins. In the short term, we expect same-store food sales to grow at a higher rate than in recent quarters as we are now cycling periods last year without significant pandemic restrictions. On the pharmacy side, we expect growth in prescriptions to moderate versus year-to-date levels given the high number of visits to physicians in the fourth quarter last year. We also expect front of store revenues to remain strong, namely driven by over-the-counter product sales.”

See the full Earnings Release here

Emera (EMA-T)

“Our portfolio of high-quality regulated assets continues to deliver solid performance and predictable earnings growth, driven by strong results from our Florida utilities, “ said Scott Balfour, President and CEO of Emera Inc. “Our strategy continues to deliver for both customers and shareholders, with our focus on a clean energy transition that ensures grid reliability and minimizes the cost impacts to customers.”

Highlights:

  • Quarterly adjusted EPS increased $0.05 or 9% to $0.59 compared to $0.54 in Q2 2021. Quarterly reported net loss per common share increased $0.18 to $(0.25) in Q2 2022 compared to a net loss per common share of $(0.07) in Q2 2021 due to higher mark-to-market (“MTM”) losses.
  • Year-to-date, adjusted EPS increased $0.02 or 1% to $1.51 compared to $1.49 in Q2 2021. Year-to-date reported EPS increased by $0.11 to $1.12 from $1.01 in 2021 due to lower MTM losses.
  • Contributions from regulated utilities increased adjusted EPS 18% for the quarter and 12% year-to-date primarily driven by new rates and favourable weather at Tampa Electric and continued growth at both Tampa Electric and People’s Gas (“PGS”) year-to-date. These increases were partially offset by higher corporate costs, lower contributions from Emera Energy and a higher share count.
  • On track to fully execute on 2022 capital plan with almost $1.1B of capital investment in cleaner and reliable energy in the first half of 2022.

Capital Program Update:

  • On track to deliver $2.9 billion in capital investment in 2022, a 19% increase over the $2.4 billion capital investment in 2021
  • Emera’s capital program continues to drive forecasted rate base growth of approximately 7% to 8% through 2024
  • 2023‐2025 capital plan will be rolled out in Q3 2022

See the full Earnings Release here

Stella-Jones (SJ-T)

“Stella-Jones recorded solid results in the second quarter, above market performance, delivering sequentially higher margins and generating significant cash,” said Éric Vachon, President and CEO of Stella-Jones. “We are particularly pleased with the performance of our infrastructure-related businesses, which speaks highly to the wide reach of our expanded network and to our procurement and logistics capabilities to continue to meet strong demand. While inflationary pressures impacted costs of all product categories, we continued to successfully implement contractual price adjustments and generate healthy margins, underscoring the strength of our business model.”  

Highlights:

  • Sales increased to $907 million, despite the normalization of residential lumber sales
  • 10% organic growth for infrastructure-related businesses
  • EBITDA of $154 million, or a healthy margin of 17.0%
  • Net income of $94 million, or $1.51 per share
  • Strong cash flow generation of $228 million

Outlook:

Stella-Jones’ sales are primarily to critical infrastructure-related businesses. While all product categories can be impacted by short-term fluctuations, the business is mostly based on replacement and maintenance-driven requirements, which are rooted in long-term planning. Corresponding to this longer-term horizon and to better reflect the expected sales run-rate for residential lumber and reduce the impact of commodity price volatility, the Company shifted its guidance to a three-year outlook in early 2022. Below are key highlights of the 2022-2024 outlook with a more comprehensive version, including management assumptions, available in the Company’s MD&A. Management remains confident in the achievement of its three-year strategic guidance.

 Key Highlights:

  • Compound annual sales growth rate in the mid-single digit range from 2019 pre-pandemic levels to 2024;
  • EBITDA margin of approximately 15% for the 2022-2024 period;
  • Capital investment of $90 to $100 million to support the growing demand of its infrastructure-related customer base, in addition to the $50 to $60 million of annual capital expenditures;
  • Residential lumber sales expected to stabilize between 20-25% of total sales while infrastructure-related businesses expected to grow and represent 75-80% of total sales by 2024;
  • Anticipated returns to shareholders between $500 and $600 million during three-year outlook period;
  • Leverage ratio of 2.0x-2.5x between 2022-2024, but may temporarily exceed range to pursue acquisitions.

See the full Earnings Release here

Stantec (STN-T)

“We are very pleased that our operational performance continues to drive record earnings,” said Gord Johnston, President and CEO. “Our backlog has never been higher and the opportunity pipeline remains robust. Significant US Federal funding is moving forward, although it has taken longer than expected, and this will further add to future growth prospects that will accelerate in 2023.”

Highlights:

  • Stantec achieved adjusted diluted EPS of $0.83 in Q2 2022, a $0.21 per share or 33.9% increase from $0.62 in Q2 2021, reflecting strong net revenue growth, solid execution of its strategic growth initiatives, and focused project execution.
  • Net revenue increased 22.9% or $208.4 million to $1.1 billion compared to Q2 2021, driven by 9.4% organic growth and 12.4% acquisition growth. Consistent with the first quarter of this year, every one of the regional and business operating units delivered organic growth, most notably in Global and in Water and Environmental Services where organic growth was in the double-digits.
  • Project margin increased $119.4 million or 24.7% to $602.7 million as a result of net revenue growth and solid project execution. As a percentage of net revenue, Stantec delivered a 54.0% project margin, an 80 basis point increase from Q2 2021.
  • Adjusted EBITDA1 increased $40.1 million or 27.4% to $186.7 million and achieved a margin of 16.7% compared to 16.1% in the prior period, resulting from strong performance across the business.
  • Net income decreased 4.0%, or $2.5 million, to $60.7 million, and diluted EPS decreased 3.5%, or $0.02, to $0.55. Acquisition-related expenses (namely integration, depreciation and amortization, and interest expenses), coupled with a net unrealized fair value loss associated with Stantec’s equity investments held for self-insured liabilities, more than offset increased project margin and lower income tax expense.
  • Adjusted net income1 grew 33.0%, or $23.0 million, to $92.6 million, achieving 8.3% of net revenue compared to 7% in Q2 2021, and adjusted diluted EPS increased 33.9% to $0.83 from $0.62 in Q2 2021.
  • Contract backlog stands at $5.8 billion at June 30, 2022, a new record reflecting 13.0% organic growth from December 31, 2021. Like net revenue, organic backlog growth was achieved across all Stantec’s regional and business operating units. US operations led with 14.8% organic backlog growth. Global’s backlog exceeded $1 billion, a high-water mark, reflecting 13.4% organic growth. Infrastructure, Buildings, and Energy & Resources achieved double-digit organic backlog growth. Contract backlog represents approximately 14 months of work—an increase of one month from December 31, 2021.
  • Operating cash flows amounted to an outflow of $4.4 million compared to an inflow of $78.2 million in the prior period reflecting the expected disruptions from the Cardno integration, particularly the financial system migration. Cash outflow was also driven by the increased investment in net working capital to support organic revenue growth and an increase in days sales outstanding (DSO).
  • Days sales outstanding was 79 days, remaining within Stantec’s expectations, and represents an increase of 4 days from 75 days at December 31, 2021.
  • Net debt to adjusted EBITDA (on a trailing twelve-month basis) at June 30, 2022 was 2.0x, remaining within Stantec’s internal target range of 1.0x to 2.0x.
  • In Q2 2022, Stantec repurchased 625,019 common shares at a cost of $36.7 million under its normal course issuer bid.
  • On April 1, 2022, Stantec acquired Barton Willmore, the UK’s leading planning and design consultancy firm. This acquisition added approximately 300 team members across the UK providing services for both public and private clients across all development sectors, which strategically complements Stantec’s existing business in Infrastructure.

Outlook:

“The inflationary environment does not seem to be slowing the pace of project opportunities in any meaningful way,” continued Mr. Johnston. “As we engage with our clients, the imperative for tackling the challenges of aging and overloaded infrastructure, climate change, and production capacity constraints is outweighing the effects of inflation. This gives us confidence in our continued ability to meet our financial targets.”

See the full Earnings Release here

Franco-Nevada (FNV-N)

“We are proud to report record quarterly and half-year results on many financial metrics,” stated Paul Brink, CEO. “The low-risk nature of our business is most pronounced in today’s inflationary environment. Our top-line precious metal stream and royalty interests helped generate our highest margins since starting streaming. Our Energy assets performed well and are the driver behind our record revenues. We are pleased to add exposure to the construction-ready Tocantinzinho gold project and to have received good organic growth news from several of our assets during the quarter, in particular the further expansion of the Detour Lake mine. Franco-Nevada is debt-free and is growing its cash balances.”  

Highlights:

  • GEOs sold consistent year over year
  • On track to achieving guidance
  • Portfolio performing well
  • Benefit of recovery in energy prices
  • 85.5% margin in Q2 2022

Portfolio Additions:

  • Financing Package with G Mining Ventures on the Tocantinzinho Gold Project: As previously announced on July 18, 2022, we acquired, through our wholly-owned subsidiary, Franco-Nevada (Barbados) Corporation (“FNBC”), a gold stream with reference to production from the Tocantinzinho project, owned by G Mining Ventures Corp. (“G Mining Ventures”) and located in Pará State, Brazil (the “Stream”). FNBC will provide a deposit of $250 million. Additionally, through one of our wholly-owned subsidiaries, we agreed to provide G Mining Ventures with a $75.0 million secured term loan (the “Term Loan”). We also subscribed for $27.5 million of G Mining Ventures’ common shares (“G Mining Common Shares”).
  • Acquisition of Caserones Royalty in Chile: On April 14, 2022, we acquired, through a wholly-owned subsidiary, an effective 0.4582% NSR on JX Nippon Mining & Metals Group’s producing Caserones copper-molybdenum mine located in the Atacama Region of northern Chile for an aggregate purchase price of $37.4 million. Franco-Nevada is entitled to royalty payments in respect of the period commencing January 1, 2022. The last quarterly distribution attributable to Franco-Nevada was $1.2 million.

Outlook:

See the full Earnings Release here

CCL Industries (CCL-B-T)

Geoffrey T. Martin, President and Chief Executive Officer, commented, “I am pleased to report record quarterly results despite an unsettled geopolitical backdrop, China-centric Covid lockdowns, persistent inflation and supply chain challenges. The Company posted strong 10.9% organic sales growth, although significantly selling price driven to offset inflation, while adjusted basic earnings per Class B share improved 5.6% to $0.94, including $0.02 of negative impact from foreign currency translation.”  

Highlights:

  • Per Class B share: $0.94 adjusted basic earnings up 5.6%; $0.91 basic earnings up 5.8%; currency translation negative $0.02 per share
  • Sales increased 14.9% on 10.9% organic and 4.8% acquisition growth partially offset by 0.8% negative currency translation
  • CCL, Avery and Innovia posted organic sales growth of 10.9%, 13.8% and 19.5%, respectively
  • Operating income improved 5.2%, with a 15.3% operating margin down 140 bps

Outlook:

  • Final price pass through initiatives implemented to benefit core CCL Label businesses for H222, orders picture still solid
  • CCL Design outlook dependent on chip availability recovery and consumer demand holding up, recent acquisitions additive
  • Comps at CCL Secure ease significantly for H222
  • Avery volume should continue to improve, augmented by recent acquisitions
  • Checkpoint RFID growth at ALS might struggle to offset softer MAS picture in broad retail
  • Innovia sales likely to decline on lower resins at today’s purchase prices, must balance freight & energy inflation to match H221 profitability
  • China operations back to near normal but demand soft

See the full Earnings Release here

Canadian Tire (CTC-A-T)

“Our strong comparable sales growth clearly demonstrated that customer demand for CTC’s unique multi-category product assortment remained healthy in the second quarter,” said Greg Hicks, President and CEO, Canadian Tire Corporation.

Highlights:

  • Retail sales were $5,363.8 million, up 9.9%, compared to the second quarter of 2021; consolidated comparable sales (excluding Petroleum) increased 5.0%
  • Revenue increased $485.5 million to $4,404.0 million, up 12.4%; Revenue (excluding Petroleum) increased 5.9% over the same period last year
  • Consolidated income before income taxes (IBT) was $238.1 million, down 33.4% compared to the second quarter of 2021; and $284.3 million, down 22.0%, on a normalized basis
  • Normalized diluted EPS was $3.11, compared to $3.72 in the prior year. Q2 Diluted EPS was $2.43 per share, compared to $3.64 in the prior year
  • Retail Return on Invested Capital (ROIC) calculated on a trailing twelve-month basis, remained strong at 13.5% at the end of the second quarter, compared to 14.1% at the end of the second quarter of 2021

Outlook:

“Our results reflect our continued ability to effectively navigate a challenging and dynamic environment. Our retail team’s outstanding focus on inventory and margin management have enabled us to continue to execute well and stay focused on the delivery of our Better Connected strategy,” continued Hicks. “Also, receivables and new account acquisitions at Canadian Tire Bank remained strong, in line with our expectations to drive long-term growth,” said Hicks

See the full Earnings Release here

Algonquin Power and Utilities (AQN-N)

“We are pleased to report solid second quarter results and continued growth across our regulated and renewables businesses,” said Arun Banskota, President and Chief Executive Officer of AQN. “We remain committed to the execution of our capital plan, which we believe supports growth in earnings and cash flows and delivery of long-term value to our shareholders.”

Highlights:

  • Revenue of $624.3 million, an increase of 18% compared to the second quarter of 2021
  • Adjusted EBITDA1 of $289.3 million, an increase of 18% compared to the second quarter of 2021;
  • Adjusted Net Earnings1 of $109.7 million, an increase of 19.6% compared to the second quarter of 2021; and
  • Adjusted Net Earnings1 per share of $0.16, an increase of 7% compared to the second quarter of 2021.

Corporate Highlights

  • Pending Acquisition of Kentucky Power Company and AEP Kentucky Transmission Company, Inc. – On May 4, 2022, the Kentucky Public Service Commission (“KPSC”) issued an order, including an approval of the pending acquisition of Kentucky Power Company and AEP Kentucky Transmission Company, Inc. (the “Kentucky Power Transaction”) by Liberty Utilities Co. (“Liberty Utilities”), an indirect, wholly-owned subsidiary of AQN, subject to certain conditions set forth in the order, including those agreed to by Liberty Utilities in the course of the docket. On May 3, 2022, the KPSC issued an order that required certain changes to the proposed operating and ownership agreements (collectively, the “Mitchell Agreements”) relating to the Mitchell coal generating facility (in which Kentucky Power owns a 50% interest, representing 780 MW). On July 1, 2022, the Public Service Commission of West Virginia (“WVPSC”) issued an order on the Mitchell Agreements that is inconsistent with the KPSC’s order on the Mitchell Agreements. The closing of the Kentucky Power Transaction is subject to the satisfaction of certain conditions precedent, which include those relating to the approval of the Mitchell Agreements by the KPSC, WVPSC and U.S. Federal Energy Regulatory Commission. Liberty Utilities and AEP are in discussions to reach a resolution regarding the conditions precedent in respect of the Mitchell Agreements (the “Mitchell Agreements Condition”), which if successful, could allow the Kentucky Power Transaction to close in the second half of 2022.
  • Completion of the Blue Hill Wind Facility – On April 14, 2022, the Renewable Energy Group achieved commercial operations (“COD”) at its 175 MW Blue Hill Wind Facility, located in southwest Saskatchewan. The energy generated from the facility is being sold through a long-term power purchase agreement with SaskPower. Bringing low-cost renewable generation capacity to communities is one of the ways the Company is delivering on its commitment to sustainability.
  • Completion of Sandhill Renewable Natural Gas Acquisition – On August 5, 2022, the Renewable Energy Group completed its acquisition of Sandhill Advanced Biofuels, LLC (“Sandhill”). Sandhill is a developer of renewable natural gas (“RNG”) anaerobic digestion projects located on dairy farms with a portfolio of four projects in the state of Wisconsin. Two of the projects recently achieved COD, while the other two projects are in late-stage development. Once fully constructed, the portfolio is expected to produce RNG at a rate of approximately 500 million British thermal units (“MMBTUs”) per day. The acquisition represents the Company’s first investment in the non-regulated RNG space.
  • Moody’s assigns Baa2 rating – On August 5, 2022, Moody’s Investors Service (“Moody’s”) assigned an inaugural Baa2 long term issuer rating to Liberty Utilities with a stable outlook. Liberty Utilities is also rated by S&P Global Ratings and Fitch Ratings.

Outlook:

  • Expected Capital Deployment in 2022 of Over $4.3 billion
    • Majority of expected 2022 capital deployment related to Liberty NY Water acquisition (completed) and Kentucky Power Acquisition (pending)
    • Capital plan remains on track, over $1.2 billion has been invested YTD as of end Q2 2022:
      • 609 million deployed for closing of Liberty NY Water
      • Over $200 million of capital invested into organic investments in Q2 2022
    • Committed to maintaining investment-grade capital structure
      • Moody’s Investors Service assigned an inaugural Baa2 long term issuer rating to Liberty Utilities Co. with outlook stable

See the full Earnings Release here 

Below is a snapshot of ‘The List’ from last Friday’s close. For a sortable version of ‘The List’, please click on The List menu item.

‘The List’ is not meant to be a template for investors to copy exactly. Instead, its purpose is to provide investment ideas and a real-time illustration of dividend growth investing in action. It is not a ‘Buy List’ nor does it reflect the composition or returns of our Magic Pants Wealth-Builder (CDN) Portfolio. It is only a starting point for our analysis and discussion.

The List (2022)
Last updated by BM on August 12, 2022

*Note: The following graph is wide, you can scroll to the right on your device to see more of the data.

SYMBOL COMPANY YLD PRICE YTD % DIV YTD % STREAK
AQN-N Algonquin Power & Utilities 4.9% $14.49 1.0% $0.70 5.4% 11
ATD-T Alimentation Couche-Tard Inc. 0.7% $59.49 14.2% $0.44 18.1% 12
BCE-T Bell Canada 5.6% $64.47 -2.2% $3.64 4.0% 13
BIP-N Brookfield Infrastructure Partners 3.5% $41.50 1.9% $1.44 5.9% 14
CCL-B-T CCL Industries 1.5% $63.58 -6.2% $0.96 14.3% 20
CNR-T Canadian National Railway 1.8% $163.73 5.7% $2.93 19.1% 26
CTC-A-T Canadian Tire 3.6% $162.78 -11.1% $5.85 24.5% 11
CU-T Canadian Utilities Limited 4.4% $40.52 10.7% $1.78 1.0% 50
DOL-T Dollarama Inc. 0.3% $79.25 25.0% $0.22 9.2% 11
EMA-T Emera 4.3% $61.50 -1.7% $2.65 2.9% 15
ENB-T Enbridge Inc. 6.2% $55.55 12.1% $3.44 3.0% 26
ENGH-T Enghouse Systems Limited 2.2% $32.90 -28.3% $0.72 16.3% 15
FNV-N Franco Nevada 1.0% $133.34 -2.0% $1.28 10.3% 14
FTS-T Fortis 3.6% $60.27 -0.3% $2.14 2.9% 48
IFC-T Intact Financial 2.1% $192.11 17.3% $4.00 17.6% 17
L-T Loblaws 1.3% $117.99 14.9% $1.54 12.4% 10
MGA-N Magna 2.8% $65.30 -20.0% $1.80 4.7% 12
MRU-T Metro 1.6% $70.64 5.4% $1.10 12.2% 27
RY-T Royal Bank of Canada 3.9% $128.03 -6.4% $4.96 14.8% 11
SJ-T Stella-Jones Inc. 2.0% $40.54 -0.3% $0.80 11.1% 17
STN-T Stantec Inc. 1.1% $64.90 -7.5% $0.71 6.8% 10
TD-T TD Bank 4.1% $86.45 -13.0% $3.56 12.7% 11
TFII-N TFI International 1.0% $107.56 -2.9% $1.08 12.5% 11
TIH-T Toromont Industries 1.4% $107.06 -5.8% $1.52 15.2% 32
TRP-T TC Energy Corp. 5.5% $65.32 9.4% $3.57 4.4% 21
T-T Telus 4.4% $30.11 1.2% $1.33 6.2% 18
WCN-N Waste Connections 0.6% $141.56 5.6% $0.92 8.9% 12
Averages 2.8% 0.6% 10.2% 18

MP Market Review – August 5, 2022

Last updated by BM on August 8, 2022

Summary

  • This article is part of our weekly series (MP Market Review) highlighting the performance and activity from the previous week related to the financial markets and Canadian dividend growth companies we follow on ‘The List’.
  • Last week, ‘The List’ was down a few basis points with a minus -1.3% YTD price return (capital). Dividend growth of ‘The List’ remains at 10.2% YTD, demonstrating the rise in income over the last year.
  • Last week, there were no dividend increases from companies on ‘The List’.
  • Last week, there were four earnings reports from companies on ‘The List’.
  • Eight companies on ‘The List’ are due to report earnings this week.
  • Are you looking for a portfolio of ideas like these? Magic Pants DGI Premium Membership Subscribers get exclusive access to the MP Wealth-Builder Model Portfolio (CDN). Learn More

 “Markets are designed to suck the most amount of people in at the most inopportune time.”

– Keith McCullough, Hedgeye CEO

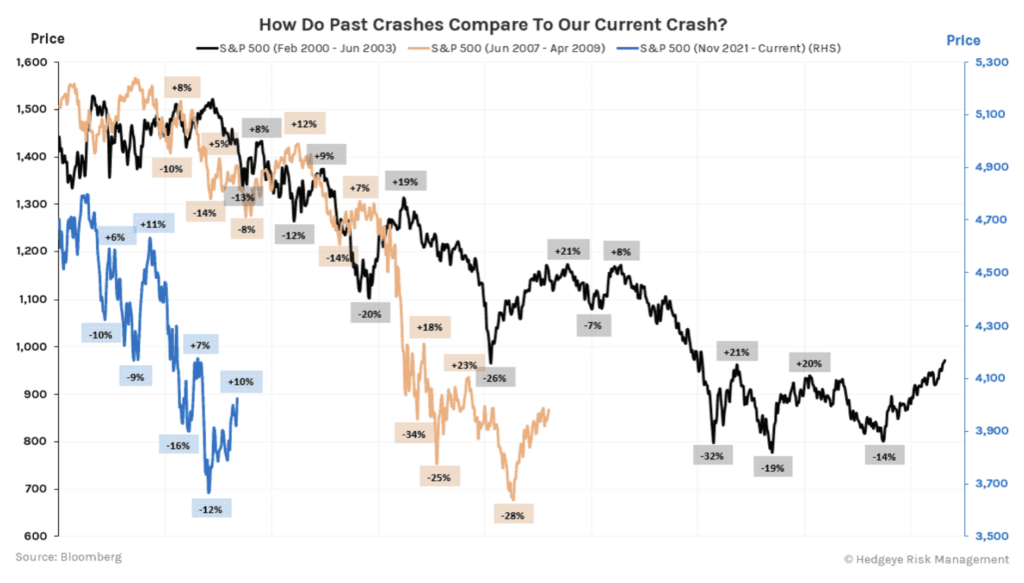
We read an interesting article from Hedgeye (macro investing subscription) over the weekend comparing the last two bear markets in the United States to today’s market. The premise of the article was the last two bear markets saw much larger bear market rallies than we saw in July and the markets continued lower. The average move up in the US 2000-2003 bear market was +15% and the average move down was -18%. In the 2008-2009 bear market the average move up was +12% and the average move down was -19%.

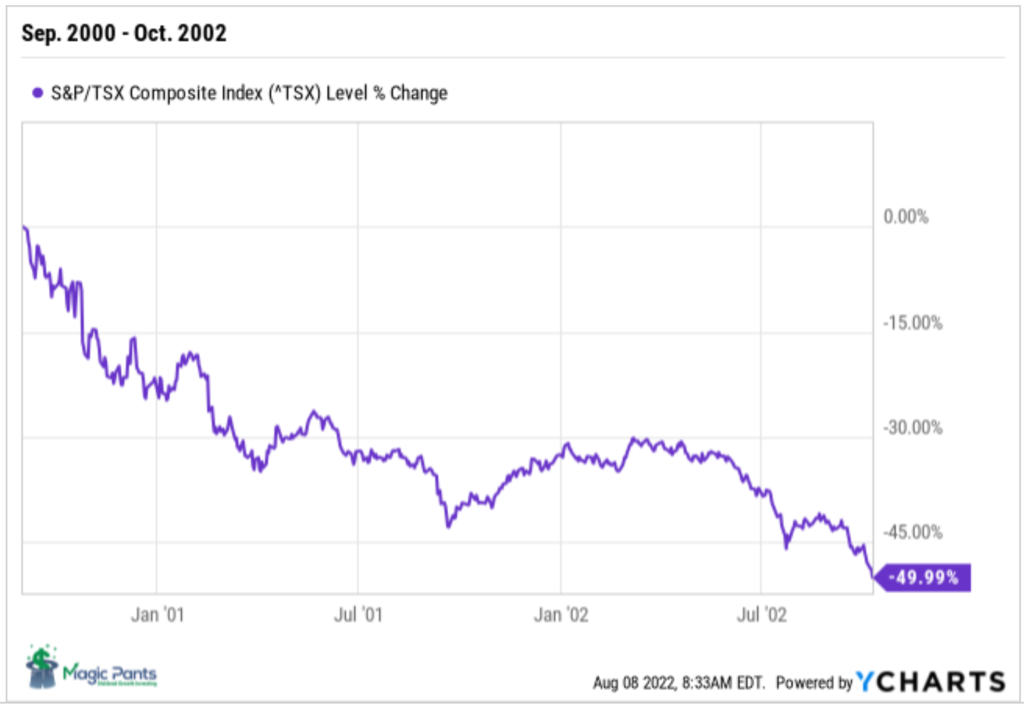
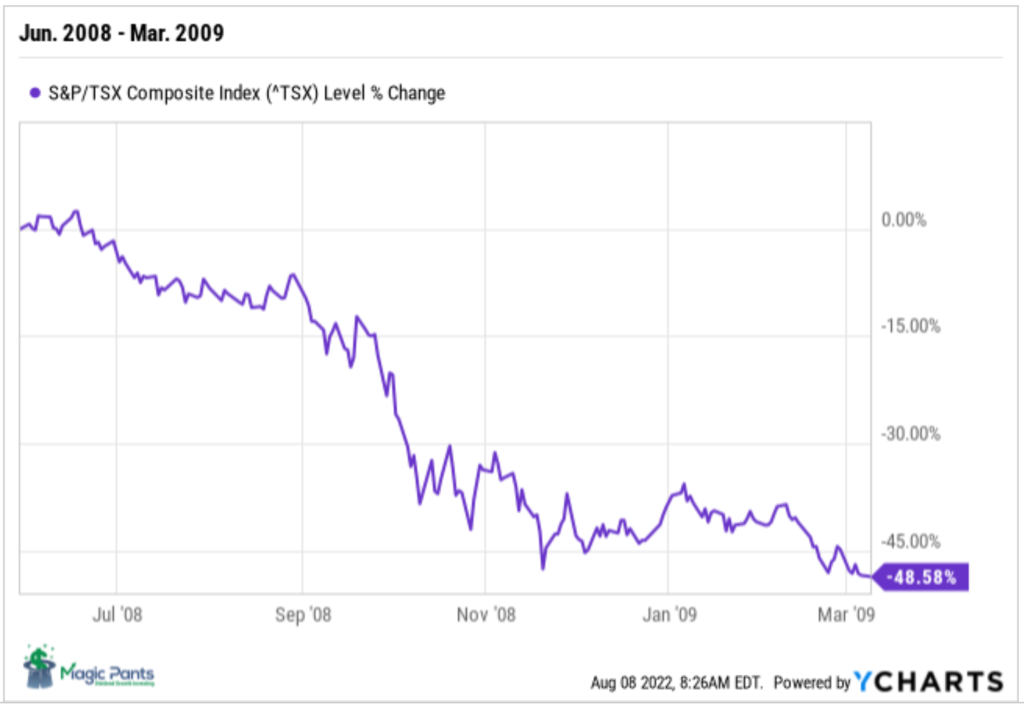
We decided to look at the Canadian markets during these bear markets to see how they behaved. Here are the two charts:

Similar to the markets south of the border, the last two bear markets in Canada had several bounces before the Canadian market found its bottom.

In terms of duration, the current crash has only lasted 16% as long as 2000 and 40% as long as 2008. The message we get from this is that the current bear market has a high probability of lasting much longer.

Although many of our good dividend growers faired much better during past bear markets we are still vigilant about getting ‘sucked in’ too soon given today’s macro conditions.

Performance of ‘The List’

Last week, ‘The List’ was down a few basis points with a minus -1.3% YTD price return (capital). Dividend growth of ‘The List’ remains at 10.2% YTD, demonstrating the rise in income over the last year.

The best performers last week on ‘The List’ were TFI International (TFII-N), up 6.31%; Waste Connections (WCN-N), up 3.72%; and Canadian Tire (CTC-A-T), up 3.05%.

TC Energy Corp. (TRP-T) was the worst performer last week, down -6.91%.

Recent News

What’s wrong with my dividend ETF? (Globe & Mail)

“Long-term investors should be aware that energy stocks will one day be dead weight for dividend stocks. Low oil prices would be a twofold problem – lower share prices and falling dividend payments.”

The author speaks about the differences in an ETF’s weighting as a major determinant of the funds’ returns. When we reviewed the top dividend ETFs in Canada, we found a similar issue. The Canadian ETFs were heavily weighted in energy and financial companies (over 50%) which can cause quite a fluctuation in performance year to year.

‘The List’ and our model portfolio are purposely built so that no one sector will have an adverse effect on long-term returns. Compare our historical performance (on the subscribe page) to other dividend funds to see for yourself.

Acquisition of LifeWorks approved by Lifeworks shareholders (Telus website)

“Following LifeWorks’ shareholder approval, we remain highly confident in receiving the appropriate regulatory approvals and, in turn, closing this transaction on or about the fourth quarter of 2022, and look forward to welcoming LifeWorks’ employees and customers into our TELUS Health family,” said  Darren Entwistle, President and CEO.”

 It will be interesting to watch Telus’ transition over the next few years!

Eight companies on ‘The List’ are due to report earnings this week.  

Metro (MRU-T) will release its third-quarter 2022 results on Wednesday, August 10, 2022, before markets open.

Emera (EMA-T) will release its second-quarter 2022 results on Wednesday, August 10, 2022, before markets open.

Stella-Jones (SJ-T) will release its second-quarter 2022 results on Wednesday, August 10, 2022, before markets open.

Stantec (STN-T) will release its second-quarter 2022 results on Wednesday, August 10, 2022, after markets close

Franco-Nevada (FNV-N) will release its second-quarter 2022 results on Wednesday, August 10, 2022, after markets close

CCL Industries (CCL-B-T) will release its second-quarter 2022 results on Wednesday, August 10, 2022, after markets close

Canadian Tire Corp. (CTC-A-T) will release its second-quarter 2022 results on Thursday, August 11, 2022, before markets open.

Algonquin Power & Utilities (AQN-N) will release its second-quarter 2022 results on Thursday, August 11, 2022, after markets close

Dividend Increases

Last week, there were no dividend increases from companies on ‘The List’.

Earnings Releases

Last week, four companies on ‘The List’, reported their Q2 Fiscal 2022 earnings. Let’s get started with Waste Connections.

Waste Connections (WCN-N)

“Accelerating solid waste pricing and E&P waste activity drove a top-to-bottom beat in the period.  Solid waste pricing growth of 8.8% enabled us to overcome increased inflationary pressures during the period and deliver adjusted EBITDA(b) margin in line with our outlook for Q2 and flat on a year over year basis excluding the margin dilutive impact from acquisitions completed since the year ago period,” said Worthing F. Jackman, President and Chief Executive Officer.

Highlights:

  • Accelerating solid waste pricing growth and E&P waste activity drive better than expected Q2 results
  • Revenue of $1.816 billion, up 18.4%
  • Net income of $224.1 million, and adjusted EBITDA of $566.8 million, up 16.9%
  • Adjusted EBITDA margin of 31.2% of revenue, in line with outlook and flat year over year, excluding acquisitions
  • Net income of $0.87 per share, and adjusted net income of $1.00 per share, up 23.5%
  • Year to date net cash provided by operating activities of $973.7 million and adjusted free cash flow(b) of $638.4 million, or 18.4% of revenue
  • Year to date signed or closed acquisitions with approximately $470 million of total annualized revenue
  • Increases full year 2022 outlook to revenue of approximately $7.125 billion, net income of approximately $837.5 million, adjusted EBITDA of approximately $2.190 billion, net cash provided by operating activities of approximately $1.974 billion and adjusted free cash flow of approximately $1.160 billion

Outlook:

Waste Connections also updated its outlook for 2022, which assumes no change in the current economic environment or underlying economic trends.

  • Revenue is estimated to be approximately $7.125 billion, as compared to our original revenue outlook of approximately $6.875 billion.
  • Net income is estimated to be approximately $837.5 million, and adjusted EBITDA is estimated to be approximately $2.190 billion, or about 30.7% of revenue, as compared to our original adjusted EBITDA outlook of $2.145 billion or 31.2% of revenue.
  • Capital expenditures are estimated to be approximately $850 million, in line with our original outlook.
  • Net cash provided by operating activities is estimated to be approximately $1.974 billion, and adjusted free cash flow of approximately $1.160 billion, or about 16.3% of revenue, as compared to our original adjusted free cash flow outlook of $1.150 billion or 16.7% of revenue.

See the full Earnings Release here

Brookfield Infrastructure Partners (BIP-N)

“We generated record financial results during the second quarter, with strong cash flows from our base business given the essential nature of our investments and the highly regulated or contracted revenue frameworks they operate under,” said Sam Pollock, Chief Executive Officer of Brookfield Infrastructure. “It was a very successful quarter as we continued to execute on our asset rotation strategy. In the past several weeks, we committed $1.9 billion across two marquee European companies and agreed to sell four mature assets for total proceeds of nearly $900 million. We will once again exceed our annual investment deployment target and thus our financial results should remain strong and well ahead of last year.”

Highlights:

  • FFO of $513 million in the second quarter represents an increase of 30% over the prior year on a total basis
    • FFO per unit increased by 20% reflecting the shares issued in conjunction with the Inter Pipeline privatization and an equity offering completed in November
    • Organic growth was 10% reflecting the high inflationary environment and earnings associated with ~$1 billion of capital commissioned over the last 12 months
    • Significant contribution from our asset rotation program and the privatization of Inter Pipeline in the second half of 2021
  • Distribution of $0.36 per unit represents an increase of 6% compared to the prior year
  • Payout ratio for the quarter of 69% falls within our long-term 60-70% target range
  • Net income benefited from the contribution associated with recent acquisitions, organic growth across our base business, as well as a mark-to-market gain on our foreign currency hedging program
    • Excluding the impact of disposition gains in the current and prior year, net income increased $200 million relative to last year
  • Total assets decreased compared to December 31, 2021 due to the impact of foreign exchange more than offsetting organic growth and the acquisition of two Australian utilities

Strategic Initiatives:

  • Closed the acquisition of Intellihub, the leading provider of electricity smart meters in Australia and New Zealand, for ~$215 million (BIP’s share) on April 1, 2022
  • Announced two take private transactions:
    • Acquisition of Uniti Group Ltd. through a 50/50 joint venture partnership; net to BIP equity of ~$200 million, closing expected in early August
    • Acquisition of HomeServe Plc, a residential infrastructure business in the U.K. and U.S.; net to BIP equity of ~$1.3 billion, closing expected in Q4
  • Announced an agreement to acquire a 51% interest, alongside another institutional investor, in a marquee portfolio of ~36,000 telecom towers in Germany and Austria; total transaction size is €17.5 billion (net to BIP equity – ~$600 million)

Outlook:

The macroeconomic outlook has continued to evolve as central banks are making a concerted effort to tackle high inflation by way of substantial interest rate hikes. Consequently, these actions have increased the probability of recessionary conditions in many markets in which we operate. While an economic slowdown will generally have negative consequences for many companies, the highly contracted and regulated nature of the revenue frameworks at our assets should cushion the effects on Brookfield Infrastructure. Nonetheless we will continue to operate our businesses prudently, by monitoring inflationary cost pressures within our business and maintaining high levels of liquidity.

From a new investment perspective, we may be entering a period where we can buy for value. Generally, we expect that infrastructure assets will hold their value through recessionary conditions given their resilient nature. However, should liquidity in the market become tighter, certain owners of high-quality assets may become overextended, allowing us to use our liquidity and access to capital to make investments at attractive entry points. Following an active start to the year, we are focused on a number of new investment opportunities that if successful, will begin contributing toward our 2023 capital deployment target.

For the remainder of the year, our priority will be to complete the investments and asset sales that we have secured or are in the process of securing. We will once again exceed our investment deployment target for the year and thus the financial results for the year should remain strong and well ahead of last year.

See the full Earnings Release here

Bell Canada (BCE-T)

“We continue to see momentum in wireless with 110,761 mobile phone net subscriber activations and strong service revenue growth. Our retail Internet net activations were also up 27.9% with 8% residential Internet revenue growth. These excellent results are a testament to the significant and unprecedented investments we’re making in network connectivity, reliability, and our fibre footprint expansion. In addition, our continued investments in customer experience and digital support options are encouraging customers to stay with Bell, as reflected in a third consecutive quarter of improved churn for our wireless, residential Internet and Fibe TV services.”

Highlights:

  • Consolidated adjusted EBITDA up 4.6% driven by 3.8% service revenue growth
  • Net earnings of $654 million, down 10.9%, with net earnings attributable to common shareholders of $596 million, or $0.66 per common share, down 13.2%; adjusted net earnings1 of $791 million generated adjusted EPS1 of $0.87, up 4.8%
  • Wireless operating momentum continues: 110,761 mobile phone net subscriber activations, up 139.5%; best-ever quarterly postpaid churn2 rate of 0.75%; 3.8% higher mobile phone blended ARPU ; and strong service revenue and adjusted EBITDA growth of 7.8% and 8.3% respectively
  • Next evolution of 5G underway with the launch of mobile 5G+, delivering Bell’s fastest mobile speeds ever
  • Retail Internet net activations up 27.9% to 22,620 with 8% residential Internet revenue growth; on track to deliver approximately 900,000 new fibre locations in 2022
  • Broadband leadership underscored with upcoming launches of 8 Gbps symmetrical pure fibre Internet service in select areas of Toronto with data upload speeds 250 times faster than cable, and Wi-Fi 6E technology; and newly launched Fibe TV service powered by Google Android TV
  • Media revenue up 8.7% with 5.6% adjusted EBITDA growth; digital revenue up 55%
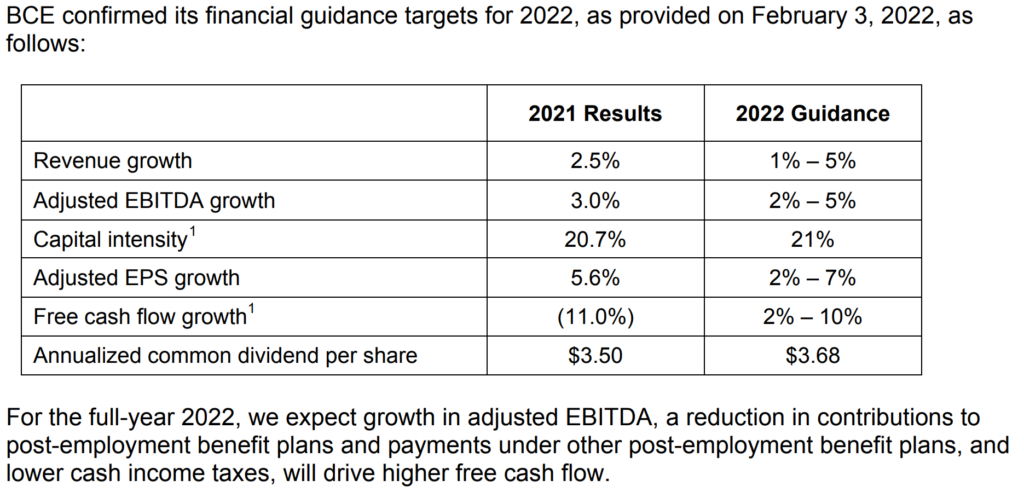
  • Reconfirming all 2022 financial guidance targets

Outlook:

See the full Earnings Release here

Telus (T-T)

“In the second quarter, the TELUS team once again demonstrated continued execution excellence, characterized by the consistent combination of industry-leading customer growth, resulting in strong operational and financial results across our business,” said Darren Entwistle, President and CEO. “Our robust performance reflects the potency of our globally leading broadband networks and customer-centric culture, which enabled record second quarter total customer additions of 247,000. This included strong mobile phone net additions of 93,000, our best second quarter result since 2011, and industry-leading total fixed net additions of 62,000, an all-time second quarter record for TELUS. Our leading customer growth is underpinned by our consistent, industry-best client loyalty across our mobile and fixed product lines. Notably, again this quarter, blended mobile phone, PureFibre internet, Optik TV, security and voice churn were all below one per cent. Moreover, our industry-leading postpaid mobile phone churn of 0.64 per cent was unchanged over the prior year period, and represents the seventh quarter out of the last 10 below 0.80 per cent.”

Highlights:

  • Industry-leading total Mobile and Fixed customer growth of 247,000, up 24,000 over last year and our strongest second quarter on record, driven by higher year-over-year customer growth across our portfolio of leading Mobile and Fixed services
  • Leading customer growth reflects strong demand for our superior bundled offerings over world-leading broadband networks and leading customer loyalty results, including Blended Mobile Phone Churn of 0.81 per cent
  • Consolidated Revenue, Adjusted EBITDA, Net Income and Earnings Per Share growth of 7.1 per cent, 8.9 per cent, 45 per cent and 36 per cent, respectively, reflecting consistent execution excellence; Adjusted Net Income and Earnings Per Share of 21 per cent and 23 per cent, respectively
  • Continued operating momentum in our high-growth, technology-oriented verticals with robust Revenue growth across TELUS International, TELUS Health and TELUS Agriculture & Consumer Goods
  • Shareholders of LifeWorks approve our proposed acquisition; transaction to add significant scale, strengthening TELUS Health’s position as a leading global provider of digital primary and preventative healthcare, mental health and wellness solutions for employers

Outlook:

The assumptions for our 2022 outlook, as described in Section 9 in our 2021 annual MD&A, remain the same, except for the following:

Our revised estimates for 2022 economic growth in Canada, B.C., Alberta, Ontario and Quebec are 3.9%, 4.1%, 5.1%, 3.8% and 3.1%, respectively (compared to 4.3%, 4.2%, 4.4%, 4.5% and 3.7%, respectively, as reported in our 2021 annual MD&A). 11

Our revised estimates for 2022 annual unemployment rates in Canada, B.C., Alberta, Ontario and Quebec are 5.4%, 4.8%, 6.4%, 5.8% and 4.4%, respectively (compared to 6.1%, 5.2%, 7.1%, 6.1% and 5.3%, respectively, as reported in our 2021 annual MD&A).

Our revised estimates for 2022 annual rates of housing starts on an unadjusted basis in Canada, B.C., Alberta, Ontario and Quebec are 240,000 units, 40,000 units, 32,000 units, 87,000 units and 59,000 units, respectively (compared to 224,000 units, 39,000 units, 30,000 units, 83,000 units and 55,000 units, respectively, as reported in our 2021 annual MD&A).

The extent to which the economic growth estimates affect us and the timing of their impact will depend upon the actual experience of specific sectors of the Canadian economy.

See the full Earnings Release here

Below is a snapshot of ‘The List’ from last Friday’s close. For a sortable version of ‘The List’, please click on The List menu item.

‘The List’ is not meant to be a template for investors to copy exactly. Instead, its purpose is to provide investment ideas and a real-time illustration of dividend growth investing in action. It is not a ‘Buy List’ nor does it reflect the composition or returns of our Magic Pants Wealth-Builder (CDN) Portfolio. It is only a starting point for our analysis and discussion.

The List (2022)
Last updated by BM on August 5, 2022

*Note: The following graph is wide, you can scroll to the right on your device to see more of the data.

SYMBOL COMPANY YLD PRICE YTD % DIV YTD % STREAK
AQN-N Algonquin Power & Utilities 5.0% $14.07 -2.0% $0.70 5.4% 11
ATD-T Alimentation Couche-Tard Inc. 0.8% $57.30 10.0% $0.44 18.1% 12
BCE-T Bell Canada 5.7% $63.72 -3.3% $3.64 4.0% 13
BIP-N Brookfield Infrastructure Partners 3.5% $41.02 0.7% $1.44 5.9% 14
CCL-B-T CCL Industries 1.5% $63.40 -6.5% $0.96 14.3% 20
CNR-T Canadian National Railway 1.8% $164.33 6.1% $2.93 19.1% 26
CTC-A-T Canadian Tire 3.5% $169.53 -7.5% $5.85 24.5% 11
CU-T Canadian Utilities Limited 4.5% $39.90 9.0% $1.78 1.0% 50
DOL-T Dollarama Inc. 0.3% $76.01 19.9% $0.22 9.2% 11
EMA-T Emera 4.5% $59.44 -5.0% $2.65 2.9% 15
ENB-T Enbridge Inc. 6.2% $55.35 11.7% $3.44 3.0% 26
ENGH-T Enghouse Systems Limited 2.2% $33.24 -27.5% $0.72 16.3% 15
FNV-N Franco Nevada 1.0% $128.24 -5.8% $1.28 10.3% 14
FTS-T Fortis 3.6% $59.67 -1.3% $2.14 2.9% 48
IFC-T Intact Financial 2.1% $191.40 16.9% $4.00 17.6% 17
L-T Loblaws 1.3% $116.52 13.4% $1.54 12.4% 10
MGA-N Magna 2.9% $61.26 -24.9% $1.80 4.7% 12
MRU-T Metro 1.6% $70.30 4.9% $1.10 12.2% 27
RY-T Royal Bank of Canada 3.9% $126.47 -7.6% $4.96 14.8% 11
SJ-T Stella-Jones Inc. 2.1% $37.77 -7.2% $0.80 11.1% 17
STN-T Stantec Inc. 1.1% $62.16 -11.4% $0.71 6.8% 10
TD-T TD Bank 4.3% $83.44 -16.0% $3.56 12.7% 11
TFII-N TFI International 1.0% $106.24 -4.1% $1.08 12.5% 11
TIH-T Toromont Industries 1.4% $107.51 -5.4% $1.52 15.2% 32
TRP-T TC Energy Corp. 5.6% $63.55 6.4% $3.57 4.4% 21
T-T Telus 4.6% $28.92 -2.8% $1.33 6.2% 18
WCN-N Waste Connections 0.7% $138.33 3.2% $0.92 8.9% 12
Averages 2.8% -1.3% 10.2% 18

MP Market Review – July 29, 2022

Last updated by BM on August 1, 2022

Summary:

  • This article is part of our weekly series (MP Market Review) highlighting the performance and activity from the previous week related to the financial markets and Canadian dividend growth companies we follow on ‘The List’.
  • Last week, ‘The List’ was up close to 3% with a minus -0.8% YTD price return (capital). Dividend growth of ‘The List’ remains at 10.2% YTD, demonstrating the rise in income over the last year.
  • Last week, there were no dividend increases from companies on ‘The List’.
  • Last week, there were ten earnings reports from companies on ‘The List’.
  • Four companies on ‘The List’ are due to report earnings this week.
  • Are you looking for a portfolio of ideas like these? Magic Pants DGI Premium Membership Subscribers get exclusive access to the MP Wealth-Builder Model Portfolio (CDN). Learn More 

“Don’t try to buy at the bottom or sell at the top. This can’t be done except by liars.”

– Bernard Baruch

Last week saw the North American stock markets rally off their recent lows. When markets are in a bear market (down 20% or more from their recent high), this short-term rebound amid a longer-term bear market is known as a bear market bounce. This type of rally can be treacherous for investors who think the bear market is over and jump back in prematurely, only to be quickly disappointed as the bear market continues. They then sell into this downturn driving prices down even further.

It is hard to think that a new bull market is just around the corner when interest rates and inflation are rising, the US is in a technical recession (two consecutive quarters of declining GDP), and global markets are sinking fast.

A time-tested investing process will prevent you from getting caught up in bear market bounces. If our good dividend growers are not sensibly priced, we are okay with waiting until they are. We never feel like we are missing out and jump in too soon.

Performance of ‘The List’

Last week, ‘The List’ was up close to 3% with a minus -0.8% YTD price return (capital). Dividend growth of ‘The List’ remains at 10.2% YTD, demonstrating the rise in income over the last year.

The best performers last week on ‘The List’ were TFI International (TFII-N), up 10.74%; Canadian National Railway (CNR-T), up 8.68%; and Intact Financial (IFC-T), up 6.9%.

Canadian Tire (CTC-A-T) was the worst performer last week, down -3.7%.

Recent News

TC Energy’s Coastal GasLink cost estimate jumps nearly 70 per cent (Globe & Mail)

The 670-km Coastal GasLink pipeline is being built to transport natural gas to an LNG Canada facility at the west coast of British Columbia, Canada’s first LNG export terminal.

COVID-related delays, sabotage and rising prices have all contributed to the cost overruns.

FAANGs ain’t what they used to be, so beware the bear-market bounce says this hedge fund manager (Marketwatch)

The S&P 500 index is up 12.6% from its recent low in June of this year and fresh off the best July performance since 1939. This money manager is not convinced the bottom is in just yet.

“He cites three items of what he terms truly bearish news over recent days; the Fed’s 75 basis point interest rate hike; a consecutive negative real GDP print; and “lousy” mega-cap tech earnings.”

Four companies on ‘The List’ are due to report earnings this week.  

Waste Connections (WCN-N) will release its second-quarter 2022 results on Tuesday, August 2, 2022, after markets close.

Brookfield Infrastructure Partners (BIP-N) will release its second-quarter 2022 results on Wednesday, August 3, 2002, before markets open.

Bell Canada (BCE-T) will release its second-quarter 2022 results on Thursday, August 4, 2022, before markets open.

Telus (T-T) will release its second-quarter 2022 results on Friday, August 5, 2022, before markets open.

Dividend Increases

Last week, there were no dividend increases from companies on ‘The List’.

Earnings Releases

Last week, more than one-third of the companies on ‘The List’ reported earnings. Let’s get started with Canadian National Railway.

Canadian National Railway (CNR-T)

“I am proud of our team of railroaders and pleased with our solid performance this quarter. Our team has the network running well, demonstrating improvements in service levels to our customers, driving greater velocity and generating strong financial results. We are preparing for a busy fall and are well positioned to achieve our 2022 outlook.” – Tracy Robinson, President and Chief Executive Officer, CN

Highlights:

  • Record revenues of C$4,344 million, an increase of C$746 million or 21%.
  • Record operating income of C$1,769 million, an increase of 28%, and record adjusted operating income of C$1,781 million, an increase of 29%.
  • Diluted EPS of C$1.92, an increase of 32%, and record adjusted diluted EPS of C$1.93, an increase of 30%. 
  • Operating ratio, defined as operating expenses as a percentage of revenues, of 59.3%, an improvement of 2.3- points, and adjusted operating ratio of 59.0%, an improvement of 2.6-points. 
  • Free cash flow for the first six months of 2022 was C$1,568 million compared to C$1,280 million for the same period in 2021.
  • Injury frequency rate increased by 43% and the accident rate decreased by 24%.
  • Car velocity (car miles per day) improved by 2% and through dwell (entire railroad, hours) improved by 6%.
  • Fuel efficiency improved by 4% to a record of 0.838 US gallons of locomotive fuel consumed per 1,000 gross ton miles (GTMs).
  • For the month of June, origin train performance, defined as the percentage of actual train departure time compared to designed train departure time at selected yards, reached 91%, an improvement of 14% compared to 80% for the same period in 2021.

Outlook:

Reaffirming 2022 financial outlook

CN confirms its 2022 outlook targeting to deliver approximately 15-20% adjusted diluted EPS growth in 2022. CN continues to target an operating ratio below 60% for 2022 as well as a ROIC of approximately 15%. CN maintains its free cash flow target in the range of C$3.7 billion – C$4.0 billion in 2022. 

See the full Earnings Release here


Toromont Industries (TIH-T)

“We are pleased with our operating and financial performance. While end market activity levels remain solid, the persistent supply constraint pressures and inflation variables contributed to a fluid and complex operating environment. The Equipment Group reported good activity in rental and product support, while global supply chain challenges persist and continue to impact timing of equipment and parts deliveries. CIMCO revenues decreased in the quarter on timing of project construction schedules, against a strong comparable last year, while product support activity improved. Across the organization, there is continued attention to our operating disciplines, while working closely with our customers and stakeholders to manage through uncertain conditions.”

Highlights:

  • Revenues decreased 4% in the quarter against a tough comparable. Revenues in 2021 benefited from timing of project construction activity, as well as accelerated purchasing by customers as COVID restrictions began to ease and reflecting historically high activity. Equipment sales were down 19% compared to prior year, with the Equipment Group down 16% and CIMCO package revenues down 38%, as both groups continue to experience delays in construction project schedules and deliveries due to supply chain constraints in the current year. Product support revenues were 14% higher on increased demand and technician headcount, with work-in-process levels remaining high, while rental revenues grew 19% on a larger fleet and higher utilization.
  • Revenues on a year-to-date basis were largely unchanged at $1.9 billion, as the improved activity in rentals (up 23%) and product support (up 12%) offset reductions in equipment and package revenues (down 12%) against a tough comparable last year, coupled with continuing supply chain issues in the current year.
  • Operating income increased 28% in the quarter on a favourable sales mix (higher percentage of rentals and product support revenues to total revenues) and improved gross margins. Expense levels were up slightly at 12.1% of revenue (11.7% in Q2 2021), reflecting continued cost focus in an inflationary environment, consistent with gradual business openings.
  • Operating income increased 26% in the first half of 2022, and was 12.5% of revenues compared to 10.0% in the similar period last year, reflecting the continued favourable sales mix and improved gross margins, offset by a higher expense ratio.
  • Net earnings increased $26.3 million or 31% in the quarter versus a year ago to $111.7 million or $1.35 EPS.
  • For the first half of the year, net earnings increased $37.9 million or 28% to $171.2 million, or $2.08 EPS.
  • Bookings for the second quarter were 34% lower compared to last year and were 25% lower on a year-to-date basis. Both the Equipment Group and CIMCO reported strong bookings in 2021, after a period of lower activity stemming from COVID restrictions. Backlogs were $1.5 billion at June 30, 2022, compared to $957.8 million at June 30, 2021, reflecting strong order activity over the past year coupled with ongoing supply constraints.

Outlook:

We are closely monitoring global economic factors, in particular, inflationary pressures from price and wage increases, including increases from our key suppliers. Initiatives are underway across all of our operations to improve efficiency and leverage the learnings from the last two years, including use of technology and innovative ways to engage with customers, employees and other partners with reduced discretionary spending.

The ongoing challenges in the global supply chain have resulted in delivery date delays for equipment, components and parts and this is expected to continue. We continue to actively manage supply chain constraints by taking appropriate mitigation steps in collaboration with our key suppliers and our customers, such as actively sourcing used equipment, optimizing preparation time on equipment, and offering rebuilds and rental options. We expect a tight supply environment to continue.

There is ongoing concern and uncertainty regarding COVID-19. Staff shortages, reduced customer activity and demand, product availability and other supplier constraints, inflationary impacts and increased government regulations or intervention, are some of the factors that have and may continue to negatively impact our business, consolidated financial results and conditions of the Company. As a result, it is not possible to reliably estimate the length and severity of these developments as well as the impact on the consolidated financial results and condition of the Company in future periods.

The protection and support of our people remains a priority, particularly, our front-line technical workforce who provide valuable service to our customers. Workforce planning initiatives, including hiring and scheduling, continue in light of current and expected activity levels.

The Equipment Group’s parts and service business provides stability supported by a large and diversified installed base of equipment. The on-going integration and alignment of operating processes and systems, best practices and culture, continues across our territory. The long-term outlook for infrastructure projects and other construction activity is positive across most territories although tied somewhat to the general economic climate which is increasingly uncertain. Mining customers and our operations that support them continue to evaluate appropriate activity levels on a daily/weekly basis. Longer term, mine expansion will remain dependent on global economic and financial conditions.

Investment continues in broadening product lines and service offerings, the branch network, rental fleets, and technologies to create efficiency and effectiveness across the organization. Product support technologies, such as remote diagnostics, telematics and digital information models support and expand our strategic platform.

CIMCO’s installed base and product support levels supports current and future operations and growth trends. CIMCO has a wide product offering using natural refrigerants including innovative CO2 solutions, which remains a differentiator in recreational markets. In industrial markets, CIMCO’s proven track record and strong geographical coverage provides growth opportunities. Recreational markets have been limited due to pandemic restrictions, however over the longer term, opportunity exists. Current backlogs are supportive of future activity. Inflationary costs and highly competitive pricing by competition in the market continue to challenge package revenue growth opportunities.

The diversity of the markets served, expanding product offering and services, strong financial position and disciplined operating culture position the Company well for continued positive results in the long term.

See the full Earnings Release here


Loblaws (L-T)

“Loblaw delivered consistent operating and financial results, as customers recognized the value, quality and convenience delivered through our diverse store formats, control brand products, and our PC Optimum loyalty program,” said Galen G. Weston, Chairman and President, Loblaw Companies Limited. “In the quarter we also continued to pursue our strategic growth agenda, with the completion of our acquisition of Lifemark Health Group, bolstering our healthcare services offering and furthering our purpose to help Canadians Live Life Well.”

Highlights:

  • Revenue was $12,847 million, an increase of $356 million, or 2.9%.
  • Retail segment sales were $12,623 million, an increase of $341 million, or 2.8%.
  • Food Retail (Loblaw) same-stores sales increased by 0.9%.
  • Drug Retail (Shoppers Drug Mart) same-store sales increased by 5.6%.
  • E-commerce sales decreased by 17.5%, lapping elevated online sales due to lockdowns last year.
  • Operating income was $742 million, a decrease of $10 million, or 1.3%. Operating income was negatively impacted by $111 million as a result of a charge related to a President’s Choice Bank (“PC Bank”) commodity tax matter.
  • Adjusted EBITDA² was $1,499 million, an increase of $128 million, or 9.3%.
  • Retail segment adjusted gross profit percentage² was 31.4%, an increase of 50 basis points.
  • Net earnings available to common shareholders of the Company were $387 million, an increase of $12 million or 3.2%. Diluted net earnings per common share were $1.16, an increase of $0.07, or 6.4%. Diluted net earnings per common share was negatively impacted by $0.25 per common share as a result of a charge related to a PC Bank commodity tax matter.
  • Adjusted net earnings available to common shareholders of the Company² were $566 million, an increase of $102 million, or 22.0%.
  • Adjusted diluted net earnings per common share² were $1.69, an increase of $0.34 or 25.2%.
  • Repurchased for cancellation, 5.4 million common shares at a cost of $607 million and invested $302 million in capital expenditures. Retail segment free cash flow² was $840 million.
  • Acquired Lifemark Health Group (“Lifemark”) on May 10, 2022, adding to the Company’s growing role as a healthcare service provider, with a network of health and wellness solutions, accessible in-person and digitally.
  • PC ExpressTM Rapid Delivery announced, to make grocery and convenience items available to customers in an expected express delivery time of 30-minutes-or-less through a collaboration with DoorDash.

Outlook:

Loblaw will continue to execute on retail excellence in its core grocery and pharmacy businesses while advancing its growth initiatives in 2022. In the third year of the pandemic, the Company’s businesses remain well placed to service the everyday needs of Canadians. However, the Company cannot predict the precise impacts of COVID-19, the related industry volatility and inflationary environment on its 2022 financial results.

On a full year basis, the Company continues to expect:

  • its Retail business to grow earnings faster than sales;
  • to invest approximately $1.4 billion in capital expenditures, net of proceeds from property disposals, reflecting incremental store and distribution network investments; and
  • to return capital to shareholders by allocating a significant portion of free cash flow to share repurchases.

Based on its year to date operating and financial performance and momentum exiting the second quarter, the Company expects full year adjusted net earnings per common share growth in the mid-to-high teens.

 See the full Earnings Release here


Canadian Utilities Limited (CU-T)

“Canadian Utilities achieved adjusted earnings of $136 million or $0.51 per share in the second quarter of this year. This is $21 million or $0.08 per share higher than the second quarter of last year. The $21 million year-over-year increase in the second quarter earnings was primarily driven by strong operating metrics, and CPI indexing in our international natural gas distribution business in Australia.

Cost efficiencies, rate-based growth and the timing of expenditures in Alberta utilities, along with a strong performance from our Alberta Hub asset also contributed to this great year-over-year earnings growth.

Highlights: (Conference Call Transcript)

Going back to our Australia natural gas business, not only did we see growth in key operating metrics such as gross new connections, the business also benefited from upward pressure in Australian CPI and the regulatory CPI indexing mechanism.

Similar to the trends that we saw in the latter part of 2021, this upward trend in CPI serves to amplify the business’ strong operating performance and drives additional earnings. Currently, in-country forecasts now suggest that CPI could grow as much as 6% or potentially even higher for the full year. This will be a key trend to monitor throughout the remainder of 2022.

Moving on to our Canadian utilities, the strong performance that we saw from our businesses in the first quarter of this year continued into the second quarter. Our distribution utilities continued to deliver exceptional performance in their final year of the current performance-based regulation cycle, or PBR. The efficiencies unlocked in this PBR cycle will provide ratepayers with long-lasting benefits. I’ve touched on the mechanisms of PBR in prior calls, but as we move closer to the end of 2022 and the completion of our current PBR2 term, it’s worth briefly touching on our expectations for the Alberta distribution utilities in 2023.

Moving on to Luma Energy, we continue to see great earnings contributions from this investment, and numerous tangible signs that our work is improving the lives of people in Puerto Rico, bringing them closer to having a reliable and modern electricity system. Over the last year of Luma’s operations, Luma connected over 25,000 customers in net metering. That equates to 2,100 net metering installations per month, an equivalent tie-in of 130 megawatts of renewables to the Puerto Rico electricity system. The team has also executed numerous initiatives aimed at improving system reliability and reducing outage frequency, which has declined 30% since Luma assumed operations.

Moving on to capital, I just want to briefly touch on the capital investments we made in the second quarter of this year. The second quarter saw us invest $297 million in our business with $244 million of this being invested in our core utilities. This ongoing utility investment ensures the continued generation of stable earnings and reliable cash flows, while also driving rate-based growth.

Outlook:

“Overall, Canadian Utilities delivered another great quarter of earnings growth for our shareholders, with many of the key drivers of this earnings growth likely to persist through the remainder of this year.”

 See the full Earnings Release here


TC Energy (TRP-T)

TC Energy’s President and Chief Executive Officer, François Poirier commented, “Through the first six  months of 2022, we have delivered strong results reflecting the high utilization we continue to see across our entire system. Demand for clean, responsibly sourced natural gas remains high in North America, with energy security also driving incremental growth in the global LNG market.” Poirier continued, “I am pleased to report we have reached a significant milestone with the Coastal GasLink Limited Partnership (Coastal GasLink LP), signing revised agreements with LNG Canada that will allow the safe and timely execution of our largest LNG-linked project. The 670-kilometre Coastal GasLink project is approximately 70 per cent complete, with mechanical in-service expected by the end of 2023. Together with LNG Canada, this project will provide the first direct path for Canadian natural gas to reach global LNG markets. By leveraging our competitive strengths, we continue to develop solutions to move, generate and store the energy North America relies on in a secure and increasingly sustainable way.”

Highlights:

  • Consistent with our 2021 Annual Report outlook, 2022 comparable EBITDA is expected to be modestly higher than 2021, while 2022 comparable earnings per common share are expected to be consistent with 2021
  • Second quarter 2022 results were underpinned by solid utilization and reliability across our assets. The continued need for energy security has placed renewed focus on the long-term role our infrastructure will play in responsibly fulfilling North America’s energy demands:
    • Continued to deliver around a quarter of volumes destined for export from U.S. LNG facilities through our U.S. Natural Gas Pipelines and advanced 3.3 Bcf/d of additional projects during the first six months of the year
    • Total NGTL System deliveries averaged 12.8 Bcf/d, up nine per cent compared to second quarter 2021
    • S. Natural Gas Pipelines flows averaged 25.4 Bcf/d, up over three per cent compared to second quarter 2021
    • Bruce Power planned outages were completed ahead of schedule with results further augmented by the approximately $10/MWh increase in the contract power price that went into effect on April 1, 2022 related to the ongoing MCR program, asset management work and annual adjustments
    • During the quarter, the Keystone Pipeline System safely delivered nearly 610,000 Bbl/d as we placed approximately 30 per cent of the 2019 Open Season contracts into service effective April 1, 2022 with additional volumes anticipated through year end
  • Second quarter 2022 financial results:
    • Net income attributable to common shares of $0.9 billion or $0.90 per common share compared to a net income of $1.0 billion or $1.00 per common share in 2021. Comparable earnings1 of $1.0 billion or $1.00 per common share compared to $1.0 billion or $1.06 per common share in 2021
    • Segmented earnings of $1.7 billion compared to segmented earnings of $1.6 billion in 2021 and comparable EBITDA1 of $2.4 billion compared to $2.2 billion in 2021
    • Net cash provided by operations of $0.9 billion compared to 2021 results of $1.7 billion and comparable funds generated from operations1 was $1.6 billion compared to $1.8 billion in 2021
  • Declared a quarterly dividend of $0.90 per common share for the quarter ending September 30, 2022
  • Reinstated issuance of common shares from treasury at a two per cent discount under our Dividend Reinvestment Plan (DRP) commencing with the dividends declared on July 27, 2022 to prudently fund our growth program that includes increased project costs on the NGTL System and following our commitment to make an equity contribution of $1.9 billion to Coastal GasLink LP. We expect the DRP will be activated for a period of four quarters based on historical participation
  • Continued to advance our $28 billion secured capital program, with $1.5 billion invested in second quarter 2022
  • Reached revised project agreements with LNG Canada on the Coastal GasLink project which is now approximately 70 per cent complete
  • To date in 2022, finalized contracts for approximately 580 MW and 240 MW from wind energy and solar projects, respectively, that will largely be used to provide renewable power to portions of the Keystone Pipeline System. We expect to finalize additional contracts in 2022.

Outlook:

“Our overall comparable EBITDA and comparable earnings per common share outlook for 2022 remains consistent with the 2021 Annual Report. 2022 comparable EBITDA is expected to be modestly higher than 2021 and 2022 comparable earnings per common share outlook is expected to be consistent with 2021. Please refer to the 2021 Annual Report for additional details. We continue to monitor the impact of changes in energy markets, our construction projects and regulatory proceedings as well as COVID-19 for any potential effect on our 2022 comparable EBITDA and comparable earnings per share.

 Our total capital expenditures for 2022 are now expected to be approximately $8.5 billion. The increase from what was outlined in the 2021 Annual Report is primarily due to the partner equity contributions of approximately $1.3 billion we expect to make in 2022 to Coastal GasLink LP in accordance with revised agreements impacting Coastal GasLink LP.

 See the full Earnings Release here


Fortis (FTS-T)

“We are pleased to report another strong quarter, with financial results reflecting the underlying growth of our utilities as they continue to execute capital investments consistent with our 2022 capital plan. Affordability remains a key focus for our companies as we invest in safe and reliable electric and natural gas delivery infrastructure, and we are committed to ensuring the essential services we provide remain affordable for our customers,” said David Hutchens, President and Chief Executive Officer, Fortis.

Highlights:

  • Second quarter net earnings of $284 million, or $0.59 per common share
  • Adjusted net earnings2 of $0.57 per common share, up from $0.55 in the second quarter of 2021
  • 2022 Sustainability Report released today highlighting the Corporation’s progress on key sustainability initiatives
  • Capital expenditures2 of $1.9 billion in the first half of 2022; $4.0 billion annual capital plan on track
  • MISO board has approved first tranche of projects associated with LRTP; ITC’s estimated range of LRTP investments increased to between US$1.4 billion and US$1.8 billion
  • Tucson Electric Power filed general rate application seeking new rates in 2023 supporting reliable service and cleaner energy

Outlook:

The Corporation’s long-term outlook remains unchanged. Fortis continues to enhance shareholder value through the execution of its capital plan, the balance and strength of its diversified portfolio of utility businesses, and growth opportunities within and proximate to its service territories. While energy price volatility, global supply chain constraints and rising inflation are issues of potential concern that continue to evolve, including from the effects of the COVID-19 pandemic, war in Eastern Europe, economic sanctions and geopolitical tensions, the Corporation does not currently expect there to be a material impact on its operations or financial results in 2022.

The Corporation’s $20 billion five-year capital plan is expected to increase midyear rate base from $31.1 billion in 2021 to $41.6 billion by 2026, translating into a five-year compound annual growth rate of approximately 6%. Above and beyond the five-year capital plan, Fortis continues to pursue additional energy infrastructure opportunities.

Additional opportunities to expand and extend growth include: further expansion of the electric transmission grid in the United States to facilitate the interconnection of cleaner energy including infrastructure investments associated with MISO’s LRTP; natural gas resiliency investments in pipelines and liquefied natural gas infrastructure in British Columbia; and the acceleration of cleaner energy infrastructure investments across our jurisdictions.

Fortis expects long-term growth in rate base will support earnings and dividend growth. Fortis is targeting average annual dividend growth of approximately 6% through 2025.

 See the full Earnings Release here


TFI International (TFII-N)

“TFI International produced exceptionally strong results despite volatile macro conditions, with strong across-the-board performance and robust free cash flow that demonstrates the strength of our operating principles, a wealth of internal levers to drive efficiencies, and the growing diversity of our end markets,” said Alain Bédard, Chairman, President and Chief Executive Officer. “Our adjusted net income grew 76% over the year-ago quarter and our free cash flow expanded another 16% above already strong levels. In addition to double-digit top line growth generated by LTL, TL and Logistics, our operating ratios were remarkably strong, including 69% for Canadian LTL, underscoring the untapped potential across much of our network. Strategically, in addition to several attractive bolt-on acquisitions, we sold an underutilized terminal in Southern California acquired from UPS with no need to leaseback capacity. We also continued to repurchase shares given the attractive value we see in our own stock, and this week received Board approval to further expand our buyback authorization. As always, our balance sheet remains a pillar of our strength as we continue to seek attractive growth opportunities while returning capital to shareholders whenever possible in our drive to create long-term value.”

Highlights:

  • Second quarter operating income of $391.0 million decreased 17% from $470.9 million the same quarter last year due primarily to a bargain purchase gain of $283.6 million recognized in the prior year period. Adjusting for this prior-year bargain purchase gain, operating income increased 109%, benefitting from a continuing rebound in economic activity and transportation demand following pandemic-related weakness, as well as contributions from acquisitions, gains on sale of property and equipment and assets held for sale, cost reductions enacted in response to the pandemic, strong execution across the organization, and an asset-light approach.
  • Net income of $276.8 million decreased 33% compared to $411.8 million in Q2 2021. Diluted earnings per share (diluted “EPS”) of $3.00 decreased 31%, compared to $4.32 in Q2 2021. Both declines are due to the aforementioned bargain purchase gain recognized in the prior year period.
  • Adjusted net income , a non-IFRS measure, of $241.1 million increased 76% compared to $137.2 million in Q2 2021.
  • Adjusted diluted EPS , a non-IFRS measure, of $2.61 increased 81% compared to $1.44 in Q2 2021.
  • Net cash from operating activities of $247.8 million compares to $298.7 million in Q2 2021, primarily due to higher working capital needs related to fuel surcharges as fuel expenditures require expedited repayment.
  • Free cash flow , a non-IFRS measure, of $309.6 million increased 16% from 267.9 million in Q2 2021.
  • The Company’s reportable segments performed as follows: o Package and Courier operating income increased 25% to $36.8 million;
    • Less-Than-Truckload operating income decreased 47% to $187.3 million due to the prior-year period recognition of a $271.6 million bargain purchase gain and a gain of $54.6 million on sale of real estate recognized through gain on assets held for sale;
    • Truckload operating income increased 103% to $127.4 million; and
    • Logistics operating income decreased 11% to $42.4 million due to the prior-year period recognition of a $12.0 million bargain purchase gain.
  • During the second quarter TFI International repurchased and cancelled 2,629,441 shares for $211.7 million and on July 28, 2022 the Board of Directors of TFI authorized an increase to the NCIB program to a maximum of 8,798,283 shares, an increase of 1,798,283 over the previously authorized amount. The Company is awaiting approval of the amendment from the TSX.
  • On June 15, 2022, the Board of Directors of TFI declared a quarterly dividend of $0.27 per share, compared to the $0.23 per share dividend declared in Q2 2021, a 17% increase.
  • On May 16, 2022, the Company sold one property in southern California for $83.0 million, from its U.S. LTL operations, generating a gain on disposal of $54.0 million. The property was utilized at less than 50% and did not require a long term sale and leaseback arrangement as operations will be moved to other facilities in the region.
  • During the quarter, TFI International acquired South Shore Transportation, Cedar Creek Express, and Premium Ventures, and subsequent to quarter end completed the acquisition of Transport St-Amour and HO-RO Trucking Company

Outlook:

North American economic growth has recently slowed due to a variety of factors including rising interest rates, higher inflation including elevated energy prices, labor shortages, continued global supply chain challenges, higher commodity prices and slower growth in major international markets. TFI International’s diversity across industrial and consumer end markets and across many modes of transportation helped the company generate record results during the second quarter. Nonetheless, macro uncertainty persists and an increasing number of economists see the possibility of economic recession over the coming year.

TFI International has successfully navigated recent macro challenges and management remains vigilant in its monitoring for new potential risks, including additional COVID-19 variants and the potential economic disruption they could cause, risks related to energy prices, supply chain disruption, driver availability and higher wages. Factors such as these may cause additional rounds of declining freight volumes and higher costs, adversely affect TFI’s operating companies and the markets they serve. Additional uncertainties include but are not limited to geopolitical risk such as the ongoing war in Ukraine, policy changes surrounding international trade, environmental mandates and changes to the tax code in any jurisdictions in which TFI International operates.

Management believes the Company is well positioned for continued solid operational and financial performance in 2022 due to its strong financial foundation and cash flow generation, its lean cost structure, and a longstanding focus on profitability, efficiency, network density, customer service, optimizing pricing, driver retention, and the rationalization of assets to avoid internal overcapacity. TFI continues to have material synergy opportunities related to 2021’s acquisition of UPS Freight (now TForce Freight), the integration of which continues as planned, and the Company also has meaningful opportunities to enhance performance within its operations. In addition, the Company’s diverse industrial exposure through specialized TL and LTL should continue to benefit from increased domestic manufacturing as a result of reduced imports due to global supply chain issues. TFI is also well positioned to benefit over the long term from the ongoing expansion of e-commerce, which provides both growth and margin expansion opportunities for its P&C and Logistics business segments.

TFI International’s favorable positioning, which was significantly enhanced by last year’s acquisition of UPS Freight, should enable continued solid results over the remainder of this year assuming no significant degradation in economic conditions. Longer term, regardless of the operating environment, management’s goal is to build shareholder value through consistent adherence to its operating principles, including customer focus, an asset-light approach, and continual efforts to enhance efficiencies. In addition, TFI International values free cash flow generation and strong liquidity with a conservative balance sheet that features a high portion of attractive fixed-rate spreads and limited near-term debt maturities. This strong financial footing allows the Company to prudently invest in the business and pursue select, accretive acquisitions while returning excess capital to shareholders.

See the full Earnings Release here


Enbridge (ENB-T)

“Rising global energy shortages and high commodity prices are highlighting the importance of secure, affordable, and reliable energy supply. Energy markets are at a pivotal point, requiring renewed investment in both conventional and lowcarbon energy supply to meet growing energy demand, while achieving society’s emissions reductions goals. North America is ideally positioned to play a critical role in meeting future energy demand with its massive, low-cost and sustainable resources.

The current energy outlook validates our dual-pronged strategy to expand our existing conventional pipeline and export businesses, while ramping up investment in low-carbon opportunities to drive future growth platforms. As we execute our strategy, we’re committed to maintaining our low-risk business model which provides predictable and resilient cash flows in all market cycles.

In the second quarter, we continued to progress well on our strategic priorities.”

Highlights:

  • Second quarter GAAP earnings of $0.5 billion or $0.22 per common share, compared with GAAP earnings of $1.4 billion or $0.69 per common share in 2021
  • Adjusted earnings of $1.4 billion or $0.67 per common share , compared with $1.4 billion or $0.67 per common share in 2021
  • Adjusted earnings before interest, income taxes and depreciation and amortization (EBITDA) of $3.7 billion, compared with $3.3 billion in 2021
  • Cash provided by operating activities of $2.5 billion, compared with $2.5 billion in 2021
  • Distributable cash flow (DCF) of $2.7 billion or $1.36 per common share , compared with $2.5 billion or $1.24 per common share in 2021
  • Reaffirmed 2022 full year guidance range for EBITDA of $15.0 billion to $15.6 billion and DCF per share of $5.20 to $5.50
  • Executing the Company’s diversified secured capital program with approximately $4 billion on track to enter service in 2022, providing visible EBITDA growth in the years ahead
  • Reached a settlement in principle with participants on Texas Eastern ensuring the system continues to earn an appropriate return on invested capital
  • Sanctioned two projects totaling US$0.4 billion to deliver 1.5 billion cubic feet per day (bcf/d) of natural gas to Venture Global’s Plaquemines LNG facility
  • Secured estimated $1.2 billion expansion of B.C. Pipeline’s T-North section to serve growing regional demand and west coast LNG exports
  • Launched a binding open season for a $2.5+ billion expansion of B.C. Pipeline’s T-South section adding approximately 300 million cubic feet per day of new capacity
  • Announced an investment in the 2.1 million tonnes per annum (mtpa) Woodfibre LNG facility, representing a 30% interest, further advancing Enbridge’s LNG export strategy
  • Concluded three successful open seasons for capacity on the Alliance Pipeline highlighting the unique value of its liquids-rich transportation capability
  • Issued 21st Sustainability Report, demonstrating the Company’s ongoing progress towards the goals set in November 2020
  • The Company remains committed to its equity self-funding model and is on track to achieve Debt to EBITDA of 4.7x or lower by year end, providing significant financial flexibility

Outlook:

The Company reaffirms its 2022 financial guidance announced at its December Investor Day, which included adjusted EBITDA between $15.0 and $15.6 billion and DCF per share between $5.20 to $5.50. Results for the first half of 2022 are in line with expectations and the Company anticipates that its businesses will continue to experience strong utilization and good operating results through the balance of the year with normal course seasonality. Forward financial guidance reflects a provision in recognition of the uncertainty of future Mainline tolls associated with the ongoing commercial framework discussions with shippers.

Strong operational performance is expected to be offset by challenging market conditions which continue to impact Energy Services, along with higher financing costs, due to rising interest rates, relative to 2022 financial guidance.

 See the full Earnings Release here


Magna (MGA-N)

“Our second quarter results were largely in line with our expectations, excluding the impairment of our investment in Russia. While we anticipate ongoing industry disruption through at least the remainder of 2022, we expect light vehicle production and our earnings to increase in the second half of the year, compared to the first half. We continue to focus on our go-forward strategy and investing for the future.” – Swamy Kotagiri, Magna’s Chief Executive Officer

Highlights:

  • Sales of $9.4 billion increased 4%, compared to global light vehicle production increase of 2%
  • Diluted loss per share of $0.54 includes $1.24 of non-cash impairment charges related to our investment in Russia
  • Adjusted diluted earnings per share decreased 41%
  • Increased sales outlook

Outlook:

We first disclose a full-year Outlook annually in February, with quarterly updates. The following Outlook is an update to our previous Outlook in April 2022.

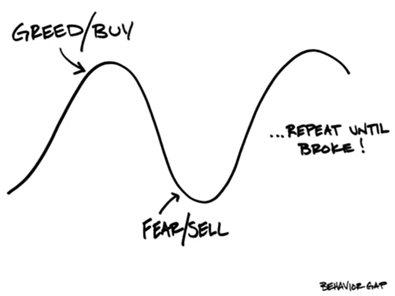
See the full Earnings Release here


Intact Financial (IFC-T)

“We delivered strong results in Q2-2022 with contribution from all segments. In the one year since the close of the RSA acquisition, we have achieved $175M in run-rate synergies and greatly strengthened our Canadian and specialty lines platforms. We remain optimistic about the growth opportunities across our business and particularly in specialty lines. We expect that our disciplined underwriting and deep claims expertise will continue to be assets in navigating inflation pressures, climate change and evolving driving patterns.”

Highlights:

  • Net operating income per share was $3.14 with meaningful accretion from RSA and strong investment and underwriting results
  • Operating DPW grew 36% in the quarter, driven by the RSA acquisition and 4% organic growth, led by commercial lines
  • Operating combined ratio of 90.7% was strong across all geographies, but higher than last year mainly due to catastrophe losses
  • EPS of $6.64 in the quarter reflecting strong operating results, significant gains on investments and the sale of Codan Denmark
  • OROE of 15.4% and ROE of 18.5% reflecting robust operating and non-operating performance
  • Total capital margin remains strong at $2.5 billion despite a volatile macroeconomic environment
  • After one year, NOIPS accretion from the RSA acquisition was well above expectations at 15%, and integration remains on track

Outlook:

  • Over the next twelve months, we expect firm-to-hard insurance market conditions to continue in most lines of business, supported by high pre-pandemic combined ratios, inflation, and climate change.
  • In Canada, we expect firm market conditions to continue in personal property. Personal auto premium growth is expected to progress towards the mid-single-digit range to reflect inflation and evolving driving patterns.
  • In commercial lines, in both the US and Canada, hard market conditions are expected to continue.
  • In the UK&I, hard market conditions are expected to continue across commercial lines. In personal lines, near term industry growth levels are uncertain as companies navigate pricing reforms and inflation.

 See the full Earnings Release here

Below is a snapshot of ‘The List’ from last Friday’s close. For a sortable version of ‘The List’, please click on The List menu item.

‘The List’ is not meant to be a template for investors to copy exactly. Instead, its purpose is to provide investment ideas and a real-time illustration of dividend growth investing in action. It is not a ‘Buy List’ nor does it reflect the composition or returns of our Magic Pants Wealth-Builder (CDN) Portfolio. It is only a starting point for our analysis and discussion.

The List (2022)
Last updated by BM on July 29, 2022

*Note: The following graph is wide, you can scroll to the right on your device to see more of the data.

SYMBOL COMPANY YLD PRICE YTD % DIV YTD % STREAK
AQN-N Algonquin Power & Utilities 5.0% $13.99 -2.5% $0.70 5.4% 11
ATD-T Alimentation Couche-Tard Inc. 0.8% $57.21 9.8% $0.44 18.1% 12
BCE-T Bell Canada 5.6% $64.70 -1.8% $3.64 4.0% 13
BIP-N Brookfield Infrastructure Partners 3.6% $39.83 -2.2% $1.44 5.9% 14
CCL-B-T CCL Industries 1.5% $64.33 -5.1% $0.96 14.3% 20
CNR-T Canadian National Railway 1.8% $162.23 4.7% $2.93 19.1% 26
CTC-A-T Canadian Tire 3.6% $164.51 -10.2% $5.85 24.5% 11
CU-T Canadian Utilities Limited 4.3% $41.45 13.2% $1.78 1.0% 50
DOL-T Dollarama Inc. 0.3% $77.61 22.4% $0.22 9.2% 11
EMA-T Emera 4.4% $60.71 -3.0% $2.65 2.9% 15
ENB-T Enbridge Inc. 6.0% $57.51 16.1% $3.44 3.0% 26
ENGH-T Enghouse Systems Limited 2.2% $32.80 -28.5% $0.72 16.3% 15
FNV-N Franco Nevada 1.0% $127.98 -6.0% $1.28 10.3% 14
FTS-T Fortis 3.5% $60.49 0.0% $2.14 2.9% 48
IFC-T Intact Financial 2.1% $190.60 16.4% $4.00 17.6% 17
L-T Loblaws 1.3% $116.57 13.5% $1.54 12.4% 10
MGA-N Magna 2.8% $63.86 -21.7% $1.80 4.7% 12
MRU-T Metro 1.6% $70.91 5.8% $1.10 12.2% 27
RY-T Royal Bank of Canada 4.0% $124.86 -8.8% $4.96 14.8% 11
SJ-T Stella-Jones Inc. 2.1% $38.01 -6.6% $0.80 11.1% 17
STN-T Stantec Inc. 1.1% $63.19 -10.0% $0.71 6.8% 10
TD-T TD Bank 4.3% $83.18 -16.3% $3.56 12.7% 11
TFII-N TFI International 1.1% $99.93 -9.8% $1.08 12.5% 11
TIH-T Toromont Industries 1.4% $107.85 -5.1% $1.52 15.2% 32
TRP-T TC Energy Corp. 5.2% $68.27 14.3% $3.57 4.4% 21
T-T Telus 4.5% $29.48 -0.9% $1.33 6.2% 18
WCN-N Waste Connections 0.7% $133.37 -0.5% $0.92 8.9% 12
Averages 2.8% -0.8% 10.2% 18

We buy quality individual dividend growth stocks when they are sensibly priced and hold for the growing income.