“You have a pair of pants. In the left pocket, you have $100. You take $1 out of the left pocket and put in the right pocket. You now have $101. There is no diminution of dollars in your left pocket. That is one magic pair of pants.”

Couche-Tard Breezes Past Estimates

Posted by JM on June 29, 2021 

Here is an excerpt from Alimentation Couche-Tard’s (ATD-B) recent quarterly earnings release June 29, 2021.

June 29 (Reuters) – Canada’s Alimentation Couche-Tard Inc breezed past estimates for quarterly profit and revenue on Tuesday, helped by strong sales at the convenience store chain’s fuel supply outlets following speedy vaccination drives and easing coronavirus curbs.

Revenue from its fuel business, which includes about 10,800 outlets across the United States, Europe and other countries, jumped 32% to $8.35 billion in the fourth quarter after falling by more than a third in the first three quarters.

“We had a steady improvement in parts of the network, especially in the United States, where we are starting to see a return to more normal driving behavior,” Chief Executive Officer Brian Hannasch said in a statement.

Couche-Tard’s results mirror that of U.S. peer Casey’s General Stores Inc, which reported growth in its fuel division earlier this month.

Fuel volumes, however, were still below pre-pandemic levels due to work-from-home policies and renewed restrictions in some regions including Ontario and Quebec, Couche-Tard said.

The Canadian company’s revenue from merchandise and services rose 15.2% to $3.72 billion, boosted by its move to sell fast-food items such as sandwiches, hot dogs and snacks at more stores.

Total revenue rose 26.3% to $12.24 billion in the fourth quarter ended April 25, exceeding analysts’ average estimate of $11.65 billion, according to Refinitiv-IBES data.

On an adjusted basis, Couche-Tard earned 52 cents per share, well above an estimate of 42 cents.

Early in 2021 Couche-Tard announced that they were trying to merge with French grocer Carrefour and the stock price declines on the news. As we monitor all the quality dividend growth stocks on ‘The List’ as part of our process, this event naturally caught our attention. We had been waiting to initiate a starting position in ATD-B for quite some time, but it had never been sensibly priced according to our valuation process. After reading managements reasons for the merger and reviewing the success of past acquisitions/mergers by the company, we felt comfortable in purchasing an initial position in our Canadian Magic Pants Portfolio. The proposed merger was opposed by the French government and the bid was eventually dropped by Couche-Tard. The share-price has since rebounded nicely.

The situation with Couch-Tard is no different from what happens all the time in the world of investing. A good quality company’s stock price comes under pressure due to some narrative and the price goes down. Having a process gives you the confidence to look closer at the fundamentals and decide if this weakness in price is likely to continue or be short term in nature. After this earnings release, ATD-B is now up ~25% from its January lows.

Q2 2021 Earnings Calendar-Intro

Posted by JM on June 28, 2021 

Benjamin Graham once remarked that earnings are the principal factor driving stock prices.

Each quarter we will provide readers with weekly earnings updates of stocks on ‘The List’ during the calendar earnings season. Q2 has just ended, and companies are now beginning to report. The chart can be found below the updated List by selecting ‘The List’ menu item. 

Earnings growth and dividend growth tend to go hand in hand so this information can tell us a lot about future dividend growth of our quality companies. Monitoring our dividend growers periodically is part of the process and reading the quarterly earnings releases is a good place to start.

Some of our dividend growers from ‘The List’ have reported quarterly earnings already, based on their fiscal year, with the majority of Q2 earnings scheduled to report in July. Here’s a list (sorted by date) of reporting dates, the market’s consensus estimates and actual reported results.

SYMBOL COMPANY DATE ESTIMATE RESULT
RY-T Royal Bank of Canada 27-May $2.49 $2.79
TD-T TD Bank 27-May $1.76 $2.04
ENGH-T Enghouse Systems Limited 10-Jun $0.45 $0.37
ATD-B-T Alimentation Couche-Tard Inc. 29-Jun $0.42

Finding Quality Dividend Growth Stocks

Updated by BM on October 4, 2023

“Whether we’re talking about socks or stocks, I like buying quality merchandise when it is marked down.”

– Warren Buffett

Safety is not in the number of stocks you own but in the quality. In our three-step dividend growth investing process, looking for ‘quality’ companies is where we start. Without a quality company to invest in, not much else matters. Here is a list of ‘quality’ indicators that we use:

Cyclicality
To assess a company’s quality, we begin by examining its historical earnings pattern. We evaluate whether the company has consistently achieved substantial earnings growth over the past decade or two. Companies that have maintained such growth are deemed more reliable and stable in comparison to those with erratic earnings during the same timeframe. This is primarily because companies with unpredictable earnings can often lead to misleading signals in terms of their valuation.

To steer clear of valuation errors and the necessity for precise market timing, our focus is directed towards companies whose earnings patterns are non-cyclical. This means we prefer businesses whose earnings are not significantly influenced by economic cycles or market fluctuations.

Dividend Growth Streak
Once we establish that a company exhibits the historical earnings pattern we prefer, which is typically non-cyclical, we then shift our focus to identifying a streak of dividend increases lasting at least 10 years. The longer this streak persists, the higher we consider the quality of the company.

Payout Ratios (Dividends vs Earnings) (Dividends vs Cash Flow; OCF and FCF)
Companies pay growing dividends from their growing cash flows. To ensure that the company can actually afford the dividends that it pays out we look at payout ratios. After all, we do not want to be the victims of a dividend cut that reduces our incomes and probably causes the stock price to decline.

Low payout dividend payers have traditionally done better than companies with high or negative payout ratios. Figure out the industry average and measure against it.

Dividend Growth Rates (5YR and 10YR)
We are looking for consistent dividend increases. The lower the starting yield, the higher the growth rate and time horizon required to achieve our income goals.

Growth Yield
Growth yield refers to the acquisition yield on cost of a stock, which takes into account the current annualized dividend payments in relation to the original cost basis of the investment. We like the term growth yield better as it proves that growth (a key part of our strategy) has indeed happened and highlights the yield you are now making on dividends alone.

Based on our experience, creating a stock portfolio with an average estimated growth yield and historical growth yield of greater than 7% after ten years has proven to be a reliable indicator of quality. Many of the companies we invest in beat the market on yield alone after only ten years

Recent Dividend Increase
A recent dividend increase is a positive statement by management that they have confidence in the business going forward.

Dividend Growth and Price Growth Alignment
Identifying companies whose dividend growth aligns closely with price growth can considerably enhance the predictability of future returns. Dividend growth investors know that the dividend drives the price in a predictable way, not the other way around.

Market Cap
Market capitalization is also an important indicator to consider when evaluating a company’s quality. It represents the total value of a company’s outstanding shares of stock and is calculated by multiplying the number of outstanding shares by the current market price per share. Companies with larger market capitalizations generally have more resources, a more established track record, and less volatility than smaller companies.

Although we review the above indicators as they are readily available for all the stocks we invest in, we find the independent research from services that sell information for a living to be the most informative.

Here are three additional ‘quality’ indicators we use when they are available:

Value Line’s Safety Rank
Measures the total risk of a stock relative to approximately 1,700 other stocks covered by Value Line. The safest stocks are assigned a rank of 1, whereas the riskiest ones are assigned a 5.

Value Line Financial Strength
Ratings, from A++ to C in nine steps. The lowest rating is reserved for companies in serious financial difficulty. Factors considered in assigning ratings include balance sheet strength, corporate performance, market capitalization, and stability of returns.

S&P Credit Ratings
Help investors determine investment risks. Ratings are either investment grade (AAA through BBB–) or speculative (BB+ through D).

A good practice is to rank your watch list of dividend growth companies by quality based on a combination of the metrics above. This along with your income goals and time horizon will help you with your position sizing as you build your portfolios.

Estimating Future Returns

Posted by BM on June 14, 2021 

We spend a lot of time reviewing historical returns and metrics as dividend growth investors. This is important as it gives you a better idea of the nature of the company you are investing in (cyclical or not) and when historically has been a good time to purchase the stock. Trying to estimate the future however tends to more difficult.

In previous posts we looked at the FASTgraphs ‘Estimating’ tab for a comprehensive approach to predicting the future growth of our stocks. If you are looking for something quicker or confirmation on what you learned from your FASTgraphs analysis, here are a couple of other options.

A lot of dividend growth investors use the simple Yield + Growth formula to quickly arrive at a decision on whether to enter a position. If starting yield is 4% and growth is 6% then you can reasonably expect to make a 10% return on your investment. Where this formula fails, at least in the short run, is when the current valuation is abnormally high. A stock, with the above metrics, that trades at a current valuation of a 20 P/E when it’s average is 15 is more likely than not to generate a lower annual return over the next few years simply because it’s current valuation is too high. The market will eventually price the stock closer to its average P/E and your short-term returns will suffer.

John Bogle, the founder of the Vanguard Group, has a better methodology for estimating future returns. What I like about Bogle’s formula is that it back tests well and seems to align with the dividend growth stocks we invest in.

Jack Bogle’s expected return formula:

Future Market Returns = Dividend Yield + Earnings Growth +/- Change in P/E Ratio

Bogle calls the first two components, Yield + Growth, investment aspects of the investment return and the last component, +/- Change in P/E Ratio, the speculative return – what will people pay for a dollar’s worth of earnings. 

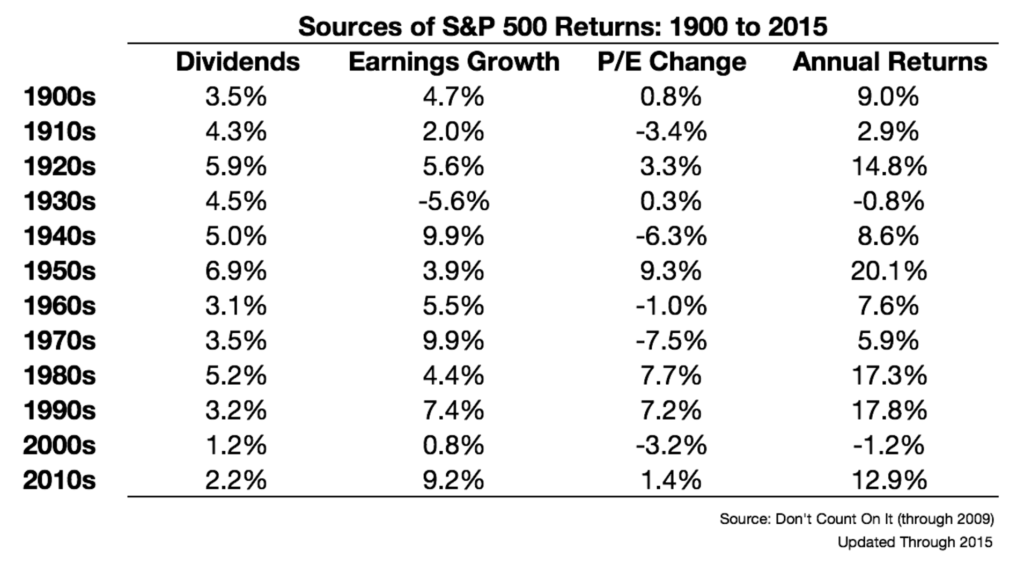
In his book ‘Don’t Count On It’ Bogle provides a long-term look at how this formula has played out by decade going all the way back to 1900.

This data is quite interesting because it gets to the core of what we do as dividend growth investors. Yield and Growth are stalwarts in our dividend growth philosophy and have done well over the years. The data then suggests that if we hold long enough or buy when P/E’s are more reasonable we can avoid most of the sub-par annual returns in Bogle’s chart.

Tom Connolly calls the speculative return component (P/E Change) the ‘Excitement Factor’. A high P/E means people are excited about stocks and a lower P/E the opposite. The most important takeaway in Bogle’s chart is just how much the ‘Excitement Factor’ affects annual returns. Paying attention to this key component can make the difference between average and above average returns going forward, especially in the short term.

Total Dividends Paid Over the Last Decade

Posted by BM on June 7, 2021 

‘The List’ attached is sorted by total dividends paid over ten years. Invest $10,000 in each stock in ‘The List’ on January 1, 2011 and you can see how much you would have received in total dividends alone over the past decade. The average is a little over 50% of your initial investment ($5,139). Starting yield (YLD ’11) has a big impact on dividends paid in the first ten years but some of our low yield high growth stocks are gaining fast. It will be interesting to run this report in another ten years’ time to see how things have changed.

By looking in the 2011 column and comparing it to 2020, you will notice that most doubled their dividend in the past decade. Growing income in our retirement is why we invest in dividend growth stocks.

Which stocks are best? High yield low growth or low yield high growth. Each investor is a little bit different. Maybe a hybrid approach will work best for most.

Here is ‘The List’ in total dividends paid order: 10YR_DIV_PAID.PDF

We buy quality individual dividend growth stocks when they are sensibly priced and hold for the growing income.