“You have a pair of pants. In the left pocket, you have $100. You take $1 out of the left pocket and put in the right pocket. You now have $101. There is no diminution of dollars in your left pocket. That is one magic pair of pants.”

The P/E 10 Ratio (CAPE) as a value indicator

Posted by BM on April 30, 2021 

CAPE is the current price of a stock divided by the average of the last ten years of earnings. We think it is a truer P/E as it smooths out profits…the effects of economic cycles. Ben Graham liked a longer-term trailing P/E as well. Like all our value indicators we are looking for expensiveness. Lower CAPE is better.

“The P/E 10 ratio is a valuation measure generally applied to broad equity indices that use real per-share earnings over 10 years. The P/E 10 ratio also uses smoothed real earnings to eliminate the fluctuations in net income caused by variations in profit margins over a typical business cycle.

Conventional short-term Price to Earnings (P/E) ratios can sometimes be useless as a value indicator in periods of extreme market volatility. This happens when earnings fall faster than price.

Legendary economist and value investor Benjamin Graham noticed the same bizarre P/E behavior during the Roaring Twenties and subsequent market crash. Graham collaborated with David Dodd to devise a more accurate way to calculate the market’s value, which they discussed in their 1934 classic book, Security Analysis. They attributed the illogical P/E ratios to temporary and sometimes extreme fluctuations in the business cycle. Their solution was to divide the price by a multi-year average of earnings and suggested 5, 7 or 10-years. Yale professor and Nobel laureate Robert Shiller, the author of Irrational Exuberance, has popularized the concept to a wider audience of investors and has selected the 10-year average of “real” (inflation-adjusted) earnings as the denominator. Shiller refers to this ratio as the Cyclically Adjusted Price Earnings Ratio, abbreviated as CAPE, or the more precise P/E10, which is our preferred abbreviation.
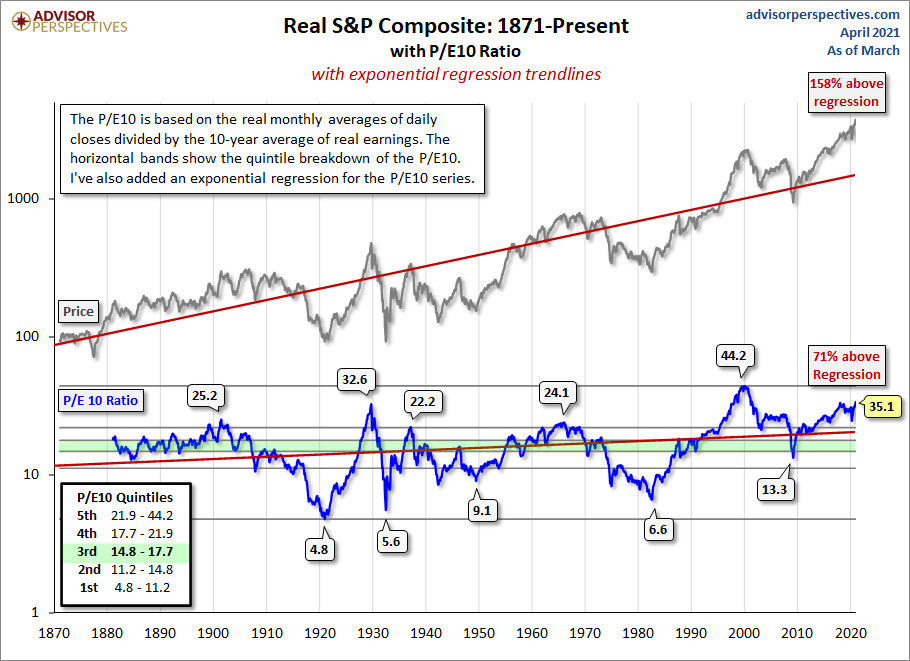
Having metrics (CAPE) and graphical representations such as above helps us as investors quickly grasp the expensiveness of markets in general or businesses within the market. 

One of the great quotes I hear all the time is from one of my mentors, Chuck Carnevale, who often precedes many of his ‘valuation’ videos with the phrase “It’s a market of stocks not a stock market.”

We can review the CAPE of ‘The List’ (our ‘market of stocks’) and see if we can find any ideas. CAPE-The List-04-23-2021

There is always value to be found in the market by seeking out and analyzing individual stocks. It is however prudent to remember that when the market’s CAPE is extremely high, those opportunities may not be as plentiful and an investor should be more cautious.

In my next post on valuation, I will use the FASTgraphs tool (developed by Chuck Carnevale) to quickly analyze our dividend growth stocks. All of our ‘value indicators’ (Yield Difference, Graham Number and CAPE) are ‘graphically displayed’ to give us a quick understanding of the businesses fundamentals and valuation.

The Graham Number as a value indicator

Posted by BM on April 26, 2021 

We use the Graham Number to aid in our selection process and decide which businesses make good candidates for further research.

The Graham Number is a figure that measures a stock’s fundamental value by considering the company’s earnings per share and book value per share. The Graham Number is the upper bound of the price range that a defensive investor should pay for the stock. According to the theory, any stock price below the Graham Number is considered undervalued and thus worth investing in. The formula is as follows:

The Graham value/price we use is a modified version: square root of ((average of last three years earning per share * book value per share) * 22.5).

Source: Tom Connolly

The term is also sometimes referred to as Benjamin Graham’s Number.

Understanding the Graham Number

The Graham Number is named after the “father of value investing,” Benjamin Graham. It is used as a general test when trying to identify stocks that are currently selling for a good price. The 22.5 is included in the calculation to account for Graham’s belief that the price to earnings ratio should not be over 15 and the price to book ratio should not be over 1.5 (15 x 1.5 = 22.5).

The 7 Filters for Using the Graham Value:

  1. Seek Safety with Large Predictable companies.
    1. Look for stocks with at least $100m in sales (back in 1970’s). Adjusted for inflation, that number should be around $465 million. We use $1 Billion for our Canadian dividend growth companies.
  2. Strong Financial Condition to Prevent Bankruptcy.
    1. Current ratio > 2
    2. Long term debt < working capital
  3. Earnings Stability.
    1. No losses over the past 10 years. Companies that can maintain positive earnings are more stable.
  4. Consistent Dividends.
    1. The company should have a history of paying dividends without problems for the past 20 years. Check the payout ratio here. There are very few Canadian dividend growth companies with a record of 20 years (only 7). We use 10 years of dividend growth instead
  5. Earnings Growth.
    1. Net income per share should have increased by at least a 1/3 in the past 10 years.
  6. Price to Earnings Ratio Below 15.
  7. Price to Book below 1.5.

You can see that points number 6 and 7 make up the Graham Number.

Combine criteria 1 through 5 and you have got the full Graham Number methodology.

But there are limitations you must know.

  1. Only works for companies with positive earnings and positive tangible book value.
  2. Graham Number does not take growth into account. Therefore, it underestimates the values of the companies that have good earnings growth. We feel that if the earnings per share grows more than 10% a year, Graham Number underestimates the value.
  3. Graham Number punishes the companies that have temporarily low earnings. Therefore, an average of earnings makes more sense in the calculation of Graham Number.
  4. Underestimates stocks with little tangible assets or companies that are book ‘light’. Industries like software, service and information will not make the list.

In general, the Graham Number is a very conservative way of valuing a stock. It cannot be applied to companies with negative book values.

Source: Old School Value website

https://www.oldschoolvalue.com/stock-valuation/graham-number/

We do a sort on ‘The List’ list using the Graham Number to compare with a stock’s current price. If the current price is significantly higher, we do not investigate further. On the other hand, a positive percent difference between the Graham Number (GRAHAM $) and the current price (PRICE $) tells us to look closer.  I generally review stocks with a current price within 20% of the GRAHAM $ to be sure I don’t miss a good BUY signal.

Here is ‘The List’ with comments, sorted in G%D order as of April 23, 2021.  GRAHAM-The List-04-23-2021.PDF

Yield Difference as a value indicator

Posted by BM on April 18, 2021 

We use yield as one of our key value indicators. The current yield, however, does not tell you much unless you have an idea of a specific company’s historic yield. This logic is based upon a theory that has been around since at least the 1960s (Dividend Yield Theory) and was popularized by asset manager and investment newsletter publisher Investment Quality Trends, known as IQT.

Dividend growth investing has been a great way to grow both your income and capital over time but that does not mean that you can buy any stock at any time and expect to do well. Overpaying, even for a quality dividend growth stock will minimize your future returns.

Warren Buffet is quoted as saying that “it’s better to buy a wonderful company at a fair price than a fair company at a wonderful price”. But how exactly do you determine what a “fair price” is?

We use yield difference to screen for candidates.

Dividend yield theory is simple and intuitive. It basically says that for quality dividend growth stocks, meaning those with stable business models that do not significantly change over time, dividend yields tend to revert to the mean.

In other words, a stock’s dividend yield fluctuates around a relatively fixed level over the years that approximates fair value. If the stock’s current yield is far enough above its historical yield, then the stock is likely undervalued. And if its yield is beneath its historical norm, then the stock could be overvalued.

While the dividend yield theory has proven to be a useful valuation tool in many situations, it is important to realize that it works best under long-term conditions (5+year time frames) and with quality dividend stocks that possess (1) secure dividends, (2) generous payouts, and (3) stable business models.

Source Simply Safe Dividends

Here is ‘The List’ in yield difference order as of April 16, 2021. YLD_DIFF-The List-04-16-2021

A couple thoughts from this report. ‘The List’ has already been screened for dividend growth stocks of above average quality. We get our ideas for stocks to buy from ‘The List’ that are above or close to the bold line. From there we drill deeper into other value indicators and future estimates of growth before we purchase. Having a screen based on dividend yield theory can help us minimize our chances of overpaying for most of the stocks on ‘The List’.

Thus, a quality dividend growth stock’s historical dividend yield can provide a reasonable fair value indicator that you can use to ensure you are buying wonderful companies at a fair price or better.

Yield shortage spawning a movement in DGI

Posted by BM on April 11, 2021 

Apart from the above average returns and growing income that have attracted dividend growth investors for years, we now have another catalyst to pique your interest, yield shortage.

In this recent article from Barron’s, the author points out that the yield of a 50-50 portfolio of stocks and bonds, once a reliable source of income for retirees, has dwindled to below 2%.

https://www.barrons.com/articles/yes-you-can-retire-on-dividends-10-stocks-to-build-an-income-stream-for-the-long-haul-51616752801

“Such paltry yields can make dividend stocks an attractive investment centerpiece for retirees. They can offer nice yields, and unlike fixed bond coupons, dividends can grow to hedge inflation, which many experts expect to tick up.

The strategy has spawned something of a movement, encompassing investors of all ages and levels of sophistication. There are Facebook groups devoted to the topic along with blogs, newsletters, books, and various other platforms.

But these investors are not your GameStop traders or momentum players. They are in many cases diligent investors adopting sound strategies to build a portfolio for the long haul, investing sometimes $100 here or $50 there. They’re more like modern-day moms and pops.”

The article also quotes Bob Baker, a retired aerospace engineer, who zeroed in on dividend growth investing in 2015 shortly after his retirement.

 “Once I fully understood the significance of dividends from quality companies, a priority focus for me was not to have to sell any shares of any holdings.”

Barron’s then reached out to several other dividend growth investors and found that Bob Baker was not alone. Many believed that it was possible to manage a dividend growth portfolio for long term returns while at the same time minimizing risk.

Another article this week in the Globe & Mail, John Heinzl, who has been publishing the results of his model dividend portfolio since 2017 (20 companies with a history of raising their dividends), seems to agree.

https://www.theglobeandmail.com/investing/education/article-the-beauty-of-compound-growth-this-is-why-you-should-be-reinvesting/

“Reinvesting dividends is one of the keys to building wealth. Whether you enroll your stocks in a dividend reinvestment plan or reinvest your dividends manually when a sufficient amount of cash builds up, you’ll be putting the power of compounding in your corner.

The beauty of compound growth is that it accelerates over time, like the proverbial snowball that gets bigger as it rolls downhill. When compounding is combined with dividend growth and capital appreciation, it can achieve some extraordinary results over the long run.”

Whether you are young or old, need help with investing or are an experienced investor, it is hard to ignore the many benefits of a dividend growth strategy especially when the alternatives are not that appealing these days.

Rising interest rates are not a dividend growth stock killer

Posted by BM on April 1, 2021  

In this March 26, Globe and Mail article the author addresses the theory that as interest rates rise dividend stocks drop. https://www.theglobeandmail.com/investing/education/article-dont-let-rising-rates-derail-your-dividend-plan/

“But Brian Belski, chief investment strategist with BMO Capital Markets, has come to a different conclusion after examining 30 years’ worth of data: Even as some dividend stocks struggle when rates are rising, companies that regularly raise their dividends have historically outperformed the market during such periods.”

Our good dividend growers seem to be immune from such myths.

“Rising rates are not a dividend-growth-stock killer, Mr. Belski concluded. Companies that are able to continue paying or even increase their dividends during challenging times are the epitome of high quality and stability, in our view.”

The article goes on to quote other studies that back this up showing that declines in dividend growth stocks triggered by rising interest rates are often only temporary. 

The author uses Fortis Inc. (FTS) as a recent example of this behavior in the first week of March when rates were rising. The stock has rebounded nicely off its lows since. 

It pays to have a ‘List’ of good dividend growers handy so that when buying opportunities arise you are confident in ‘pulling the trigger’.

We buy quality individual dividend growth stocks when they are sensibly priced and hold for the growing income.